
- Published on 12 September 2022
This section presents the case study companies in ten detailed fact sheets that comprise the main information used for the research: landholdings, and company ownership. You will also find a brief methodology below explaining why they were chosen, and what information was gathered and analysed.
Download Who Owns Cairo? FULL REPORT
Company Fact Sheets
(Link for published fact sheets will appear on a rolling basis)
Talaat Moustafa Group Holding TMGH.CA
Palm Hills Development Company PHDC.CA
Heliopolis Company for Housing and Development HELI.CA
Six of October Development & Investment SODIC OCDI.CA
Emaar Misr for Development EMFD.CA
Madinet Nasr Housing & Development MHHD.CA
Housing and Development Bank HDBK.CA
Orascom Development Egypt ORHD.CA
Pioneers Properties For Urban Development PREDCO PRDC.CA
Porto Group Holding PORT.CA (Now: Arab Developers Holding ARAB.CA)
How Were the Companies Chosen?
From the outset we focused on companies listed on the Egyptian Stock Exchange (EGX) as non-listed companies rarely provide financial data, and almost never provider ownership data. On the other hand, a vast trove of data does exist for EGX listed companies, made available by the stipulated stock market disclosures on finances, ownership and significant activities. Though as you will see, even this was not enough for the study purposes.
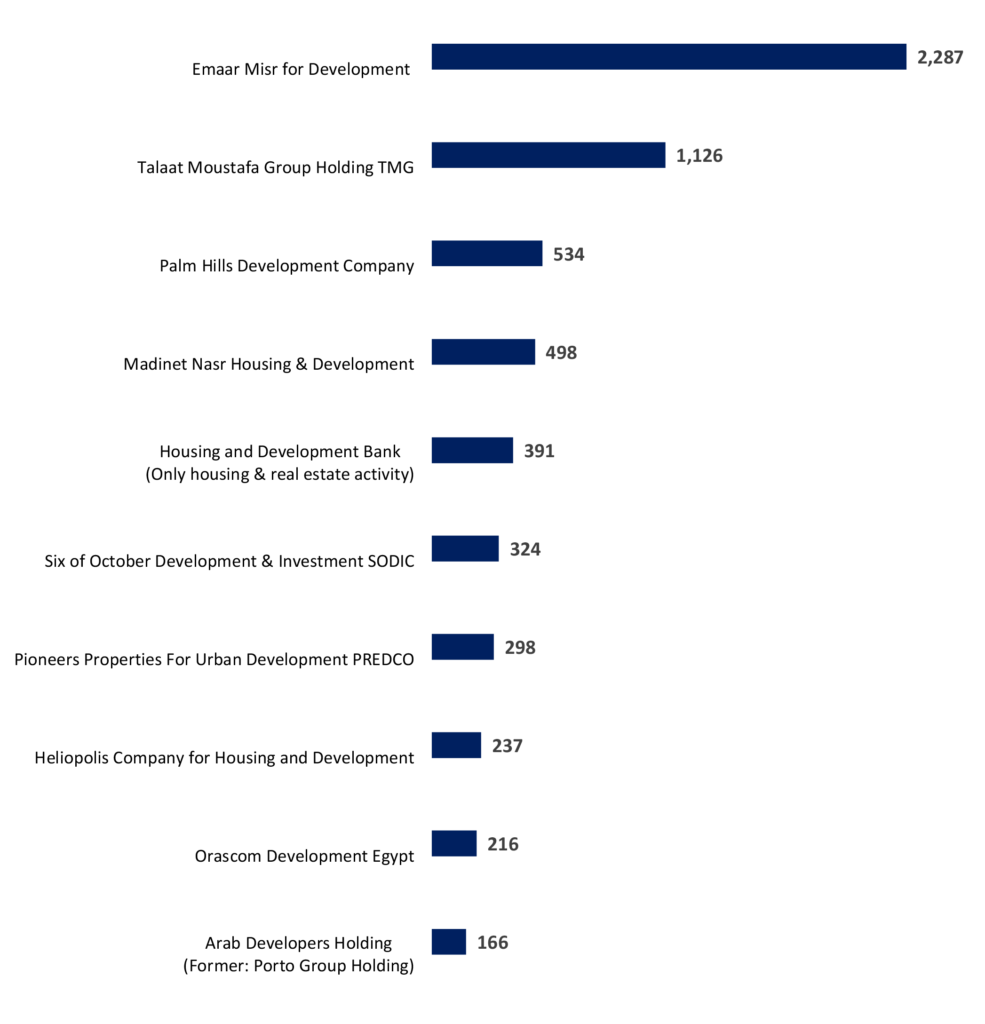
We initially chose the top ten companies whose activity is categorised as ‘real estate’ in 2021 by the EGX, according to their profitability. Given the fluctuating nature of financial performance, we established the top ten most profitable companies over the last decade, calculating their average annual profits between 2010, the year before the revolution and significant market stagnation, through 2021, the year the study was initiated (See Appendix 1). Unsurprisingly, most of the chosen companies have been both temporary and more stable features of the EGX 30 Index, the stock market’s top 30 companies. However, further research found a number of listed companies with significant real estate activity that were categorised under other industries because they have significant activities in those categories as well. However, EGX listed under ‘banking’, the Housing and Development Bank’s HDBK.CA real estate profits were the only ones we were able to disaggregate as its financial statements clearly separated housing and real estate from its banking information. Overall, its profits fell within the initial top ten companies as so, was included (Figure 1). It is of note, that the case study indirectly includes a further four listed real estate companies who have Pioneers Properties for Urban Development PRDC.CA as their major shareholder: El Kahera Housing ELKA, United Company for Housing and Development UNIT, Giza General Contracting and Real Estate Investment Co SAE GGCC, and Elsaeed Contracting and Real Estate Investment Company SCCD UEGC.
Figure 1: Top ten real estate companies listed on the EGX by average annual profitability between 2010-2021 (EGP mn.)
The second level of analysis investigated their operations in our case study location, the Greater Cairo region.[1] It was found that all companies did have real estate activity within the region and so non were omitted. However, their landholdings in Cairo compared to the rest of their landbank varied from significant to secondary, thus their landholding ranking may vary widely from their financial rankings. On the other hand, many companies known to the public as big, or who may have larger landholdings in Cairo than some in the case study are not found here. That is simply because they are not listed on the EGX, are not partly owned by a listed company, or may be a subsidiary though without activities in Cairo.
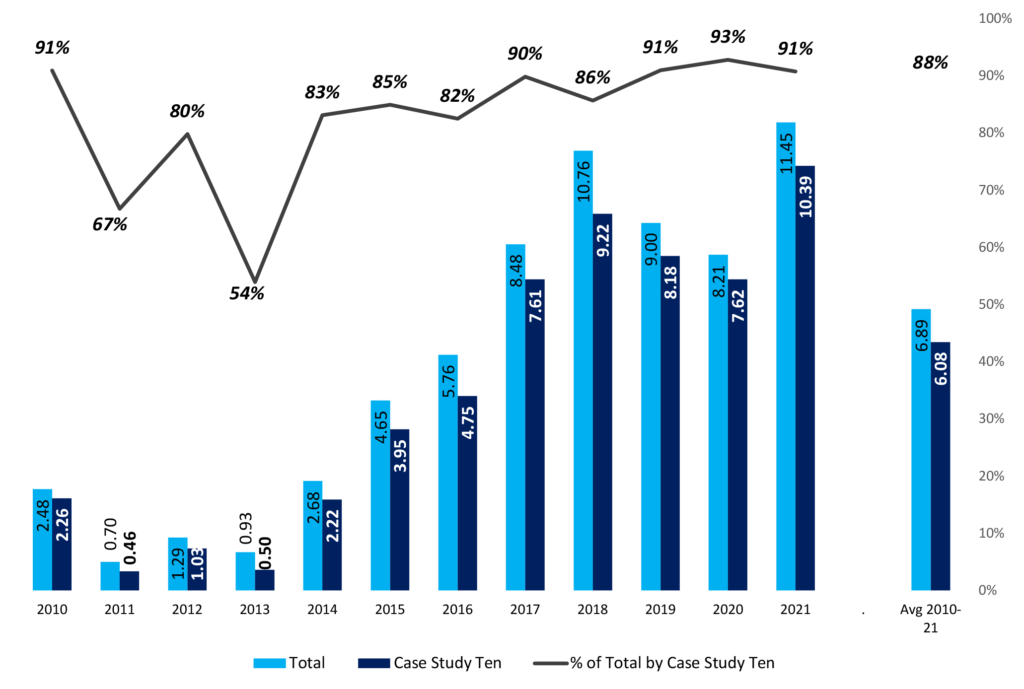
When the top ten companies’ long-term profitability (2010-2021) was calculated, we found that they comprised an average of 88% of the entire listed real estate activity of over 30 companies (Figure 2). This is a clear indication that the performance of the real estate sector is highly concentrated in these ten companies, and thus they are able to be indicative of the real estate sector as a whole in Cairo.
Figure 2: Net profits of the EGX listed real estate companies compared to the top ten 2010-2021 (EGP Bn)
What was Analysed?
After the case study companies were established, the research focused on two major points. The first was to establish each company’s landholdings in Cairo. In the factsheets, all company developments and land plots it was directly or indirectly in possession of, or still manages as of 31 December 2021, are listed. The listing also offers a timeline of the land acquisition showing both annual and aggregate values over a twenty-year time-frame (2002-2021). A third aspect of the landholdings is how they are differentiated by two main methodologies. The de jure methodology lists land plot areas as prorated according to the actual ownership. This can be less than 100% in instances where land is owned through a non-wholly owned subsidiary, or, if there is a co-development partnership agreement where the main company does not own the land, and thus its de jure ownership is listed as zero. Another method used for the study is the ‘control’, which was important to show land holdings as 100% in cases where they were majority owned through subsidiaries, or in partnerships, the brand name of the developer in question was the one used (For more see Methodology).
The other main information the factsheets analyse are the shareholding structures of each company. These trace direct, as well as indirect owners, according to two methodologies. The first is the Tax Resident (TR) method, where in cases of multi-level ownership though a number of companies, the last location where a company is registered. It is named thus a s most of the dividend and capital gains taxes should be captured there. The second is the ultimate beneficiary owners (UBO), that aimed to identify as far as possible, individual owners. In addition to the owners’ identities, there is data on nationalities, as well as the type of investor: high net worth individuals, or more usually families, governments, and where UBOs could not be established, private or listed companies (For more see Company Ownership Methodology).
Appendix 1: EGX Real Estate Companies Average Net Annual Profits 2010-2021 (LE Mn)
Sources: EGX disclosure documents (financial statements), and financial data on Mubasher Egypt – Corporate Earnings.
| Rank | EGX Real Estate Companies in 2021 | Code | Listed | Average Annual Nt Profits 2010-2021 (LE Mn.) |
| Total | 6,886 | |||
| Case Study Ten | 6,077 | |||
| 1 | Emaar Misr for Development | EMFD.CA | 2015 | 2,287 |
| 2 | Talaat Moustafa Group Holding TMG | TMGH.CA | 2007 | 1,126 |
| 3 | Palm Hills Development Company | PHDC.CA | 2009 | 534 |
| 4 | Madinet Nasr Housing & Development | MNHD.CA | 2007 | 498 |
| 5 | Housing and Development Bank (Only housing & real estate activity) |
HDBK.CA | 2009 | 391 |
| 6 | Six of October Development & Investment SODIC | OCDI.CA | 2009 | 324 |
| 7 | Pioneers Properties For Urban Development PREDCO | PRDC.CA | 2021 | 298 |
| 8 | Heliopolis Company for Housing and Development | HELI.CA | 2009 | 237 |
| 9 | Orascom Development Egypt | ORHD.CA | 2009 | 216 |
| 10 | Arab Developers Holding (Former: Porto Group Holding) |
PORT/ ARAB.CA | 2010 | 166 |
| 11 | Zahraa Maadi Investment & Development | ZMID.CA | 2009 | 157 |
| 12 | El Kahera Housing | ELKA.CA | 2009 | 113 |
| 13 | Amer Group Holding | AMER.CA | 2015 | 87 |
| 14 | El Shams Housing & Urbanization | ELSH.CA | 2009 | 74 |
| 15 | Development & Engineering Consultants | DAPH.CA | 2009 | 69 |
| 16 | Elsaeed Contracting& Real Estate Investment Company | UEGC.CA | 2018 | 64 |
| 17 | United Housing & Development | UNIT.CA | 2010 | 63 |
| 18 | Giza General Contracting and Real Estate Investment Co | GGCC.CA | 1997 | 42 |
| 19 | National Housing for Professional Syndicates | NHPS.CA | 2009 | 28 |
| 20 | Emerald Real Estate Investment | EMRI.CA | 2018 | 23 |
| 21 | Marseille Almasreia Alkhalegeya For Holding Investment | MAAL.CA | 2011 | 10 |
| 22 | REACAP Financial Investments Co. | REAC.CA | 2018 | 21 |
| 23 | Egyptians Housing Development & Reconstruction | EHDR.CA | 2009 | 17 |
| 24 | Egyptian Real Estate Group | AREH.CA | 2009 | 13 |
| 25 | Arab Co. for Asset Management And Development | ACAMD.CA | 2018 | 11 |
| 26 | Tanmiya for Real Estate Investment | TANM.CA | 2021 | 7.0 |
| 27 | Delta Construction & Rebuilding | DCRC.CA | 2018 | 6.2 |
| 28 | Arab Real Estate Investment Co. | RREI.CA | 2010 | 4.2 |
| 29 | International Co For Investment & Development | ICID.CA | 2009 | 4.2 |
| 30 | Gharbia Islamic Housing Development | GIHD.CA | 2009 | 1.6 |
| 31 | El Obour Real Estate Investment | OBRI.CA | 2014 | 1.0 |
| 32 | Gulf Canadian Real Estate Investment Co. | CCRS.CA | 2009 | -0.1 |
| 33 | Ismailia Development and Real Estate Co. | IDRE.CA | 2011 | -0.9 |
| 34 | Mena Touristic & Real Estate Investment | MENA.CA | 2009 | -6.4 |
[1] As there is no administrative metropolis, we have identified Greater Cairo in this study as the contiguous urban agglomeration in the Cairo and Giza governorates made up of Cairo and Giza cities, as well as the 11 new desert cities around them as of 2021: New Cairo, New Administrative Capital, Shorouk, and Capital Gardens in Cairo Governorate, and: 6th of October City, October Gardens, Sheikh Zayed and New Sphinx in the Giza governorate.