- Published on 16 September 2022
After finding out the land holdings and ownership structures of each of the top ten listed real estate companies in Egypt in Section I, Section II is a comparative aggregation of the shareholding and landholding data across all ten companies to give a comprehensive overview of the real estate sector showing Cairo’s top landholders, their typologies – individuals, governments or funds, as well as their nationalities.
Download Who Owns Cairo? FULL REPORT
Executive Summary
Landholding by investor type
Almost two thirds of Cairo’s case study land of 41,000 acres was traced to four identifiable investor groups: Private individuals/families, states, private companies, and listed funds. The remaining 35% of land was held by thousands of unidentifiable smallholders on the stock exchange free floats.
Leading the known investors are private individuals, or more so business families, where 93 of them held 36% of the case study land. Incredibly, 85% of this group’s landholdings was owned by just seven investors with controlling stakes in five of the ten listed real estate companies.
The second largest owner of Cairo’s land were states, where both Egyptian and foreign SOEs owned 25% of the case study land. These holdings were unevenly distributed between four states, where the Government of Egypt was found to control two of the ten case study companies, and that of the UAE another two. The governments of Norway and Kuwait had minority holdings across the companies.
In third place were two private companies the study could not determine their owners, and who held 4% of the case study land. These were the globally known Vanguard Group, Inc., with smallholdings in seven of the ten case study companies , and the BIG Investment Group Ltd, a special investment fund owning a controlling share in one of the case study companies. Under ideal circumstances where there is more ownership transparency, this group’s holdings would be zero.
In fourth and last place, are large, transnational corporations listed on stock exchanges owning 1% of the case study land. Leading them is BlackRock Inc. the largest asset manager in the world, holding a small number of shares in five of the ten companies, followed by HSBC Holdings and many others with microholdings. While it is possible to identify their direct controlling owners, given their smallholding, it served the study better to keep them as is.
Landholding by nationality
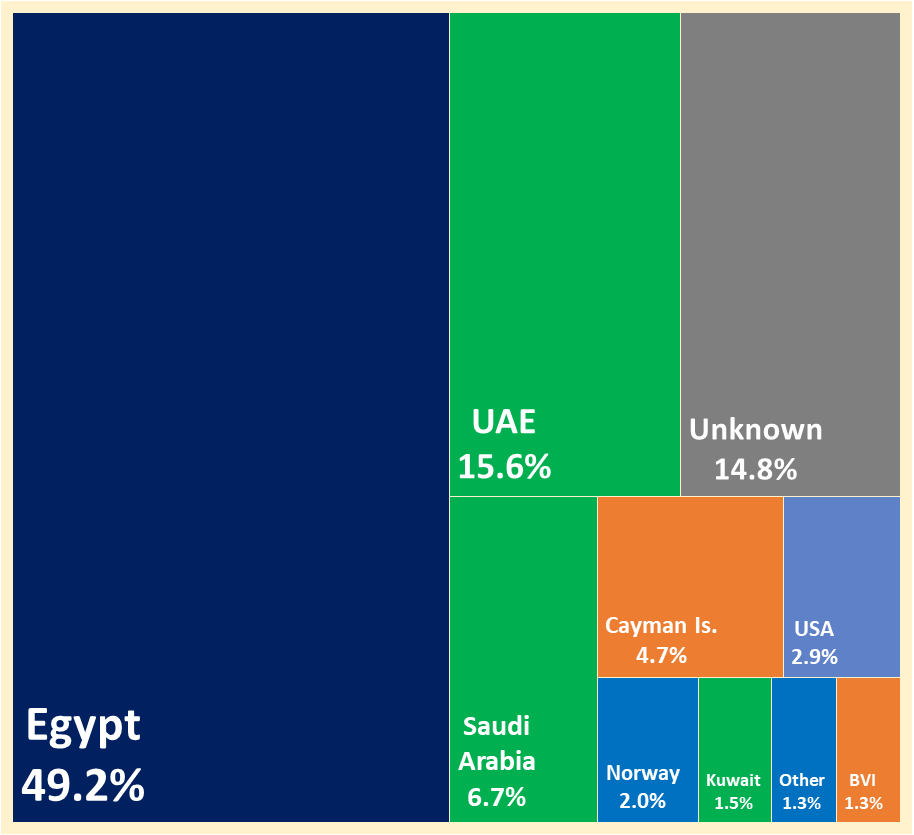
Using the tax resident nation of the last foreign institutional owner, Egypt-based investors were the largest investors by nationality, possessing barely half the case study land. In second place were UAE-based investors owning almost 16% of the case study land. The third largest group were investors of unknown nationalities, non-local smallholder investors on the EGX, as well as the UAE stock markets holding 15% of the land. In fourth place are Saudi based investors (6.7%), followed by the Cayman Islands (4.7%), the USA (3%), and Norway in seventh place at 2% of landholdings. Kuwait and the BVI hold almost 1.5% each, while other, mostly European-based investors held the remaining 1% of Cairo’s case study land.
Under the ultimate beneficiary ownership method, or UBO, Cairo’s case study land was owned by investors in just eight countries. Egyptian ownership increased by 4% to 53%, as identifiable offshore holdings were transferred here. In second place are the group of unknown nationalities comprising one fifth of land holdings. These include smallholders on stock exchange free floats, as well as anonymous high-net worth investors invested through funds and companies whose ownership structures remain confidential. In joint third place are UAE and Saudi Arabian investors, owning 11.5% of Cairo’s land each. In a distant fourth place, is Norway holding 2% of Cairo’s exchange listed land, followed by Kuwait as Cairo’s fifth largest landholder. Investors in the UK, Libya and Switzerland own the remaining 1% of land.
Cairo’s ultimate beneficiary owners
Half of Cairo’s case study land is held by only six investors. The next six hold only 10% of Cairo, while the remaining 82 identifiable investors own only 5% of the case study land. 35% of Cairo is in anonymous hands, mostly smallholders on stock exchange free floats.
The Government of Egypt (GoE) is the largest single owner of Cairo’s listed real estate possessing 6400 acres or 16% of Cairo. This is surprising given that a quarter of a century has passed since the first major round of privatization.
In second place is the Egypt-based Talaat Moustafa family, which possess 5600 acres in Cairo, or 14% of the case study land. In third place are and the Saudi Bin Laden family, which possesses 2800 acres in Cairo, or 7% of the case study land.
In fourth place is the Government of the UAE, possessing 2500 acres in Cairo, or 6% of the case study land. With 1900 acres, or 4.6% of the case study land, the Egypt-based Mansour Family is Cairo’s fifth largest landholder. In sixth place, is Saudi Arabian business family Al Rashed, possessing almost 1400 acres, 3.3% of Cairo. The seventh largest land holder in Cairo is the Egyptian-Saudi El Maghraby family, possessing 1000 acres in Cairo, representing 2.5% of the case study land. The Government of Norway is Cairo’s eight largest landowner, holding 800 acres or 2% of the case study land through multiple small stakes held by its SWF, the Norges Bank.
Global asset manager, Vanguard, is Cairo’s ninth largest landowner, holding 700 acres or 1.7% of the case study land, and in tenth place is the Government of Kuwait, possessing 600 acres or 1.5% of Cairo’s case study land. The Sawiris family is Cairo’s 11th largest landholder, owning 500 acres or 1.3% of the case study land. On the issue of concentration of ownership, an estimated 95% of the case study land, whether through extraordinarily large landholdings, or, through multiple controlling or significant majority stakes.
What Type of Investors Own Cairo?
Nearly 100 investors with significant holdings in the ten case study companies were tracked down in this study. Stock markets usually classify investors as either retail – individuals with small holdings, or institutions – so-called high net worth individuals, as well as companies and funds.
What was interesting for this study, was that almost all companies and funds are ultimately owned by either individuals, or states. Therefore, we used a restructured investor typology as private investors or states first, and then sub-categorised their investment vehicles based on further typologies that had identifiable holdings of over 0.01% of shares for institutions, and 3% for individuals – as per the generally available data. For Private sector investors we identified: Individuals/ Families, Private (Non-listed) Companies – those that we could not identify their owners, or, decided to leave as is, and Listed Companies including their funds – those that we chose not to identify their owners (For more on investor types, see the Methodology). For states, we identified their holdings as State Owned Enterprises (SOEs), even if they did feature as companies, banks or funds, as government agencies such as ministries are their ultimate owner. A fifth category, Stock Market Free Float, gathered all investor types with micro-holdings – less than 0.01% for institutions, and less than 3% for individuals unless part of company management – that could not be identified as one of the other four categories (See Background Paper 1 | Disclosure). While the share of these investors may be large in a company, they cannot have any control as they are not represented on the board and, at least in Egypt, do not usually engage in collective voting.
Investor Types by TR Method
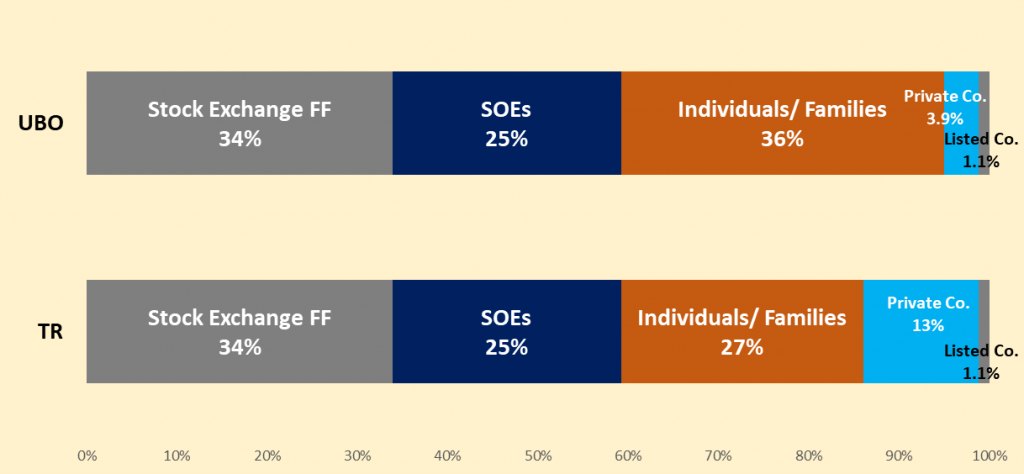
Using the Tax Resident (TR) method for investors (Where a shareholding company is tax resident. See Methodology), we find that unidentifiable smallholders on the stock exchange free floats are the largest investor, holding 34% of Cairo’s case study land (Figure 1). However, this group has no control over it as it lacks board representation. The second largest investor type, and the largest identifiable group, are Individual/families with holdings of 27% of Cairo’s land. State Owned Enterprises (SOEs), are in close third place, holding one quarter of the case study land. The fourth largest investor type under the TR method are Private Companies holding 13% of Cairo, most of which are registered in states other than where their owners are from, such as the Cayman Islands and the British Virgin Islands (BVI), though also in the UAE, Saudi Arabia and the USA. Listed companies and investment funds are the smallest investor type holding only 1.1% of the case study land.
Figure 1: Ultimate beneficiary owner (UBO) vs tax resident (TR) land ownership by investor type
Investor Types by UBO
Moving to the ultimate beneficiary ownership method, or UBO (Tracing the actual owners behind companies. See Methodology), almost two thirds of Cairo’s case study land of 41,000 acres was traced to the four identifiable investor groups. The remaining 35% of land was held by thousands of unidentifiable smallholders on the stock exchange free floats.
It is the Individuals/Families investor group whose holdings’ rise from second place to first holding 36% of Cairo’s case study land (Figure 1). This was mostly due to holdings shifting from the Private Company category, to this one, which reflects how a significant part of this category invests in the stock market through private companies established in a country other than their country of residence. This investor type is also more usually ‘families’ than individuals, with leading patriarchal heads acting as chairmen and/or CEOs (almost all were men), with brothers, sons and sometimes daughters and wives forming the main investor block and many of them serving on the boards, and to a lesser extent, executive management. A known trend in so-called emerging market counties, where an estimated 60-70% of companies are so owned, versus less than one third of large companies in developed markets such as on the New York stock Exchange.[1]
Analysing the top ten investors by landholdings, we find three major investment patterns. Seven investors or their families have controlling stakes in five of the ten case study companies – Talaat Moustafa and Bin Laden families in TMGH, Mansour and Al-Maghraby families in PHDC, the Sawiris family in ORHD, the Zaki family in PRDC and Abdel Salam Abdel Karim in PORTO (Figure 2). Moreover, one investor, the Sawiris family, have a minor stake in MNHD, in addition to their controlling stake in ORHD, while three Saudi Arabian investors, Al-Rashed, Olayan and Ali Dayekh, have small to significant minority stakes in more than one company – TMGH, MNHD, HDBK, and SODIC.
Figure 2: Shareholding of top ten Individuals/Families in case study companies (%)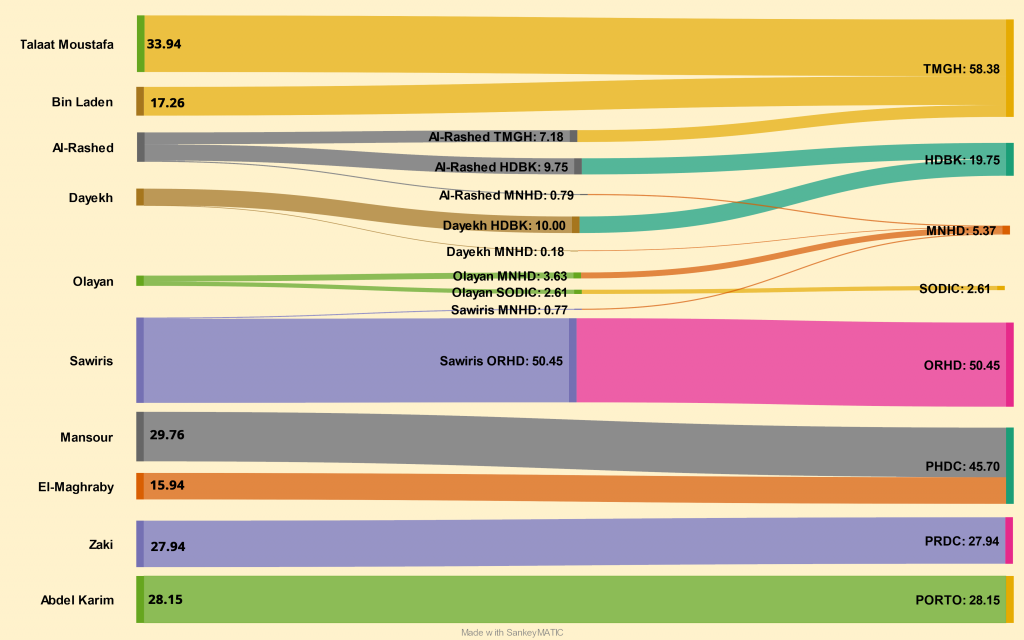
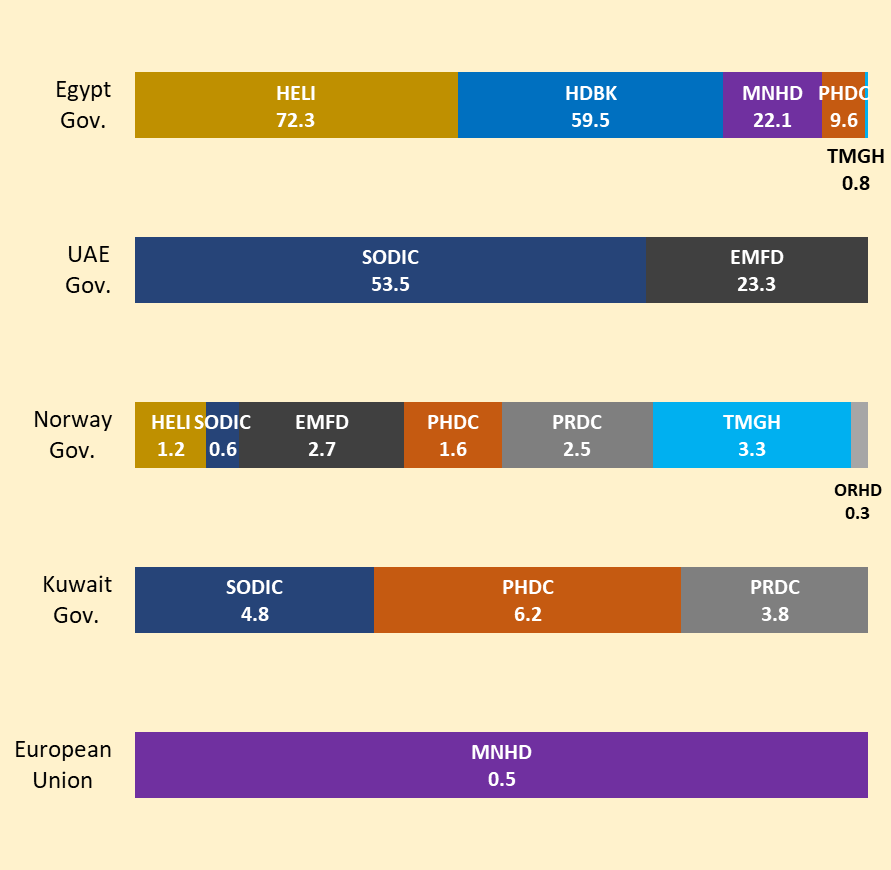
States were found to own 25% of Cairo under the UBO method through stakes in nine out of the ten case study companies (Figure 3), and were thus the second highest known investor category. The Government of Egypt (GoE) leads the share of SOEs, controlling 16% of the case study land through stakes, in half of the ten companies – HELI, HDBK, MNHD, PHDC, and TMGH (For more see Background Paper 2 | GoE Investments). This leaves two fifths of investments in this category by foreign SOEs. These are led by the Government of the UAE, owning 6% of the case study land, reflecting significant shares in EMFD and SODIC. The Government of Norway’s SWF, the Norges Bank, is the third largest SOE by land holdings, with small stakes – ranging from 0.3% to 3.3%) in seven out of the ten companies. This is followed by the Government of Kuwait’s SWF that shares a significant minority stake in PHDC through the Egypt-based AAIB, and minority stakes in SODIC and PRDC. The smallest SOE stake concerns the European Union (EU), through an indirect smallholding by the European Investment Bank (EIB) in MNHD.
Figure 3: SOE shareholding of case study companies (%)
This is a curious sector for SOEs to be so visible in. Globally they are concentrated in critical sectors of the economy, like extractives, energy, and transport. According to the IMF, they are responsible for over half of investments in infrastructure in developing countries, and between 20% to 60% of the banking system in certain G20 states.[2] Real estate however is not a crucial sector in terms of basic goods, or strategic control. Unless, it was for the provision of affordable housing, which none of the aforementioned companies provide.
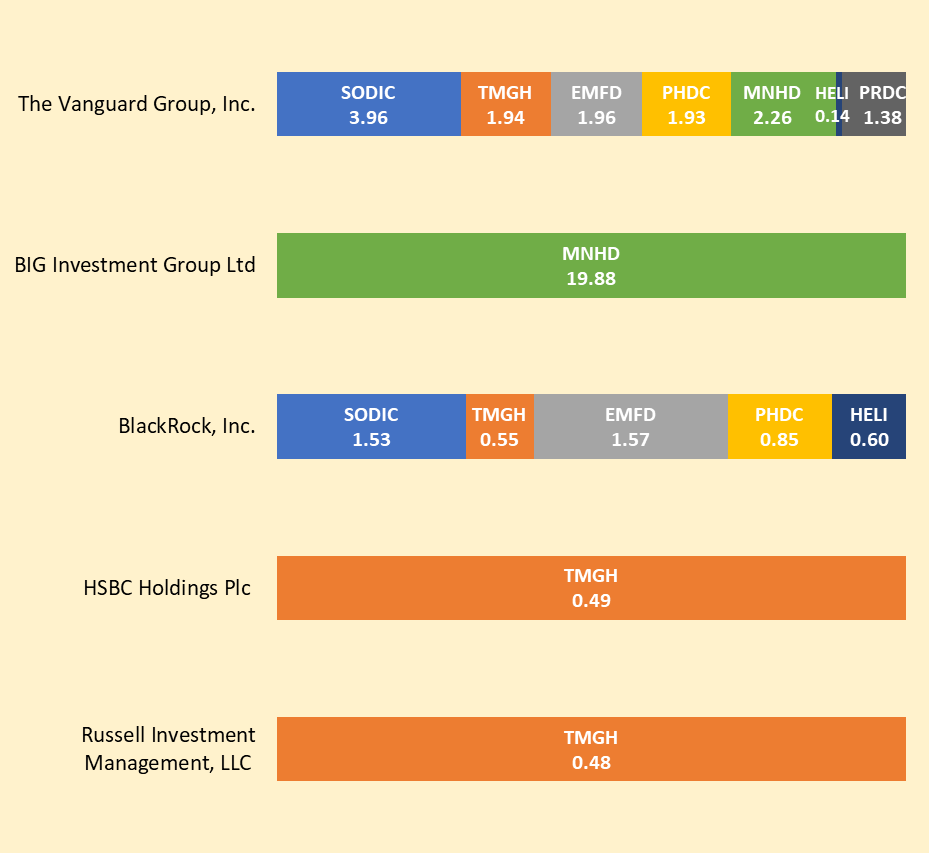
The fourth largest investor group, are private companies not listed on the stock exchange, owning 4% of the land under the UBO methodology. While this is a significant drop from 13% under the TR methodology, under ideal circumstances where there is more transparency on UBO, this portion by the control method should be zero. This group comprises holdings of just two companies whose ownership structures we were not able to identify. The Vanguard Group, Inc., a mammoth international asset manager forming part of the top three in the world,[3] with smallholdings in seven of the ten case study companies (Figure 4). It claims to be owned by investors and funds who have invested in it,[4] who remain anonymous because it is a private company registered under an agent in the US state of Delaware.[5] The other is the BIG Investment Group Ltd, a special investment fund set up in the in the BVI to buy a controlling share in MNHD (See company fact sheet). The fund is managed by an Egypt based company comprising Egyptian and Saudi investors, however the fund’s subscribers remain anonymous because its manager has not disclosed who they are.[6]
In fifth and last place, are large, transnational corporations listed on stock exchanges owning 1% of the case study land. Chief amongst these companies is BlackRock Inc., (BLK.N) the largest asset manager in the world, holding a small number of shares in five of the ten companies, followed by HSBC Holdings (HSBA.L), with a 0.5% holing in TMGH, and others with much smaller holdings (Figure 4). While it is possible to identify their direct controlling owners, given their smallholding, this would have diluted the ownership of the ultimate owners so that they would not have been seen [7]. Therefore, it was deemed more important to show these companies as they are, since they are all well known, or even infamous, for their interest in global real estate.
Figure 4: Top five private and listed investment funds’ shareholding in case study companies (%)
Where are the Owners From? 1: TR Method
According to the tax resident (TR) method (see Methodology), Egypt-based investors possessed barely half the case study land, where foreign investors possessed the other half of Cairo (Figure 5). This is a fresh finding as there have been no significant studies on ownership by nationality on the Egyptian Stock Exchange (See Background Paper 3 | Foreign Ownership). The second largest owner was the UAE, as investors based there owned almost 16% of the case study land. The third largest group were investors of unknown nationalities, non-local smallholder investors on the EGX, as well as the UAE stock markets holding 15% of the land. In fourth place are Saudi based investors (6.7%), followed by the Cayman Islands (4.7%), the USA (3%), and Norway in seventh place at 2% of landholdings. Kuwait and the BVI hold almost 1.5% each, while other, mostly European-based investors held the remaining 1% of Cairo’s case study land.
Figure 5: Case study landholding by nationality – TR Method (%)
Where are the Owners From? 2: UBO Method
Moving on from the TR method, which established ownership nationalities based on tax and legal premises, we now shift to nationalities based the UBO method, which gives us less a sense of legal jurisdictions, but more of an idea of where the owners of land in Egypt are culturally, or politically, from. Many of the natural persons identified here as of a certain nationality are not necessarily tax resident there, or carry dual or more nationalities (See Methodology). SOEs are of course the exception to this where their country of origin is where they are truly based, at least the ones covered in this study. Private or listed companies whose owners have not been identified are defined as having owners of unknown nationalities, as most in the list manage funds invested in by hundreds, if not thousands of people as well as other companies. Here we find some significant changes to the scale and order of nationalities as seen in the TR method before.
Figure 6: Case study landholding by nationality – UBO Method (%)
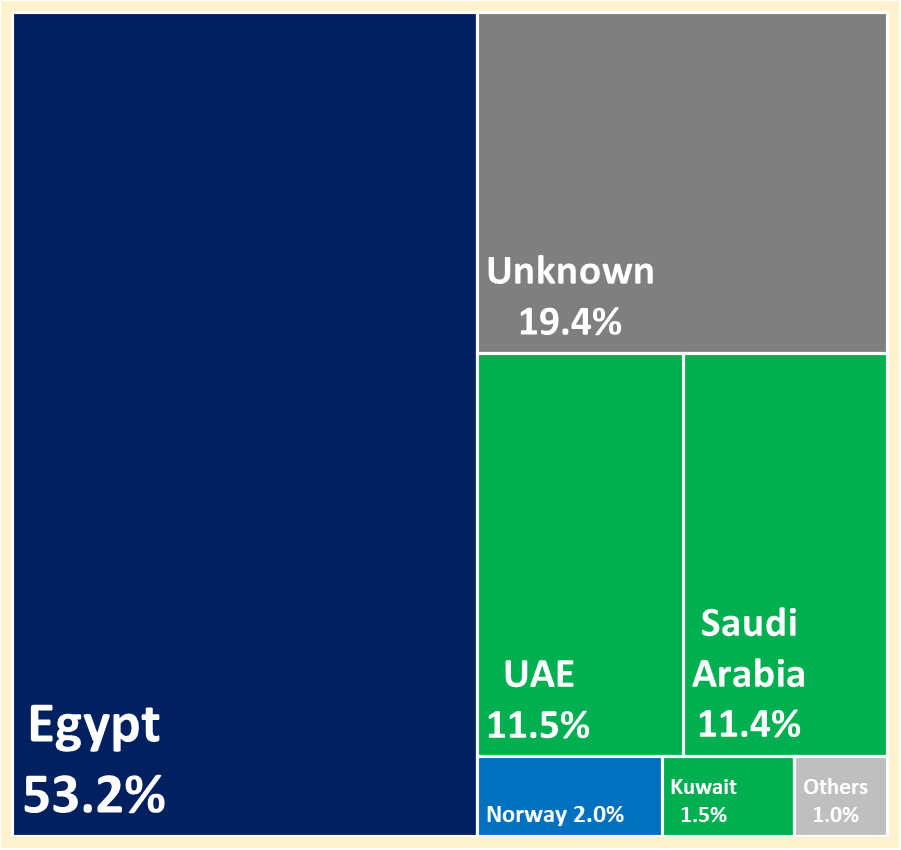
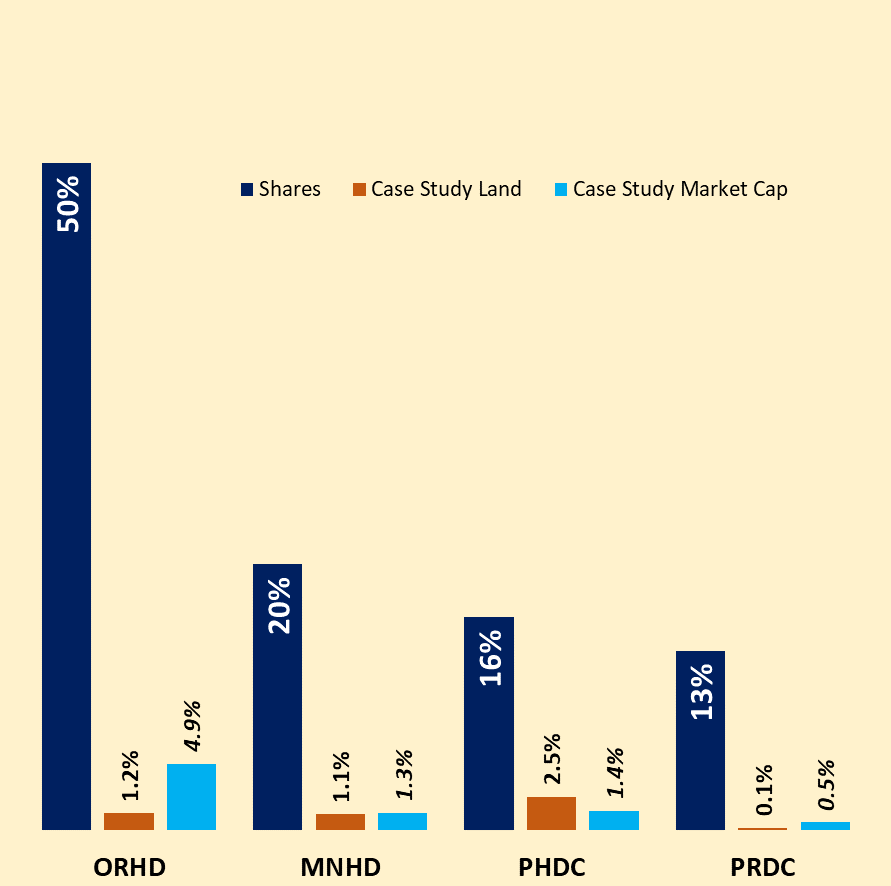
Egyptian ownership of the case study land increases by 4% to 53% (Figure 7). While it may mean that investments made by Egyptians through offshore companies are generally small, however, further analysis reveals that this is just a reflection of the relatively small landholdings these particular investors have in Cairo, while one significant offshore company’s investors, the BIG Investment Group which holds 1.1% of the case study land, remain anonymous, and so its share is listed in the ‘unknown’ category even though some investors may be Egyptian. Overall, this practice affects significant to major holdings of 13% to 50% in four of the ten case study companies – ORHD, MNHD, PHDC, and PRDC (see company factsheets), comprising of 8% of the ten case study companies by market capitalisation (Figure 7).
Figure 7: Case study companies with significant shareholding held offshore
The second largest investors by nationality is actually the group of unknown nationalities comprising one fifth of land holdings. In addition to the thousands of non-Egyptian investors with micro-holdings on stock exchange free floats, this group now includes anonymous high-net worth investors that have invested through investment funds, chiefly Vanguard, BlackRock and the BIG Investment Group.
In joint third place are UAE and Saudi Arabian investors, owning 11.5% of Cairo’s land each. This represents a significant change from the TR method, as the nationalities of a number of non-UAE investors that use companies based there are shifted to their home nationalities, thereby decreasing its landholding from almost 16%. On the other hand, Saudi Arabian landholdings almost double from 6.7%. In a distant fourth place, is Norway holding 2% of Cairo’s exchange listed land, all owned by its sovereign wealth fund. Kuwait is Cairo’s fifth largest landholder, possessing 1.5% of its land, while investors in the UK, Libya and Switzerland own the remaining 1% of land. Overall, the significant foreign owners of Cairo’s listed real estate come from only seven countries.
Who are Cairo’s Ultimate Beneficiary Owners?
After omitting 35% of the land held by stock market free floats, under the UBO method we find that half of Cairo’s case study land is held by only six investors (Figure 8). The next six hold only 10% of Cairo, while the remaining 82 identifiable investors own 5% of the case study land.
Overall, it is the Government of Egypt (GoE), that is the largest single owner of listed real estate possessing 6400 acres or 16% of Cairo.[8] In one way, this is a major surprise as more than a quarter of a century has passed since the first major round of privatizations, when the largest real estate developers were still state owned. While the larger part of these holdings represent majority or significant stakes in former wholly owned SOEs, HELI, HDBK and MNHD, they also include stakes in originally private companies: a significant minority in PHDC, and a small holding in TMGH (For more detail see Background Factsheet 2 | GoE Investments).
Figure 8: Top 14 Cairo landowners by UBO (% of case study land)
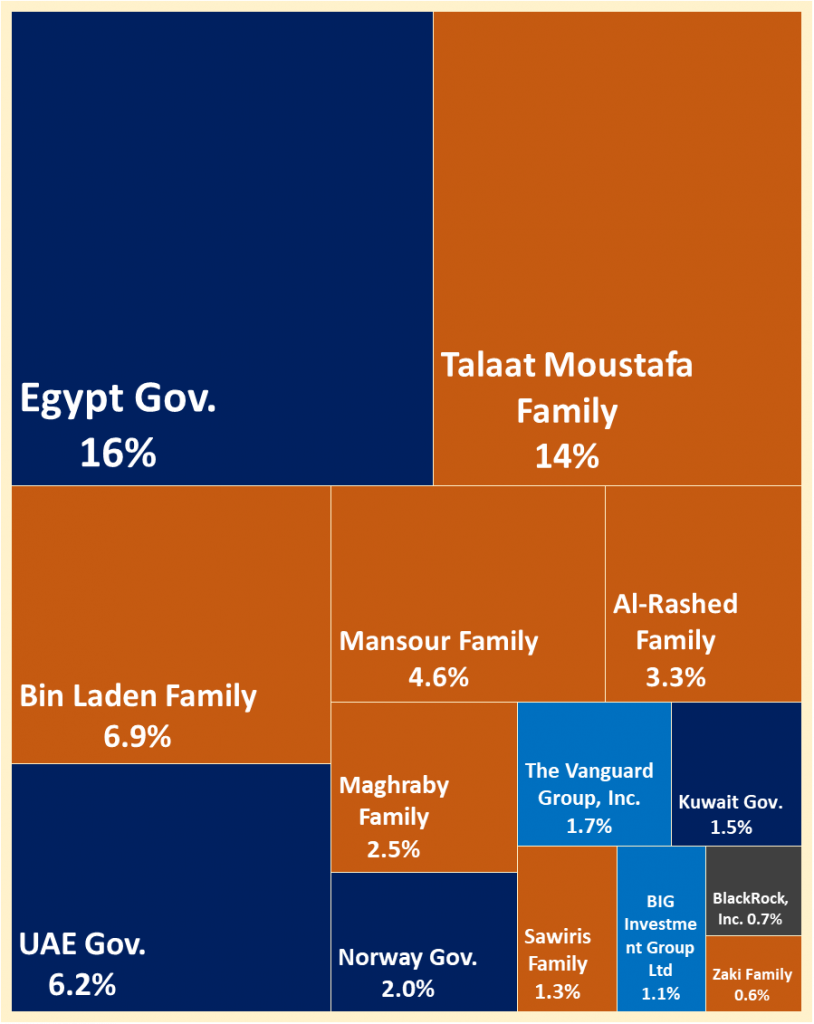
The second largest Cairo landowner is the Egypt-based Talaat Moustafa family, which possess 5600 acres in Cairo, comprising 14% of the case study land. This is no surprise, as the family is TMGH’s largest shareholder, which itself owns over two fifths of the case study land. In third place are and the Saudi Bin Laden family, which possesses 2800 acres in Cairo, or 7% of the case study land, again through its large stake in TMGH.
In fourth place is the second state to significantly control land, the Government of the UAE, possessing 2500 acres in Cairo. Its 6% stake is in two companies that its controls: EMFD which the Dubai-based Emaar set up in Egypt in the mid-2000s, and SODIC, an Egypt established company where the UAE government bought a majority stake in at the end of 2021.
With 1900 acres, or 4.6% of the case study land, the Egypt-based Mansour Family is Cairo’s fifth largest landholder, through its majority stake in PHDC. In sixth place, is another Saudi Arabian business family, Al Rashed, possessing almost 1400 acres, 3.3% of Cairo through significant minority holdings in HDBK and TMGH, and a small in-direct holding in MNHD.
The seventh largest land holder in Cairo is the Egyptian-Saudi El Maghraby family, possessing 1000 acres in Cairo through its major holdings in PHDC, representing 2.5% of the case study land. The Government of Norway is Cairo’s eight largest landowner, holding 800 acres or 2% of the case study land through multiple small stakes held by its SWF, the Norges Bank (Figure 3). Global asset manager, Vanguard, is Cairo’s ninth largest landowner, holding 700 acres or 1.7% of the case study land through smallholdings in seven of the ten companies (Figure 4). In tenth place is the Government of Kuwait, possessing 600 acres or 1.5% of Cairo’s case study land, through minority to small holdings in SODIC, PHDC, and PRDC. It also has significant holdings outside of the case study in the Egyptian-Kuwaiti Real Estate Development Co., and through its national developer, NREC. The Sawiris family is Cairo’s 11th largest landholder, owning 500 acres or 1.3% of the case study land through a majority stake in ORHD, and a small indirect stake in MNHD. It is worth noting that outside of the case study which included only listed companies, Samih Sawiris is a major investor in Al Ismaelia which is gentrifying over 20 buildings in Downtown Cairo, while brother Naguib Sawiris is the major shareholder of Ora Developers, an international real estate developer owning a number of developments in Cairo.
Conclusions
Putting all the information presented in this section together allows some patterns to be noticed, sometimes raising more questions to be answered than at the start of the study. In investor types, one pattern is clear, and that is how SOEs hold a significant share of the real estate business in Cairo. This raises questions on fair competition, but also about the social function of state enterprise, where the majority of projects analysed in this study cater to upper middle income and upper income buyers.
In terms of the nationality of investors, almost half of the case study land, and by inference, the market, has been internationalised, which means that foreign investors have a strong say in local urban and housing policies. It also means that this high level of financialization of housing has a direct negative impact on affordability for those that need it. This calls into question recent efforts to further internationalize it, especially where the Government of Egypt is seeking to sell new stakes in SOEs, some of which operate in the real estate sector. This can only affect affordability negatively if no measures are put in place to protect the buying and renting power of low- and middle-income residents, who already find adequate housing very unaffordable.
On the issue of concentration of ownership, an estimated 95% of the case study land is controlled or influenced by three groups of investors. TMGH alone owns 40% of the case study landholdings, reflecting its far larger than average land allocations, that were only possible because it partnered with the government by paying for it through revenue share rather agreements than cash. Further concentration is in the hands of the government of Egypt, which controls HELI and HDBK, together representing 18% of the case study land, though it also has significant minority holdings and is on the boards of two more companies, MNHD and PHDC, meaning that it has direct influence on four of the ten case study companies, or 40% of the case study land. The remaining control is based on the Government of the UAE’s controlling shares in EMFD and SODIC giving it a combined 15% of the land holdings. Some private investors have significant minorities in more than one company, or shared board members, but their combined landholdings are not very significant within the case study.
A more detailed analysis of these conclusions, along with recommendations for change, will be pursued in future editions of Who Owns Cairo?.
Notes and references
[1] Åsa Björnberg and Vivek Pandit, “The Family-Business Factor in Emerging Markets | McKinsey,” McKinsey Quarterly, December 1, 2014, https://www.mckinsey.com/featured-insights/winning-in-emerging-markets/the-family-business-factor-in-emerging-markets.
[2] “Fiscal Monitor – April 2020” (International Monetary Fund, April 2020), 48, https://www.imf.org/en/Publications/FM/Issues/2020/04/06/fiscal-monitor-april-2020
[3] Scott Hirst and Lucian Bebchuk, “The Specter of the Giant Three,” Boston University Law Review 99, no. 3 (May 1, 2019): 721, https://scholarship.law.bu.edu/faculty_scholarship/602.
[4] “What Sets Us Apart,” The Vanguard Group, Inc., n.d., https://corporate.vanguard.com/content/corporatesite/us/en/corp/who-we-are/sets-us-apart/index.html.
[5] The state is known for low income taxes and allows the use of agents to cover the identity of the actual owners. See: Sadek, “‘Delaware Is Everywhere’: How a Little-Known Tax Haven Made the Rules for Corporate America,” June 27, 2022, https://www.icij.org/inside-icij/2022/06/delaware-is-everywhere-how-a-little-known-tax-haven-made-the-rules-for-corporate-america/.
[6] Our request to BPE Partners for the shareholding structure of the BIG Investment Group was denied citing confidentiality of the investors.
[7] For example, at the end of December 2021, Norway’s SWF and the Vanguard Group owned 0.86% and 8.06% of BlackRock respectively. If we were to apply the UBO to Blackrock, their holdings of the case study land would have increased by only 0.01% and 0.1% respectively, which was not considered a significant increase for the purposes of this study.
[8] It is important to note here that the case study land is land that has already been planned and subdivided before it was sold or assigned to developers listed on the EGX, which we will call development land. While all vacant undeveloped desert land, which we can call ‘raw’ land, is mostly state owned in Egypt, before it is assigned to the government’s master developer, the New Urban Communities Authority (NUCA), which it then sells on plots of to developers. Given the GoE’s vast SOE network, in addition to raw land, it also owns significant areas of ‘development’ land through a host of agencies and their companies that are outside of this case study because they are not listed on the EGX.