- Published on 10 January 2024
In our third issue of this Built Environment Observatory fact sheet, we analyse statistics on Egypt’s residential construction up to the latest available year, 2021/2022. The analysis presents the activities of three main sectors: The Informal Private Sector; The Formal Private Sector, and the Public Sector.

More than a million homes built
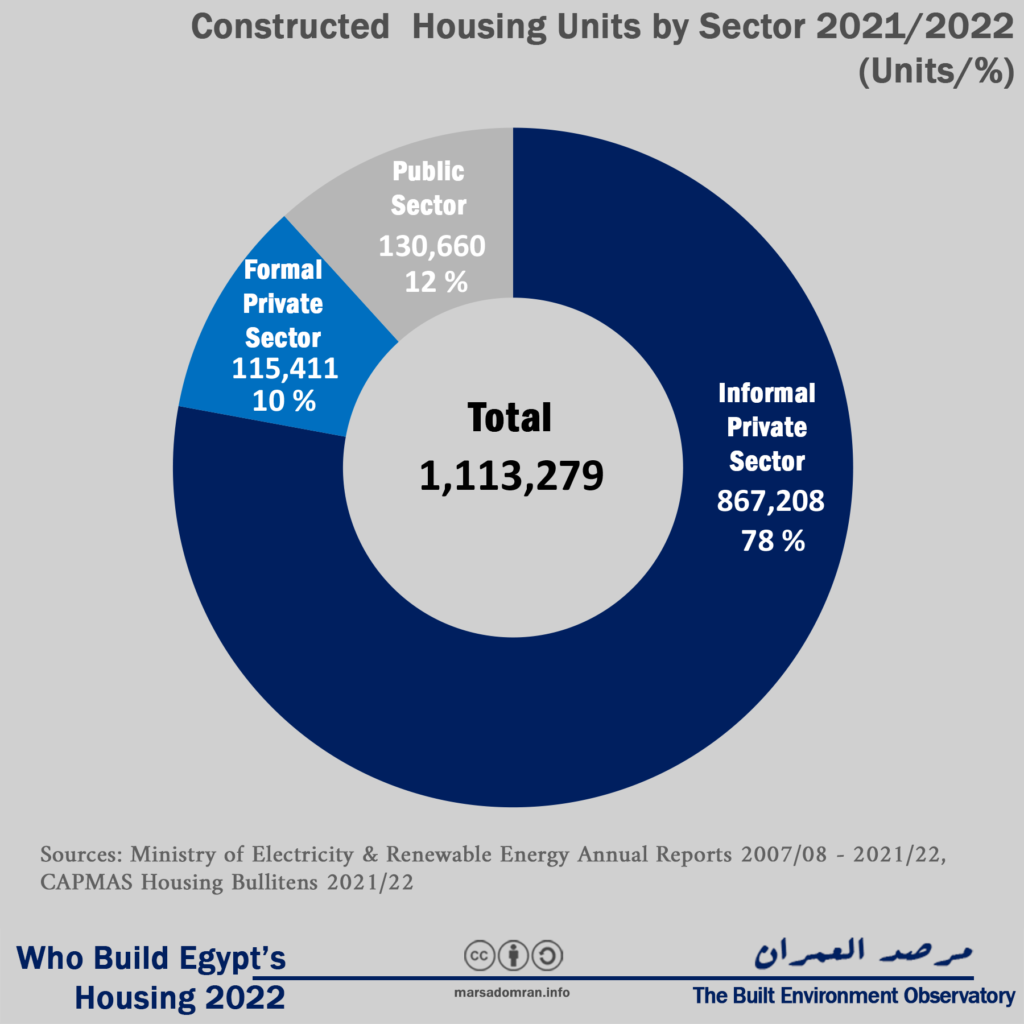
Approximately 1,113,279 housing units were built in Egypt last year (2021/2022, Figure 1, Appendix 1). Three major producers were involved: The informal private sector was the largest producer by far, building 867,208 units or a staggering 78% of all units produced last year. These homes were built by both individuals as well as contractors, without a building permit on either agricultural land, squatted desert land, and formal sub-divisions. In second place was the public sector building 130,660 units, or 12% of the total. These state-owned enterprises (SOEs) built both subsidised social housing, as well as a growing range of for-profit housing and real estate developments. Egypt’s smallest housing producer was the formal private sector who produced 115,441 units, comprising only 10% of total housing production. The formal private sector is comprised of mostly small to large-scale property developers, and decreasingly individuals, that apply for building permits to build on government-sanctioned subdivisions.
Figure 1: Housing production by sector in 2021/22 (Units/%)
Informal housing resurgence
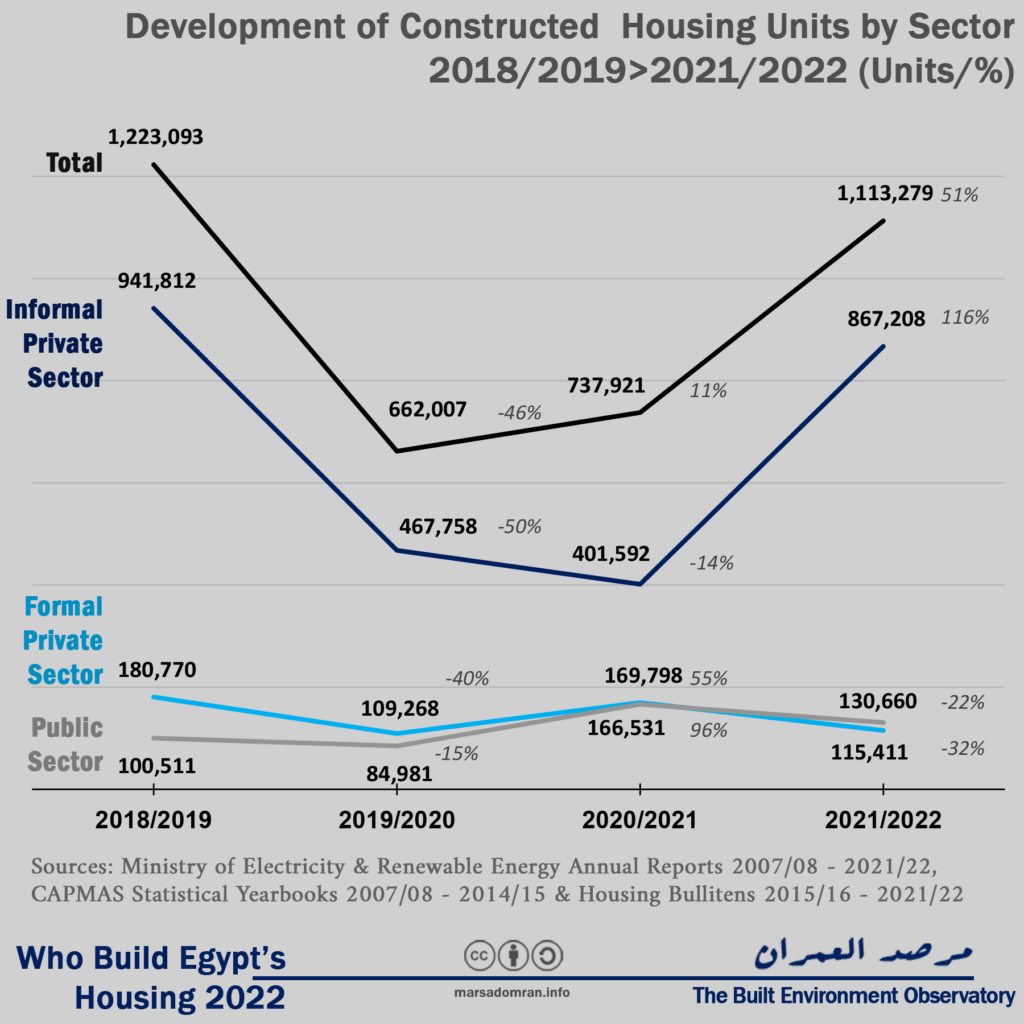
In 2021/2022, overall housing production jumped by a massive 51% over last year’s, however still short production four years earlier (Figure 2). The jump was solely due to the informal private sector, which saw an almost doubling production, rising 116% over the previous year. This may mean that the government has returned to tolerating informal housing production after large-scale crackdowns over the previous two years,[1] particularly with the passing of the reconciliation law and the curfew imposed during the COVID-19 pandemic.[2] However, we have to stress that these figures do not necessarily show actual housing production during this particular period, as they are based on electricity subscriptions, and therefore may represent informal housing produced in previous years that was only allowed formal electricity during a particular year (See Methodology).
On the other hand, formal housing production dropped, with the formal private sector dropping by around one third, and for the first time in four years, dropping below public sector production. Here the public sector saw a decline of one fifth of production, though remaining higher than two and three years prior. These drops may be partially explained by rising production and borrowing costs due to inflation and interest rate rises in the wake of the Russia-Ukraine War.[3] However, this only started to show nearer the end of the third quarter of the financial year, which means there may be other factors.
Figure 2: Housing production by sector over the last four years (Units,%)
Waning of formal private sector
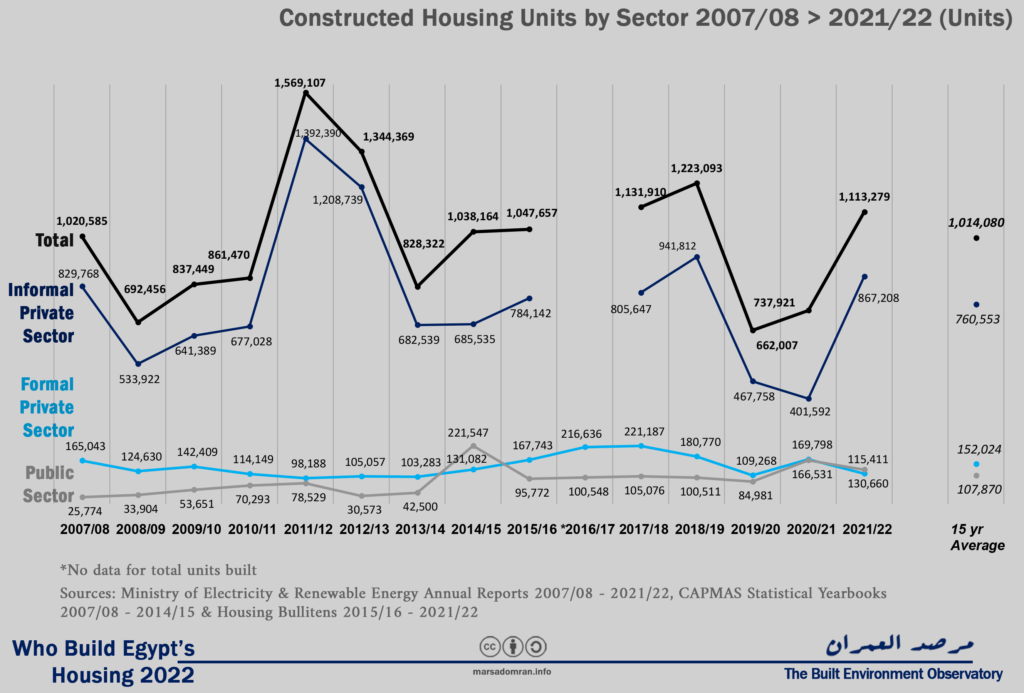
Looking at long term data, we can see two main developments in 2021/22. The first is how private informal sector production has regained its long-term position, producing just over its 10 year average of one million units a year (Figure 3, for analyses of older trends see previous editions of Who Build Egypt’s Housing). On the other hand, for the only the second time in 15 years, the formal private sector produced less units than the public sector,[4] meaning that the government is now the second largest housing producer in Egypt, and the leading producer of formal housing units. At 115,411 units, the formal private sector produced homes as a rate far below its 10-year annual average of 150,000 units a year, continuing a downward trend after it peaked at 221,000 units in 2017/18. Even though the public sector’s 130,000 units were less than last year, it still produced one third more housing than its ten year average, and may signal a long-term upward trend.
Figure 3: Housing production by sector 2007/08 – 2021-22 (Units)
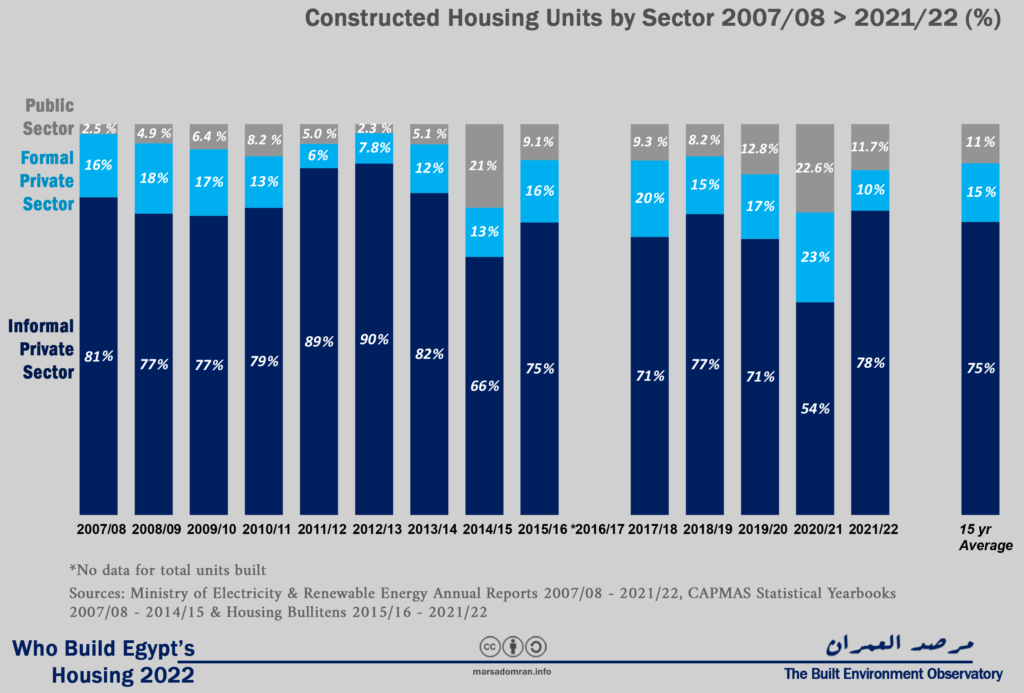
In terms of production share, the informal private sector was again higher than its 10-year average of 75% at 78%, which is also its highest share since 2013/14 (Figure 4). At a distant second was the public sector, with an almost 12% share of housing production, just higher than its 10-year average of 11%. In third place came the formal private sector at merely 10% of housing production, which is one third below its 10-year average and the lowest it’s been in ten years.
Figure 4: Long-term production share by housing producer 2007/08 – 2021/22 (%)
For-profit public sector housing significant
Nine years ago, public sector housing was overwhelmingly nonprofit, where 96% was for the Social Housing Project in addition to cooperative housing, slum replacement housing, and other smaller projects (Figure 5, See Appendix 3). However, government-built for-profit housing has since risen significantly to one quarter of its housing in 2021/22, averaging 19% over the last nine years. Tens of state-owned enterprises (SOEs) that develop real estate and sell it at market prices,[5] though it is the New Urban Communities Authority (NUCA) that has produced the lion’s share of this type of housing. Its Sakan Masr, Dar Masr, Janna and luxury housing projects are aimed at middle to upper-middle income buyers. While its developments through real estate companies such as City Edge, Saudi Egyptian Developers, and Hyde Park, target the upper end of the market.
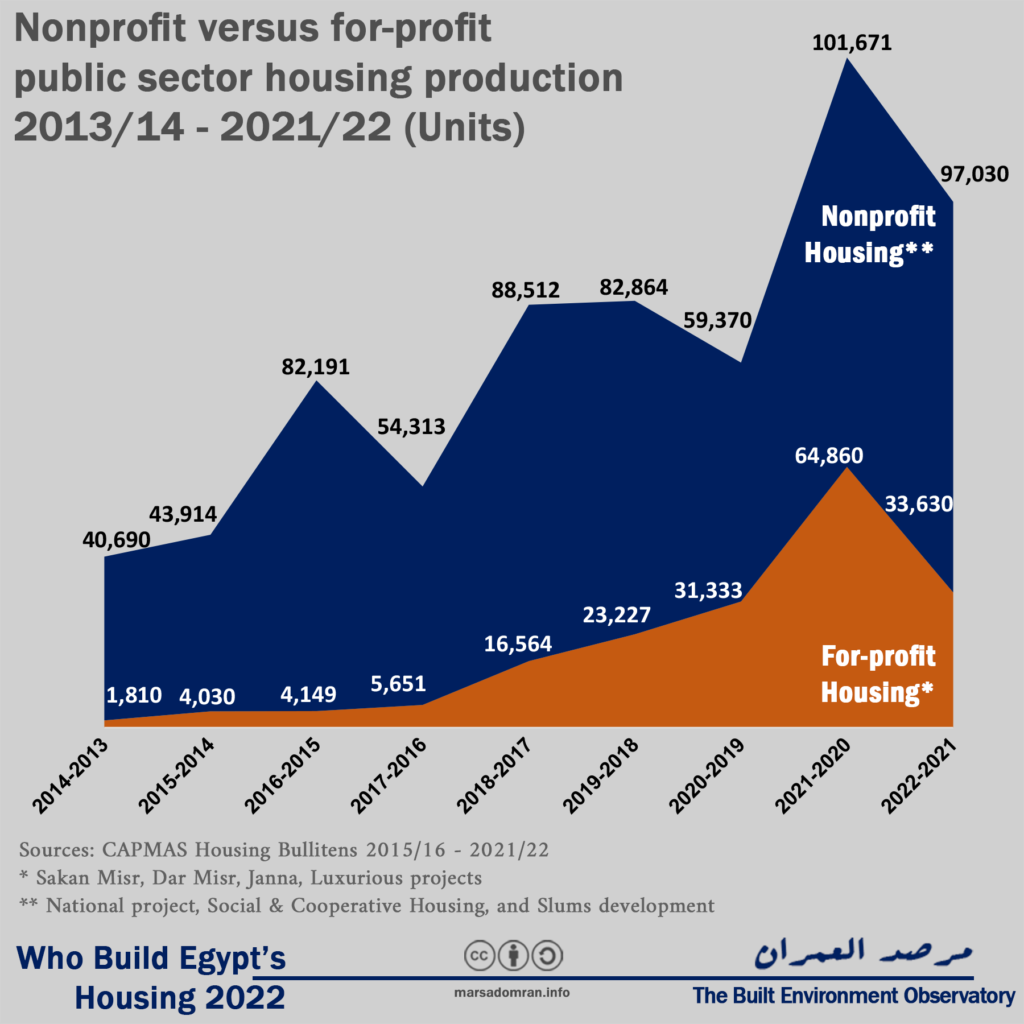
Figure 5: Non-profit versus for-profit share of public sector housing production 2013/14 – 2021/22 (%)
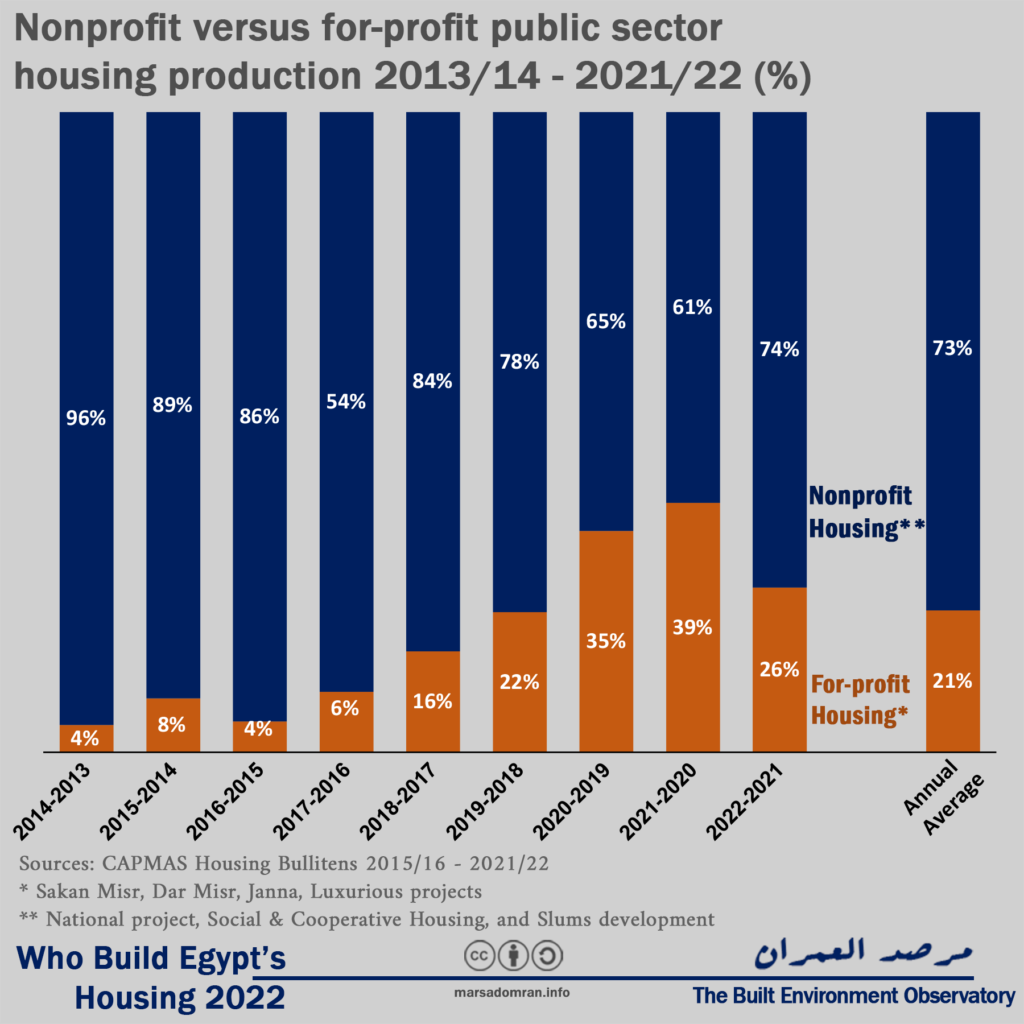
Figure 6: Non-profit versus for-profit share of public sector housing production 2013/14 – 2021/22 (units)
Conclusions and Observations
The Government of Egypt has taken a number of steps to decrease the amount of informal housing being built. In 2019 it passed the Construction Violations Reconciliation Law in order to formalise homes built without a construction permit up to 2017, as long as they fulfilled certain conditions, while banning the formalisation of homes built after that date.[6] One year later, during the lockdown because of the COVID-19 pandemic, the government passed decrees to freeze construction in major cities anticipating that contractors would exploit the shutting down of local-government offices, and build without permits.[7] While these measures had a noticeable effect in 2019/20 and 2020/21, shrinking the production of the informal private sector, according to the data, the sector experienced a strong resurgence in 2021/22. On the one hand, a large portion of these figures are simply existing informally-built homes that w ere given formal electricity meters in lieu of mumarsa, flat rates that owners who have informally hooked up to the electricity grids, pay to the electricity company based on an agreement with them. These ‘coded’ meters are so named because they only have a serial number and do not have a full contract with the owner’s name in order to not give them legal tenure, in the case the government decides to later demolish the building. However, as only an extremely limited number of applications for formalisation were accepted, government and parliament decided to amend the law in order to include a larger number of applicants.[8] Taking almost two years to amend the reconciliation law, owners and contractors also possibly expected the amendments would include newly built informal homes that were built since 2017, and thus built more housing in anticipation of a new chance to formalise as with older formalisation laws that go back to the 1950s.[9] This proved true with the new reconciliation law passed by parliament in November 2023, which set a cut-off date for informal construction of October 15th, 2023.[10]
On the formal construction side, government-built housing became the prime formal housing producer, overtaking the formal private sector which has been on a downward trend over the last five years. This situation may be due to two reasons that can be seen in the data. The first, is that with rising inflation, the devaluation of the Egyptian Pound, and in the absence of pension schemes, middle and upper middle income need to put their savings, especially expats working abroad, into assets. This has traditionally been real estate, promoted as a ‘safe haven’ by many experts and officials.[11] For profit government housing has captured a larger portion of these savings compared to previous years, and to a lesser extent, the formal private sector. This has been due to to housing policy that has worked to discourage individuals and small private developers from construction, with the over-regulation of the formal private sector in the inner-cities, and the scrapping of the Social Housing Plots schemes in the new desert towns, where the New Urban Communities Authority (NUCA) has been preferring big developers, especially those that pay in US Dollars.
With formal government and private sector housing becoming increasingly unaffordable, and requiring repayment schemes that do not suit most Egyptians’ seasonal rather than regular, income, along with rising poverty rates, most people seeking a home have been driven to build informally or but informally built homes, both to circumvent tighter regulations, as well as to access housing that is affordable to them, leading to a surge in demand and the informal private sector regaining an unprecedented lead as the housing provider in Egypt.
Appendix 1: Methodology
Formal Private Sector and Public Sector
Housing statistics for the formal private sector and the public sector are collected on an annual basis by the government’s Central Agency for Public Mobilization and Statistics, collecting unit numbers from building permits issued by the local councils and the New Urban Communities Authority (responsible for new satellite cities), as well as housing built by state-owned enterprises (SOEs) from the ministry of housing. This information is collected on an annual (financial year) basis and has been published in a dedicated report from 2015,[12] while prior to that it was part of a larger statistical report published since the 1960s.[13]
Informal Private Sector
To date, there is no regularly collected data on the informal private sector. The Ministry of Housing’s Organisation of Technical Oversight on Buildings (OTOB), has stated that there are almost three million informal buildings in Egypt constructed since the year 2000.[14] But this does not tell us how many units are in them, which could be millions as each building would have between three to four units, while it is not disaggregated by year. The information is also based on police reports of building violations, which may include more than one violation per building, or ones that have been corrected or demolished, and therefore not informal anymore.
Thus, only methods based on inference from other data are the only ones available to estimate housing production by the informal sector. The residual method has been used to calculate production every ten years, by isolating the net newly added housing units between each census, and subtracting formally produced units based on the aforementioned data.[15] While somewhat accurate, it is only available every ten years.
Another method that we first used for the Built Environment Deprivation Index’s Secure Tenure indicator, is based on using the Ministry of Electricity and Renewable Energy’s annual reports which state the total number of residential subscribers.[16] By deducting the annual increase in subscribers, we are able to infer the net annual additions of new homes, which is much higher than the number of formally produced housing stated in the CAPMAS reports. Therefore, by subtracting the formally enumerated housing units from this total, the remaining figure is an estimate of informally built units.
Limitations
For the formal private sector, the data is based on building permits representing possible construction starts and not actual construction. Different projects would be completed in different timelines, where the fastest would be completed in one to two years, and others may take more time to complete. In other cases, construction might not start at all. Therefore, this is only an estimate, and of possible future provision, and not actual production during the year.
For the informal private sector, the data is based on the addition of metered subscribers. Informally built units usually have a mumarsa (stolen electricity connection),[17] which is not metered, and do not show in the data as individual subscribers. Since the 1990s, the government has allowed the state-owned electricity companies to accept informal housing in batches, where owners apply. In the latest batch, between July 2020 and July 2021 when the ministry finally stopped taking in new applications, owners applied for 2.1 million units to change over from mumarsa to coded meters.[18] Between then and May 2022, 980,000 meters were connected,[19] a little less than half the applicants, where a large number are still to be connected, while others may be denied a connection if they fail to demonstrate certain criteria. While this data is a representation of actual units, it is not a reflection of annual production as connections happen for units constructed some years prior.
Appendix 2: Housing production figures by sector 2006/2007 – 2020/2021 (Units)
| Informal Private Sector | Formal Private Sector | Public Sector | Total | Year |
| NA | 142,482 | 16,567 | NA | 2006/07 |
| 829,768 | 165,043 | 25,774 | 1,020,585 | 2007/08 |
| 533,922 | 124,630 | 33,904 | 692,456 | 2008/09 |
| 641,389 | 142,409 | 53,651 | 837,449 | 2009/10 |
| 677,028 | 114,149 | 70,293 | 861,470 | 2010/11 |
| 1,392,390 | 98,188 | 78,529 | 1,569,107 | 2011/12 |
| 1,208,739 | 105,057 | 30,573 | 1,344,369 | 2012/13 |
| 682,539 | 103,283 | 42,500 | 828,322 | 2013/14 |
| 685,535 | 131,082 | 221,547 | 1,038,164 | 2014/15 |
| 784,142 | 167,743 | 95,772 | 1,047,657 | 2015/16 |
| NA | 216,636 | 100,548 | NA | 2016/17* |
| 805,647 | 221,187 | 105,076 | 1,131,910 | 2017/18 |
| 941,812 | 180,770 | 100,511 | 1,223,093 | 2018/19 |
| 467,758 | 109,268 | 84,981 | 662,007 | 2019/20 |
| 401,592 | 169,798 | 166,531 | 737,921 | 2020/21 |
| 818,906 | 150,301 | 102,657 | 1,064,728 | Average Last 10 Years |
| *Data was not available to accurately calculate total production Sources: See Methodology |
||||
Appendix 3: Public sector housing production by type 2013/14 – 2021/22
Source: Central Agency for Public Mobilization and Statistics, “Bulletin of Housing in Egypt”, 2015/2016 – 2021/2022
|
Year |
For-profit
Housing* |
Non-profit Housing** | Total |
| Total | 185,254 | 650,555 | 835,809 |
| 2013-2014 | 1,810 | 40,690 | 42,500 |
| 2014-2015 | 4,030 | 43,914 | 47,944 |
| 2015-2016 | 4,149 | 82,191 | 86,340 |
| 2016-2017 | 5,651 | 54,313 | 59,964 |
| 2017-2018 | 16,564 | 88,512 | 105,076 |
| 2018-2019 | 23,227 | 82,864 | 106,091 |
| 2019-2020 | 31,333 | 59,370 | 90,703 |
| 2020-2021 | 64,860 | 101,671 | 166,531 |
| 2021-2022 | 33,630 | 97,030 | 130,660 |
* For-profit housing: New Urban Communities Authority (Sakan Misr, Dar Misr, Janna, New Administrative Capital, New Alamein, New Mansoura projects), Housing and Reconstruction Companies, Executive Agency of Joint Projects, Housing and Development Bank, and the Housing Finance Fund.
** Nonprofit housing: Social Housing/Million Units/Housing for All Egyptians Project (Central Agency for Reconstruction, Governorate housing directorates, New Urban Communities Authority) Cooperative housing (Construction and Housing Cooperatives Authority), and slum replacement housing (Urban Development Fund, former Informal Settlements Development Facility).
Acknowledgements
Written by: Yahia Shawkat and Dina Elmazzahi
Main Image: Basateen, Cairo. BEO.
Notes & References
[1] Ahram Online, ‘Egypt’s Sisi Says Will Deploy Army to Remove Illegal Buildings Built on Agricultural Land If Problem Persists – Politics – Egypt’, 29 August 2020.
[2] Built Environment Observatory, ‘New Zoning and Building Regulations, and Construction Freeze – Development Brief’, 29 April 2021.
[3] Doaa A. Moniem, ‘The Central Bank of Egypt Raises Key Interest Rates by 2% to Counter Russia-Ukraine War Repercussions – Economy – Business’, Ahram Online, 19 May 2022.
[4] The only other year the government produced more housing than the formal private sector was in 2014/15. However, this is increasingly looking as an anomaly given the significantly higher number of units produced that year compared to the preceding and following years, as well as being the highest ever number in 15 years, and four times the ten-year average. Further investigation of this figure is needed.
[5] Yahia Shawkat and Dina Elmazzahi, ‘Estimating the Size of Public Sector Real Estate in Egypt’, 18 April 2023.
[6] Built Environment Observatory, ‘Egypt’s Construction Violations Reconciliation Law: All You Need to Know’, 16 January 2020.
[7] Built Environment Observatory, ‘New Zoning and Building Regulations, and Construction Freeze – Development Brief’.
[8] Al-Mal, ‘Only 38,000 applications accepted out of 2.8 million (Arabic)’, Al-Mal, 16 May 2022.
[9] Yahia Shawkat, ‘Sixty Years of Legalizing Informal Buildings in Egypt 1956-2019’, Built Environment Observatory, 10 October 2019.
[10] ‘The full text of the construction violations reconciliation law after parliament passed it (Arabic)’, Al-Youm al-Sabe’, 20 November 2023.
[11] Sada al-Balad, ‘New Administrative Capital Company: Real estate in Egypt is still safe haven for investments (Arabic)’, Sada al-Balad, 5 December 2023; Al-Mal, ‘Ministry of housing: NUCA’s budget rose to LE144 Bn (Arabic)’, Al-Mal, 4 October 2022.
[12] Central Agency for Public Mobilization and Statistics, “Bulletin of Housing in Egypt”, 2015/2016 – 2021/2022
[13] Central Agency for Public Mobilization and Statistics, “Statistical Yearbook – Housing”, 2008 – 2015.
[14] Al-Akhbar, ‘Housing inspection: 2 Million and 900 Thousand illegal properties in Egypt (Arabic)’, 26 February 2018.
[15] See for example: Yahia Shawkat, Egypt’s Housing Crisis: The Shaping of Urban Space (Cairo: American University in Cairo Press, 2020); David Sims, Understanding Cairo: The Logic of a City Out of Control (Cairo: American University in Cairo Press, 2010); Stephen K. Mayo, Harry Garnett, and Mohamed Ramez, ‘Informal Housing in Egypt’ (Cambridge Mass.: Abt Associates, Dames and Moore, GOBHR, USAID, January 1982).
[16] Ministry of Electricity and Energy, ‘Egypt Electricity Holding Company Annual Report’ 2006/2007 through 2020/2021, and 2021/2022. Subscribers labelled as ‘Residential’, in addition to a weighted portion of ‘Closed/postponed’ and ‘Zero Reading’ because of their significant numbers. These statistics represent all formal electricity subscribers whether through formal contracts, or semi-formal ‘coded meters’. They do not include unmetered connections or mumarsa, as they are bundled together in ‘Others’, which may include many non-residential users.
[17] Owners of homes built without a permit cannot initially apply formal electricity connections. They must first ‘steal’ power through informal connections to the grid and then report it to the police and electricity company authorities who then record the infringement and issue a penalty based on the size of the units and its use that is paid on a monthly or bimonthly basis. Failure to pay may result in a heavier fine or jail. Owners with such agreements have been allowed to change to so-called ‘coded meters’ since 2011 if they demonstrate certain criteria, a legal connection paying standard electricity rates, though without a fully formalized contract so as not to prove tenure. For more see: Shawkat, Egypt’s Housing Crisis: The Shaping of Urban Space, chap. 2.
[18] ‘Coded Electricity Meters: Grace Period Officially Ends on Saturday and Last Chance to Apply (Arabic)’, Amwal al-Ghad, 29 July 2021.
[19] ‘980,000 Meters Connected So Far for Violators (Arabic)’, Al-Youm al-Sabe’, 28 May 2022.