- Published on 28 June 2022
In our second issue of this Built Environment Observatory fact sheet, we analyse statistics on Egypt’s residential construction up to the latest available year, 2020/2021. The analysis presents the activities of three main sectors: The Informal Private Sector; individuals and contractors that build without a permit on either agricultural land or formal sub-divisions, The Formal Private Sector, mostly small to large-scale developers that apply for permits on government-sanctioned subdivisions, and the Public Sector; state-owned enterprises (SOEs) that build subsisdised social housing, as well as a growing range for profit housing.
Click here to read the 2018 report
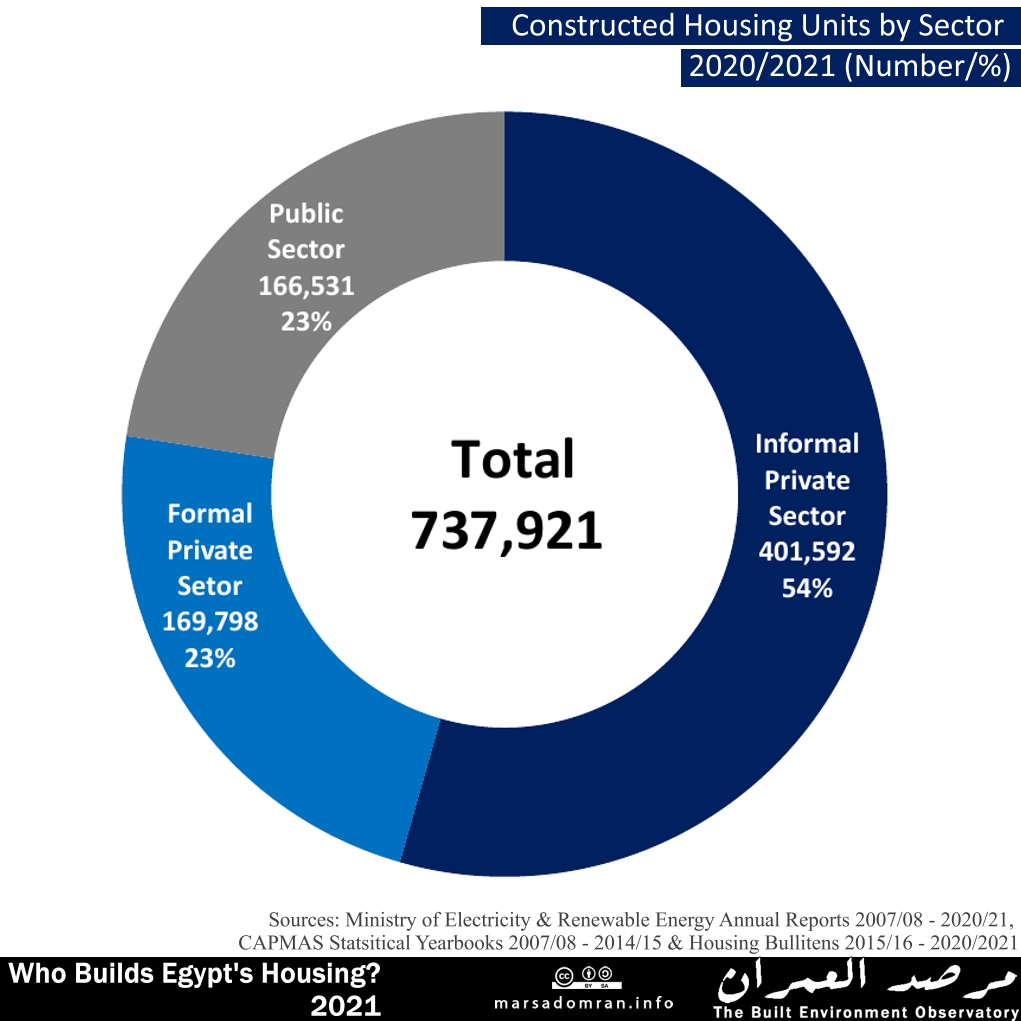
More than 700,000 Units Built
Egypt saw 738,000 units built last year (2020/2021) by its three major producers (Figure 1). The informal private sector produced 402,000 units comprising 54% of all units produced last year, leading the two other sectors by a wide margin. It was followed by the formal private sector, building 170,000 units, or 23% of the total. In close third place was the public sector with 167,000 units, also garnering 23% of total production.
Figure 1
Some Respite from COVID-19
Comparing the last three years, we find some respite this year for two sectors recovering somewhat after the coronavirus pandemic, as well as local urban and housing policy shifts (Figure 2). Overall housing took a big hit in 2019/2020 compared to the previous year, with the informal private sector taking the largest loss of around 50%. It was followed by the formal private sector that saw a massive 40% drop in production, while the public sector was the least affected, where it only produced 15% less units than the year before. These losses across the sectors can be partially explained by the nation-wide lockdown imposed in Egypt in April 2020 as a response to the coronavirus pandemic. However, losses in private sector production were mostly due to a six-month construction permit freeze imposed on major cities in March 2021,[1] in a bid to curb informal construction during the lockdown as it was thought individuals and developers would exploit authorities’ focus on the pandemic. The only exceptions were government agencies, and private construction in the ‘new cities’, desert suburbs that are more easily monitored. Further measures were taken to discourage informal construction. They included the referral of violators to the State Security Prosecution, and the imposition of a blanket construction freeze in May,[2] except by the aforementioned actors.
Figure 2
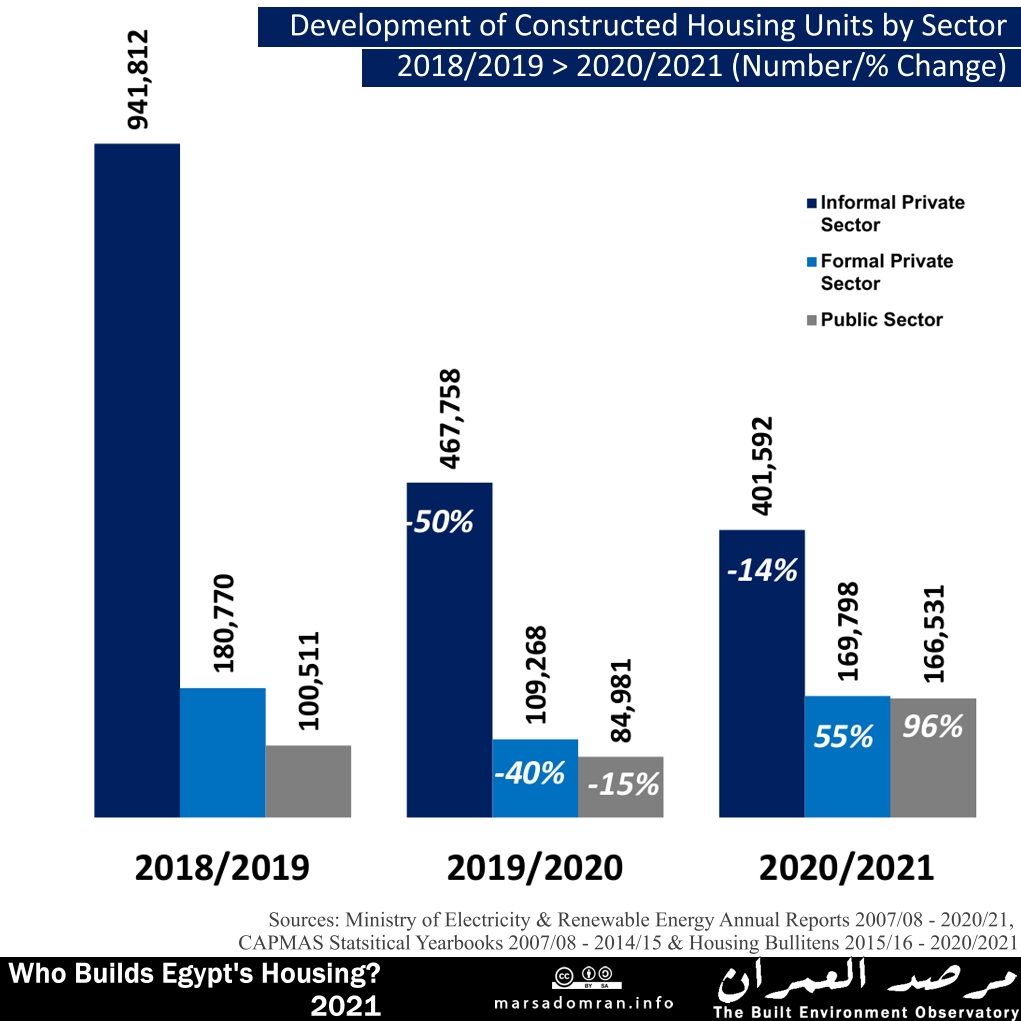
However, these measures came in the last quarter of the year, meaning their effect was rather small, and would be largely felt in the financial year after that (2020/2021). Therefore, the drop in production could also be attributed to economic slowdown preceding the coronavirus pandemic, with housing prices skyrocketing out of potential buyers’ means,[3] and the activation of the reconciliation law.[4]
For 2020/2021 we see a modest rise in production of 10.5%, though with only the two formal sectors seeing increases. The public sector saw the largest jump in production, by almost doubling the previous year’s numbers. This is a clear reflection of the government’s increased presence as a real estate developer, building social housing, as well as middle-income housing (Sakan Misr, Dar Misr), and luxury housing projects such as Janna, and in the New Administrative Capital, New Alamein and New Mansoura.
The formal private sector saw a 55% rise in production, possibly an outcome of ending the construction ban with the implementation of new zoning regulations, though it is still shy of pre-pandemic levels. The only sector to see a second year retreat was the informal private sector, though with a significantly smaller drop of 14% on the previous year.
Overall, this yearly data has its limitations (See Methodology below), and is only a reflection of estimates of production, and not actual production.
Long Term Trends Ambiguous
The data limitations mean that long term data is a better indicator of trends, though even this shows large fluctuations in housing production numbers (Figure 3). While annual production averaged one million units over the last ten years, this total fluctuated between a high of 1.5 million units in 2011/2012 – the year after the January 2011 Revolution, and a low of 660,000 units in 2019/2020, the year of the coronavirus pandemic and when urban policies markedly changed. At 740,000 units, the latest annual production figures are the second lowest during the decade and mark a modest rebound in production.
Figure 3
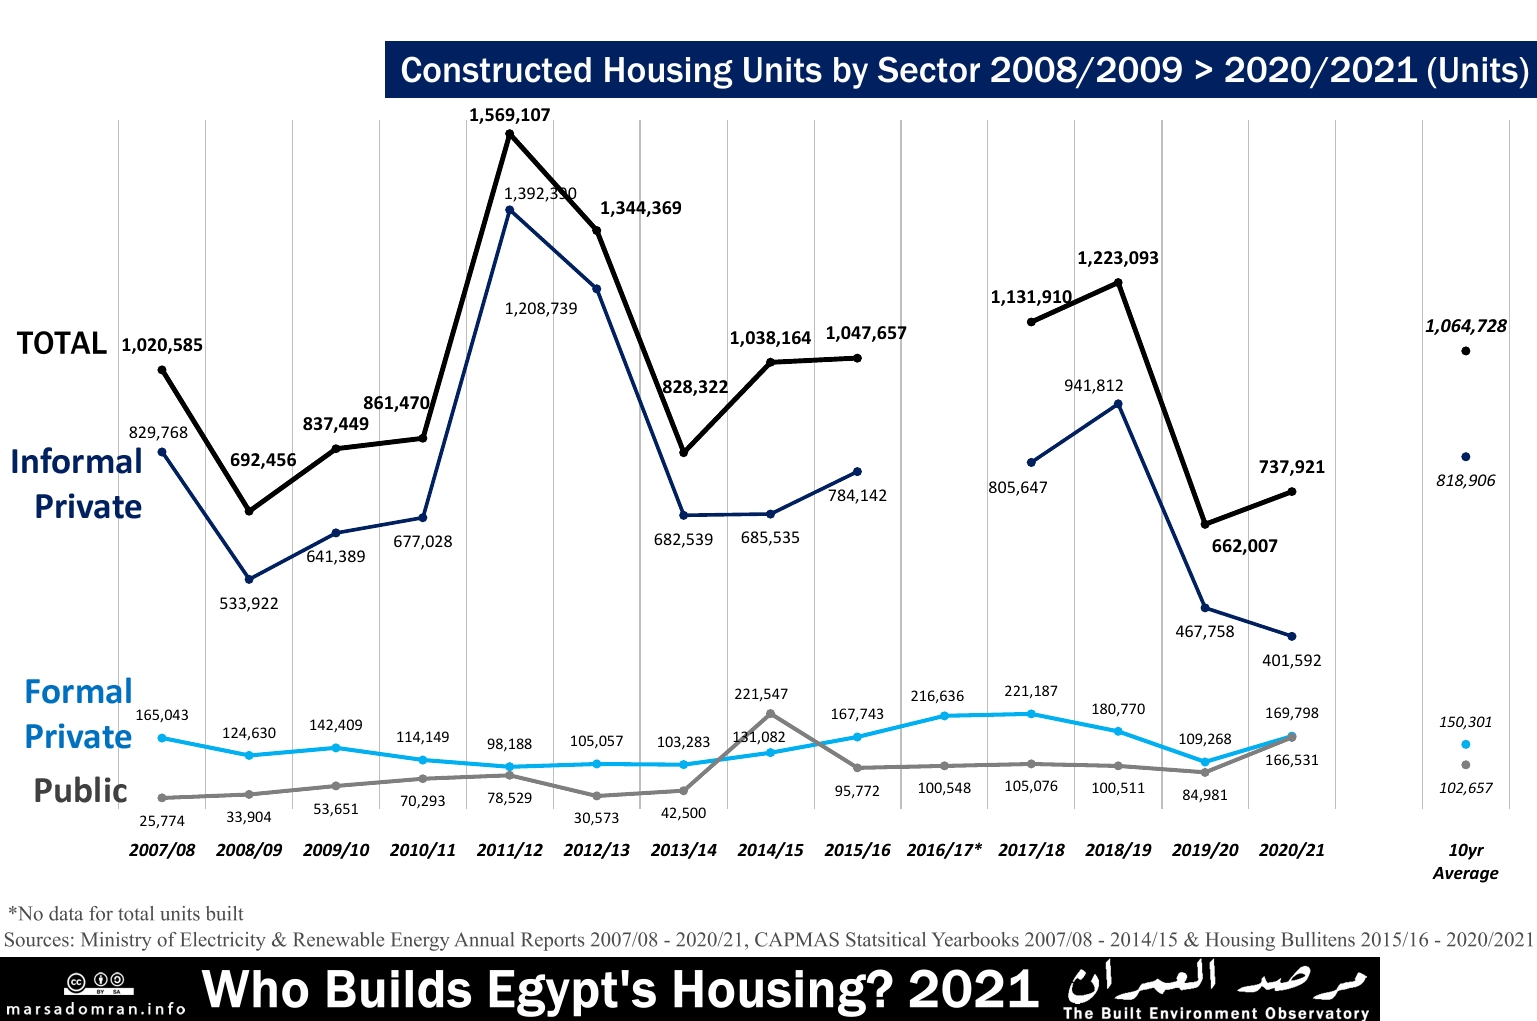
At the sector level, the public sector had the lowest, though most stable production numbers, producing an average of 100,000 units per year over the last ten years. This belies some turbulence in the first half of the decade where annual production varied widely between a low of 31,000 units in 2012/2013 and a high of 221,000 units in 2014/2015, possibly reflecting the political turmoil in the wake of the 2011 Revolution and multiple changes in government, The second half of the decade saw an almost flat production rate near 100,00 units per year, before mildly dropping and then jumping to 167,000 units last year, reflecting the larger government role in the housing and real estate sector.
In second place is the formal private sector, producing an average of 150,000 units a year over the last ten years. The sector saw widely fluctuating production numbers during that time, with a downward curve during the first half of the decade reaching a nadir of 98,000 units in 2011/2012 – just after the revolution, before slowly gaining ground by the middle of the decade reaching a peak of 221,000 units in 2017/2018. This was again followed by a downward trend bottoming out in 2019/2020, before starting to rebound last year, though still far off pre pandemic levels.
The largest producer by far ha been the informal private sector building an average of 820,000 homes a year over the last decade. It is however a largely erratic production, reaching a high of 1.4 million units in 2011/2012, just after the Revolution, and then fluctuating between 700 – 900,000 units a year during most of the decade, before seeing a downward trend over the last two years to roughly half that figure. This drop can partially be attributed to policies enacted to curb informal housing production from 2019: the reconciliation law, construction freeze, exceptional prosecution and a satellite monitoring system. However, figures for informal production are inferred from data on residential electricity subscribers and not actual production (see Methodology), making them dependent on the Ministry of Electricity and Renewable Energy’s policy to connect informal homes to official meters, where opportunities to do so are opened and closed according to political events.
Long Term Proportions May Show Trends
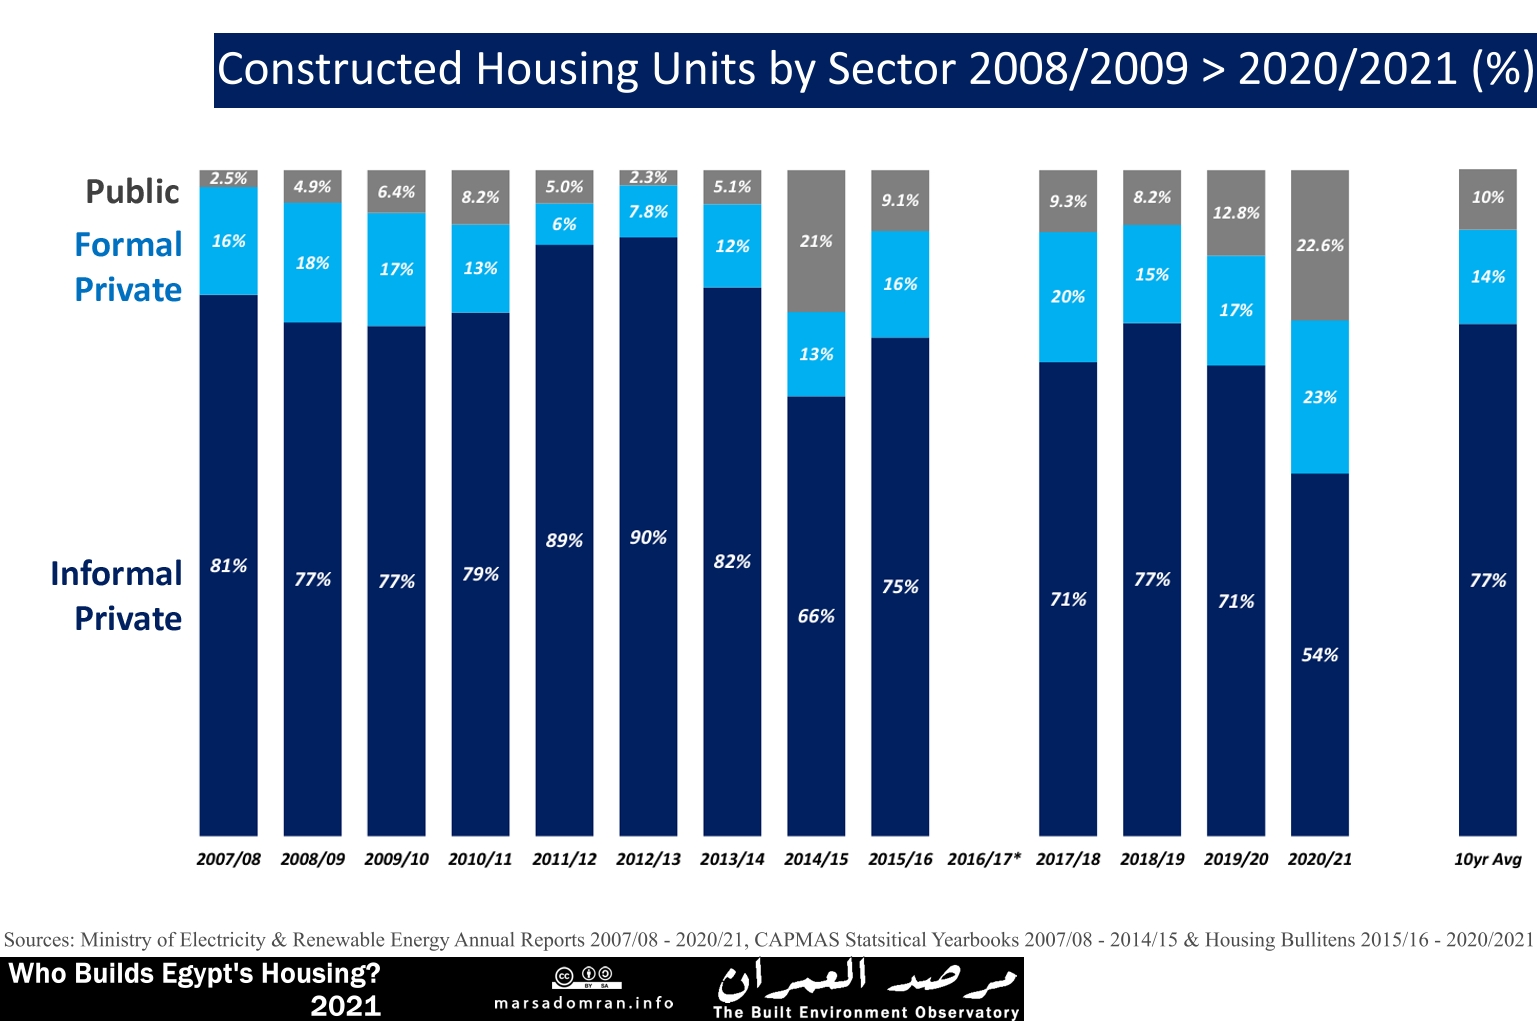
Looking at the long term development of the proportions of the three major housing producers, significant changes can be found (Figure 4). The informal private sector saw some fluctuation over most of the past decade averaging a massive 77% of production, though starting a downward trend in 2019/2020 ending with – a still large – 54% stake.
In contrast, the formal private sector fluctuated widely averaging 14% of production over the last ten years, before seeing an upward trend and setting a record 23% of production last year, the highest it has achieved in 14 years of available statistics. The public sector averaged a 10% share of housing production over the last decade, until experiencing an upward trend in the last two years that has seen it also hit a record 23% of production. It obvious though that these gains are mostly due to the retreat in production by the informal private housing sector, and not completely based on increased production.
Figure 4
Conclusions and Reccomendations
Housing production is a key sector for Egypt’s residents. Socially, it is responsible in improving the right to adequate housing, as stated in the constitution as well as the Egypt Vision 2030, the Egypt Housing Strategyu and the UN SDGs. Economically, the real estate sector offers millions of job opportunities, as well as making up 11% of GDP – the fourth largest sector. However, accurate and multi-level data on housing – numbers, geographical distribution, and more essentially, prices – is needed in order to support social and economic needs.
Recommendations
Importance of gathering data on completed construction for the formal sectors. This can easily be gathered by tallying existing Building Validity Certificate (shahadat salahiyat al-bina’) from local councils and the New Urban Communities Authority. These from part of the construction oversight process, and are only issued to buildings once they are completed and show they are fit to be used.
Importance of gathering more accurate data on the informal private sector. Existing electricity subscriber data that is collected and organized by electricity company can be rearranged by city and governorate. This would better streamline it with date on formal production.
Importance of gathering house sale and price data. A house price index would help improve data on inflation as well as targets for affordable housing. While sales data would help improve economic indicators. This data can be gathered by the Notary Public/ Real Estate Registration offices (al-shahr al-’aqari) across the country when sale deeds are registered, or powers of attorney (for sale) are made.
Importance of gathering and publishing this data at the city and governorate level on a regular basis (monthly, annually).
Appendix 1: Methodology
Formal Private Sector and Public Sector
Housing statistics for the formal private sector and the public sector are collected on an annual basis by the government’s Central Agency for Public Mobilization and Statistics, collecting unit numbers from building permits issued by the local councils and the New Urban Communities Authority (responsible for new satellite cities), as well as housing built by state-owned enterprises (SOEs) from the ministry of housing. This information is collected on an annual (financial year) basis and has been published in a dedicated report from 2015,[5] while prior to that it was part of a larger statistical report published since the 1960s.[6]
Informal Private Sector
To date, there is no regularly collected data on the informal private sector. The Ministry of Housing’s Organisation of Technical Oversight on Buildings (OTOB), has stated that there are almost three million informal buildings in Egypt constructed since the year 2000.[7] But this does not tell us how many units are in them, which could be millions as each building would have between three to four units, while it is not disaggregated by year. The information is also based on police reports of building violations, which may include more than one violation per building, or ones that have been corrected or demolished, and therefore not informal anymore.
Thus, only methods based on inference from other data are the only ones available to estimate housing production by the informal sector. The residual method has been used to calculate production every ten years, by isolating the net newly added housing units between each census, and subtracting formally produced units based on the aforementioned data.[8] While somewhat accurate, it is only available every ten years.
Another method that we first used for the Built Environment Deprivation Index’s Secure Tenure indicator, is based on using the Ministry of Electricity and Renewable Energy’s annual reports which state the total number of residential subscribers.[9] By deducting the annual increase in subscribers, we are able to infer the net annual additions of new homes, which is much higher than the number of formally produced housing stated in the CAPMAS reports. Therefore, by subtracting the formally enumerated housing units from this total, the remaining figure is an estimate of informally built units.
Limitations
For the formal private sector, the data is based on building permits representing possible construction starts and not actual construction. Different projects would be completed in different timelines, where the fastest would be completed in one to two years, and others may take more time to complete. In other cases, construction might not start at all. Therefore, this is only an estimate, and of possible future provision, and not actual production during the year.
For the informal private sector, the data is based on the addition of metered subscribers. Informally built units usually have a mumarsa (stolen electricity connection),[10] which is not metered, and do not show in the data as individual subscribers. Since the 1990s, the government has allowed the state-owned electricity companies to accept informal housing in batches, where owners apply. In the latest batch, between July 2020 and July 2021 when the ministry finally stopped taking in new applications, owners applied for 2.1 million units to change over from mumarsa to coded meters.[11] Between then and May 2022, 980,000 meters were connected,[12] a little less than half the applicants, where a large number are still to be connected, while others may be denied a connection if they fail to demonstrate certain criteria. While this data is a representation of actual units, it is not a reflection of annual production as connections happen for units constructed some years prior.
Appendix 2: Housing production figures by sector 2006/2007 – 2020/2021 (Units)
| Informal Private Sector | Formal Private Sector | Public Sector | Total | Year |
| NA | 142,482 | 16,567 | NA | 2006/07 |
| 829,768 | 165,043 | 25,774 | 1,020,585 | 2007/08 |
| 533,922 | 124,630 | 33,904 | 692,456 | 2008/09 |
| 641,389 | 142,409 | 53,651 | 837,449 | 2009/10 |
| 677,028 | 114,149 | 70,293 | 861,470 | 2010/11 |
| 1,392,390 | 98,188 | 78,529 | 1,569,107 | 2011/12 |
| 1,208,739 | 105,057 | 30,573 | 1,344,369 | 2012/13 |
| 682,539 | 103,283 | 42,500 | 828,322 | 2013/14 |
| 685,535 | 131,082 | 221,547 | 1,038,164 | 2014/15 |
| 784,142 | 167,743 | 95,772 | 1,047,657 | 2015/16 |
| NA | 216,636 | 100,548 | NA | 2016/17* |
| 805,647 | 221,187 | 105,076 | 1,131,910 | 2017/18 |
| 941,812 | 180,770 | 100,511 | 1,223,093 | 2018/19 |
| 467,758 | 109,268 | 84,981 | 662,007 | 2019/20 |
| 401,592 | 169,798 | 166,531 | 737,921 | 2020/21 |
| 818,906 | 150,301 | 102,657 | 1,064,728 | Average Last 10 Years |
| *Data was not available to accurately calculate total production Sources: See Methodology |
||||
Acknowledgements
Written by: Yahia Shawkat
Main Image: Basateen, Cairo. BEO.
Notes & References
[1] Cabinet meeting dated 19.03.2020. See: Cairo Governor Decree 2945/2020, and: Prime Ministerial Decree 941/2020.
[2] Al-Shorouk, ‘Al-Sisi yuwajih al-hukuma bi waqf “amaliyat al-bina” bi shakl kulli fi 3 muhafazat’, 21 May 2020.
[3] Khaled Al-Asmar, ‘Kibar al-mutawirin al-’aqariyin yuhadidun aliyat jadida li-tanshit souq al-’aqarat’, Al-Mal, 15 November 2019.
[4] BEO, ‘Egypt’s Construction Violations Reconciliation Law – Development Brief’, Built Environment Observatory (BEO), 16 April 2021.
[5] “Bulletin of Housing in Egypt”, 2015/2016 – 2020/2021
[6] “Statistical Yearbook – Housing”, 2008 – 2015.
[7] Al-Akhbar, ‘Taftish Al-Iskan: 2 Million Wa 900 Alf ‘aqar Mukhalef Fi Misr’, 26 February 2018.
[8] See for example: Yahia Shawkat, Egypt’s Housing Crisis: The Shaping of Urban Space (Cairo: American University in Cairo Press, 2020); David Sims, Understanding Cairo: The Logic of a City Out of Control (Cairo: American University in Cairo Press, 2010); Stephen K. Mayo, Harry Garnett, and Mohamed Ramez, ‘Informal Housing in Egypt’ (Cambridge Mass.: Abt Associates, Dames and Moore, GOBHR, USAID, January 1982).
[9] Ministry of Electricity and Energy, ‘Egypt Electricity Holding Company Annual Report’ 2006/2007 through 2020/2021. Subscribers labeled as ‘Residential’, in addition to a weighted portion of ‘Closed/postponed’ and ‘Zero Reading’ because of their significant numbers. These statistics represent all formal electricity subscribers whether through formal contracts, or semi-formal ‘coded meters’. They do not include unmetered connections or mumarsa, as they are bundled together in ‘Others’, which may include many non-residential users.
[10] Owners of homes built without a permit cannot initially apply formal electricity connections. They must first ‘steal’ power through informal connections to the grid and then report it to the police and electricity company authorities who then record the infringement and issue a penalty based on the size of the units and its use that is paid on a monthly or bimonthly basis. Failure to pay may result in a heavier fine or jail. Owners with such agreements have been allowed to change to so-called ‘coded meters’ since 2011 if they demonstrate certain criteria, a legal connection paying standard electricity rates, though without a fully formalized contract so as not to prove tenure. For more see: Shawkat, Egypt’s Housing Crisis: The Shaping of Urban Space, chap. 2.
[11] ‘Coded Electricity Meters: Grace Period Officially Ends on Saturday and Last Chance to Apply’, (Arabic), Amwal al-Ghad, 29 July 2021.
[12] ‘980,000 Meters Connected so Far for Violators’, (Arabic), Al-Youm al-Sabe’, 28 May 2022.