- Published on 12 May 2026
In the fifth issue of Who build Egypt’s Housing, we analyse housing construction statistics up to the most recent year for which data is available, FY 2023/2024. This is an analysis of the construction activities of Egypt’s three main housing-producing sectors: the informal private sector, the formal private sector, and the public sector, combining data from the Central Agency for Public Mobilization and Statistics (CAPMAS) on the two formal sectors with data from the Ministry of Electricity on the number of annual household subscriptions (See Appendix 1: Methodology)
The report is divided into three parts: Section I gives an overview of the housing sector as a whole, analysing at the annual, medium-term (five-year), and long-term (10–17-year) levels. The second part focuses on the public sector, both social and for-profit housing. In Section III, the report analyses construction trends in New Cities versus existing cities and villages, in the short and long term (up to ten years), as well as more detailed views of the public sector, social housing and formal private sector.
Executive Summary
Overview:
– Approximately 1.1 million housing units were built in Egypt in 2023/2024, a 13% decrease on the previous year.
– The informal private sector led production with a total of 1 million units, representing 86% of total units. The public sector came in second place, with 82,728 units, representing 7% of total housing, while the formal private sector came in third and last, with 76,211 units, or only 6.5% of total production.
– The decline in total production is attributed to decreases across all sectors, with a notable drop in production in the public and formal private sectors—each down by about one-third compared to the previous year—marking their lowest production levels in the last five years.
– Despite this decline, housing construction rates in Egypt have remained nearly constant over the past decade, averaging one million units annually.
– For the third consecutive year, public sector production exceeded that of the formal private sector.
– The number of housing units produced continues to exceed the number of newly registered marriages, with an average of 18% more units produced than the number of new marriages over the past five years, or about an annual surplus of approximately 185,000 units.
The Public Sector:
– Over the past ten years, public sector production reached 74,000 units annually of non-profit or subsidised housing, compared to 26,000 units of for-profit housing. The share of for-profit housing produced by state-owned enterprises (SOEs) has continued to rise, from 8% a decade ago to 28% in 2023/2024.
– Over the past ten years, for-profit housing projects have accounted for a quarter of the government’s total housing production.
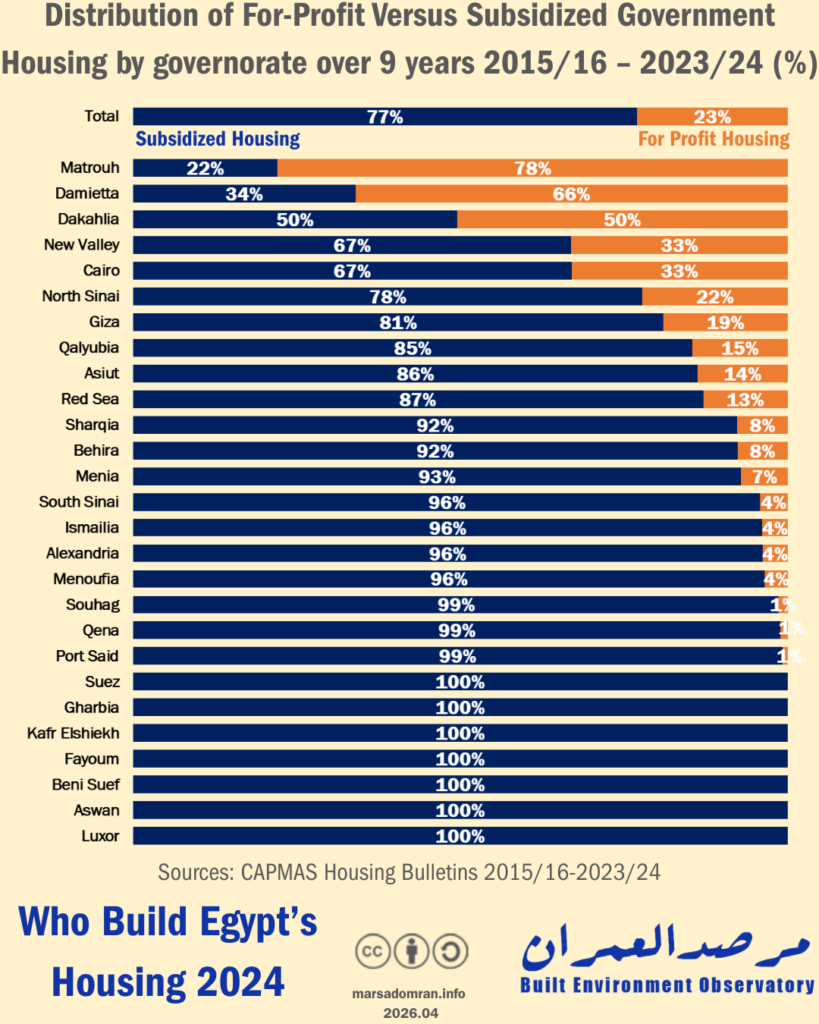
– Over the past ten years, the share of for-profit housing reached or exceeded 50% in three governorates: Dakahlia, Damietta, and Matrouh.
– During 2023/2024, the Ministry of Housing’s Urban Development Fund (UDF) constructed 1,220 units of slum-clearance rehousing through two projects: Rawdet al-Sayyida 2 in the Sayyida Zeinab neighborhood and “Shimal al-Harfiin” in the Manshiyat Nasser neighborhood in Cairo–contrasted to 614 for-profit housing units within the Fustat View project.
– During 2023/2024, non-profit, subsidized housing regained prominence in the government’s agenda, accounting for 72% of public sector production, after declining to 41% the previous year.
Comparing production in existing urban centres with New Cities:
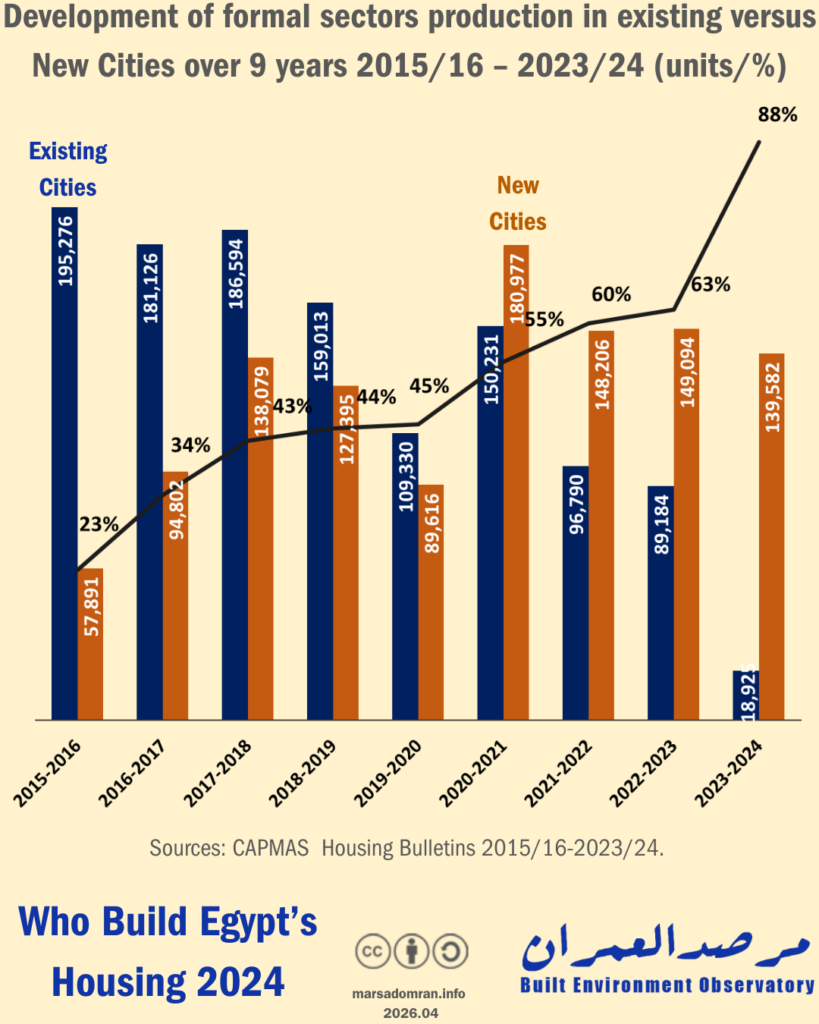
– Construction of housing units (public and private) in existing urban areas saw a sharp decline, from approximately 195,000 units in 2015/2016 to only about 19,000 units in 2023/2024.
– During 2023/2024, only 12% of formal housing sector production (public and private) was built in existing urban areas, while 88% of units were built in New Cities.
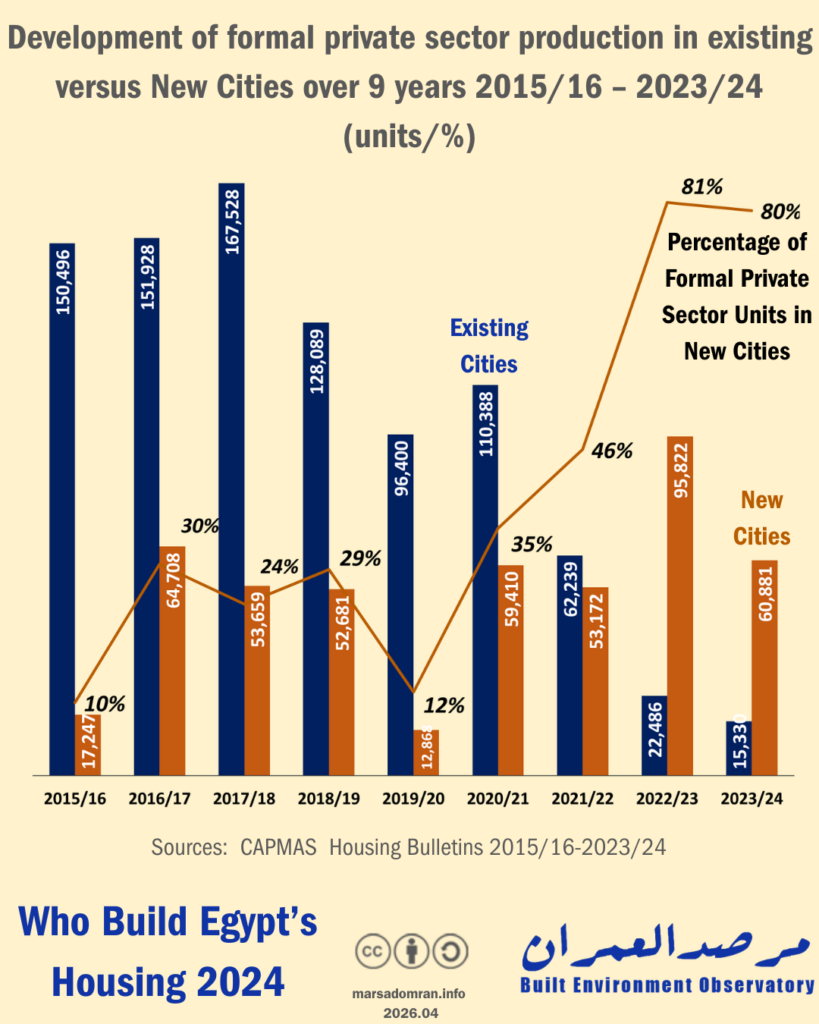
– For the second consecutive year, formal private sector production in new cities exceeded that in existing urban areas, with 60,000 units built, representing 80% of its total production during 2023/2024. Construction in the governorates of Giza, Cairo, and Alexandria was limited to new cities only, while it exceeded 50% in six other governorates. This may be explained by the continued policy of halting construction in these governorates, in accordance with presidential directives from previous years, alongside the imposition of special construction requirements since 2021.
– Of the total 140,000 units built in new cities during 2023/2024, the public sector built 78,700 of them (56%) through the New Urban Communities Authority (NUCA), compared to the formal private sector, which built 60,800 units, or 44%.
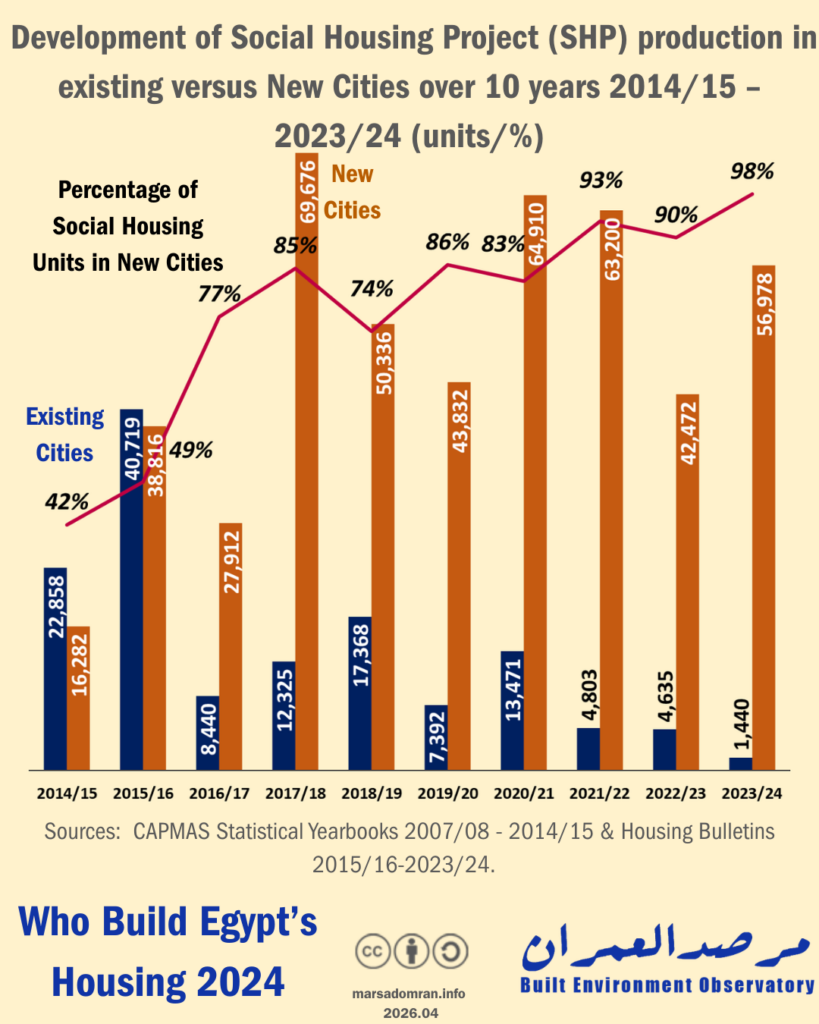
– The number of newly built social housing units in existing cities fell to its lowest point in the past decade, reaching 1,440 units in 2023/2024. In contrast, social housing production in new cities continued to grow, peaking at a 98% share of total production during the same year, through NUCA.
Part One: Overview of the Housing Sector
1.1 Million Units Built in Egypt Over the Past Year
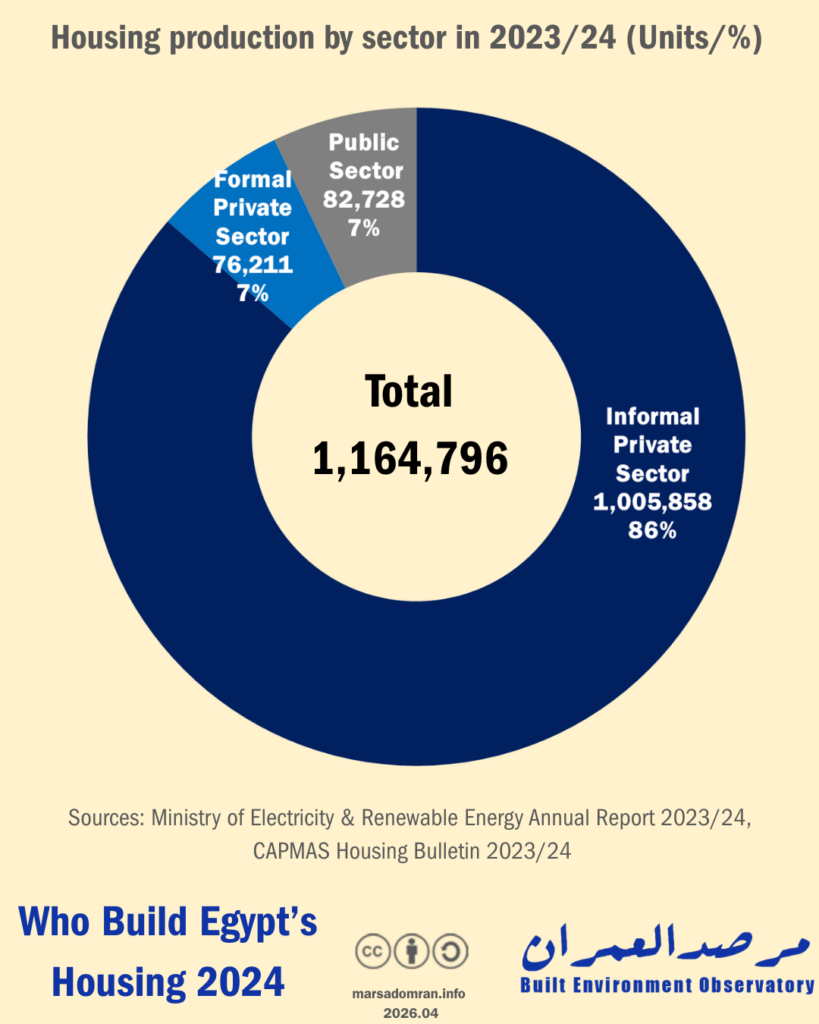
The 2023–2024 period saw the construction of approximately 1,164,796 housing units in Egypt (Figure 1, Appendix 1). As has historically been the case, the informal private sector topped the list with a total of 1 million units, representing 86% of total built units. These units were built by individuals or contractors without obtaining building permits, in addition to violations on officially planned and subdivided plots of land.
The public sector ranked second, constructing approximately 83,000 units, equivalent to 7% of the total housing stock. State-owned institutions, including housing funds, the New Urban Communities Authority (NUCA), and real estate companies, built subsidized social housing, as well as a growing number of for-profit housing projects. The formal private sector, which consists mostly of real estate development companies, ranked last with a production of approximately 76,000 units, representing only 6.5% of total housing production.
It must be emphasized that these figures do not necessarily reflect the actual volume of housing production during that specific period, but rather serve as a general indicator, since the available data is not based on actual completion of construction (certificate of occupancy). The Housing Bulletin data shows only the number of building permits issued to the formal private sector, does not confirm that the property has actually been built, and certainly does not represent construction completion during the year. Furthermore, while informal production data relies on changes in the number of electricity connections, it may represent housing units built in previous years that were only permitted to install official meters during a specific year1 (see Appendix 1: Methodology).
Figure 1: Housing production according to sector 2023/2024 (Units/%)
Medium-Term Decline in Production Across All Sectors
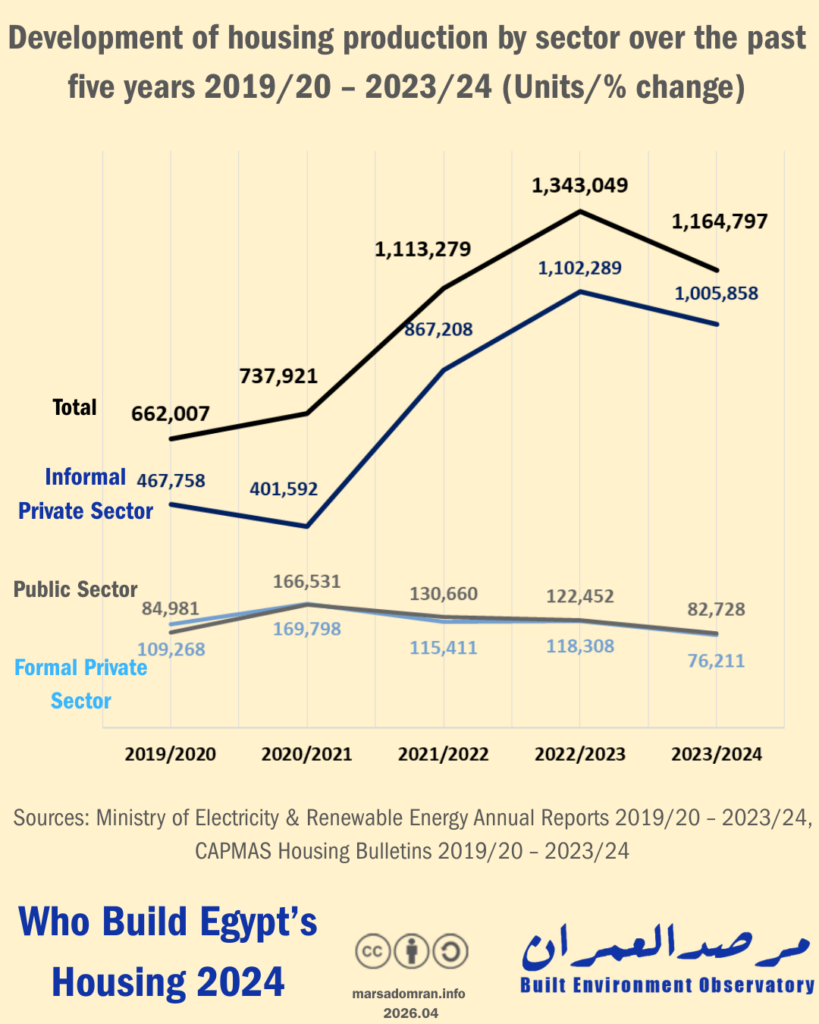
Since available data serves only as an indicator of production—not definitive proof of it—tracking it over time provides a clearer picture of the evolution of housing production in Egypt. Here, medium-term data indicate an overall decline in production of 13% during 2023–2024 compared to the previous year (Figure 2). This decline is attributed to a decrease in production across all sectors, primarily in formal housing production, as production in both the public and private formal sectors fell by about one-third each compared to the previous year. This is the lowest level of production for these sectors in the last five years, following a downward trend that began in 2020/2021, when their combined production volume was nearly double these figures.
The decline in the formal private sector can be explained by its exposure to decisions freezing construction and permits, alongside the exceptional planning requirements imposed on existing buildings between 2020 and 2021.2 These were only lifted, marking a return to the Unified Building Code, in October 20243— a period not yet covered by the available data.
As for the public sector, we note that the decline in its output is linked to the government’s implementation of austerity policies throughout the ongoing economic crisis, which manifested in the decision to rationalize investment spending for the 2023/2024 fiscal year,4 followed by the imposition of a cap on public investment spending (purchase of assets and construction), which began in the 2024/2025 fiscal year.5 Nevertheless, public sector output has remained higher than that of the formal private sector over the past three years.
As for the informal private sector, it experienced a slight decline of 9% compared to the previous year, following an upward growth trend that began two years ago and peaked last year. Despite this decline, current production remains the second-highest level recorded over the past five years, representing 2.5 times the production during this period.
Figure 2: Evolution of housing production by sector over the past five years, 2019/2020–2023/2024 (units/% change)
Despite an overall decline, housing production outpaced marriages in the medium term
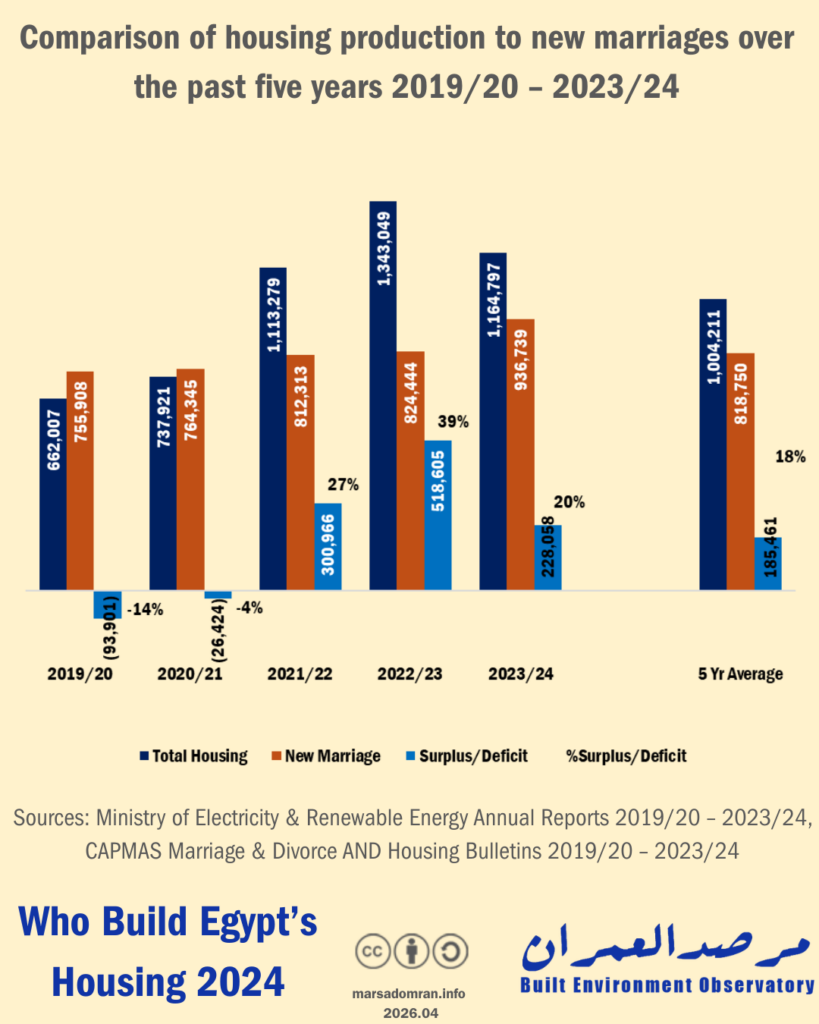
During 2023/2024, 1.16 million housing units were produced, compared to 936,000 new marriages registered, indicating a surplus of nearly a quarter of a million units—an estimated 20% increase over this index for demand. In the medium term, housing production exceeded the number of new marriages in three of the past five years, with an average annual surplus of 18%, equivalent to approximately 185,000 surplus units annually during this period (Figure 3, Appendix 9).6
In general, the annual number of marriages does not serve as a direct indicator of housing demand in the year of marriage, as the search for housing to purchase or build may begin years earlier, and an undetermined number of marriages rely on existing housing or opt to rent. Therefore, the number of marriages remains an indirect indicator of demand in the absence of large-scale periodic surveys.
Figure 3: Evolution of housing production versus the number of new marriages over the past five years, 2019/2020–2023/2024 (units/% surplus or deficit)
Housing production has remained relatively stable over the long term… but
Long-term data reveals that housing construction rates have remained relatively stable, averaging one million units annually over the past decade, despite ongoing economic turmoil triggered by capital flight during the COVID-19 pandemic and intensifying in the shadow of the Russia-Ukraine war (Figure 4, Appendix 2). We note that the high volume of production is directly linked to a single sector: the informal private sector, which produced approximately 800,000 units annually over the past ten years and rose to one million units or more in the past two years, recovering from the decline seen in 2020/2021.
In contrast, this recovery did not extend to the other two sectors– the formal private sector and the public sector. The formal private sector, which is the second-largest sector with an average annual production of 150,000 units over the past ten years, experienced a sharp decline during the most recent period, with production falling to about half of its long-term average at 76,211– its lowest production rate ever and falling significantly short of its peak of 221,000 units in 2017–2018, seven years ago.
As for the public sector, the third-largest producer of housing over the past decade with an average of 100,000 units annually, has also recorded a decline albeit at a slower pace , with production this year down 20% from the long-term average at 82,728 units.
Figure 4: Evolution of housing production by sector over 10 years, 2014/2015–2023/2024 (units)
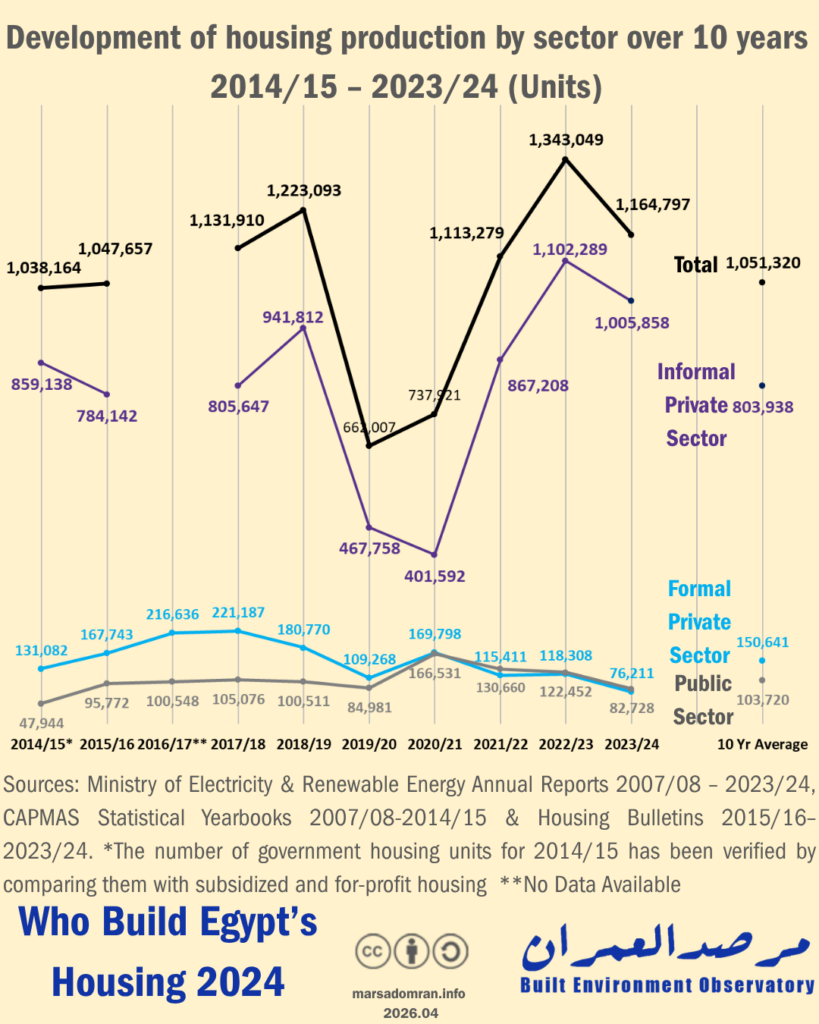
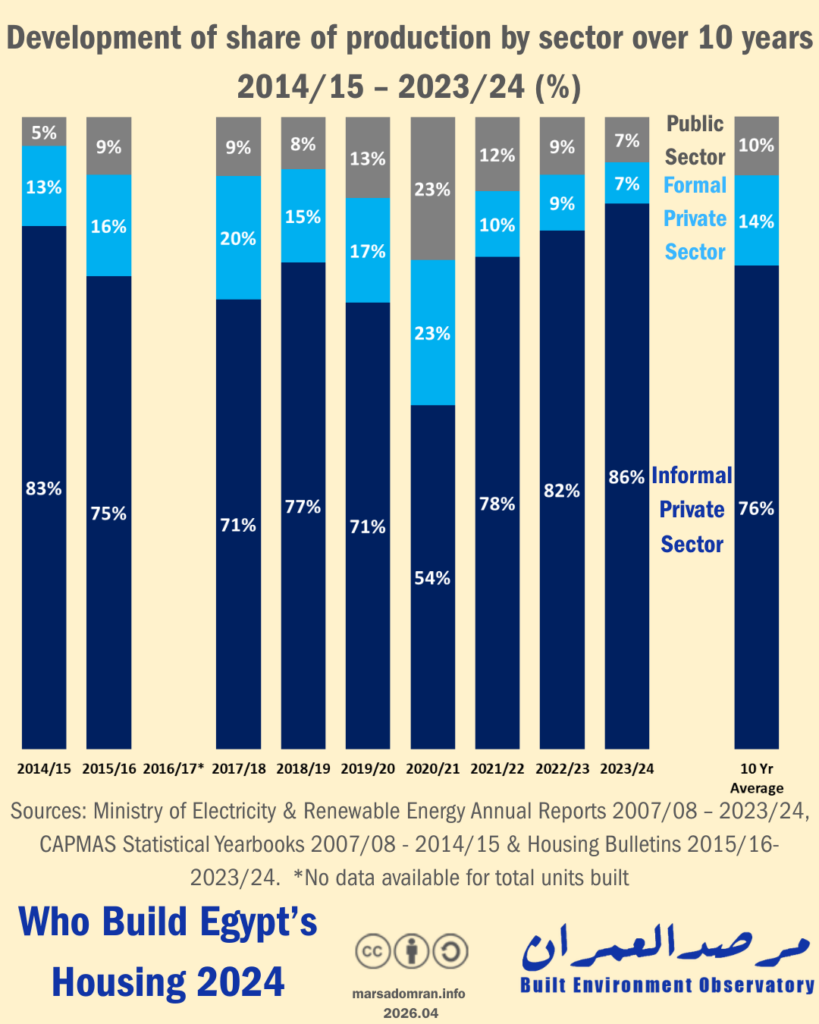
In terms of production share, output from the informal private sector rose again to 86% in 2023/2024, compared to an average of 76% over the past ten years, marking its highest share (Figure 5). The formal private sector came in second place, accounting for an average of 14% of total housing production over the past decade, however, there is a visible downward slope, with a drop of more than half this year compared to long-term average share of production.
The public sector ranked third, with a share of approximately 10% of housing production over the long term, which declined slightly during the current year to reach 7% of total housing production in Egypt.
Figure 5: Evolution of the share of production by sector over 10 years, 2014/2015–2023/2024 (%)
Part Two: A Look at the Public Sector
Public sector housing can be divided into two categories: the first consists of government-subsidised housing targeted at low-income individuals, including various social housing project, such as Housing for All Egyptians, as well as slum-clearance rehousing, and cooperative housing; the second category consists of for-profit investment housing projects such as Sakan Misr, Dar Misr, Jannah, and luxury housing in new cities. Several state-owned enterprises are responsible for a share of the annual housing production of the public sector.
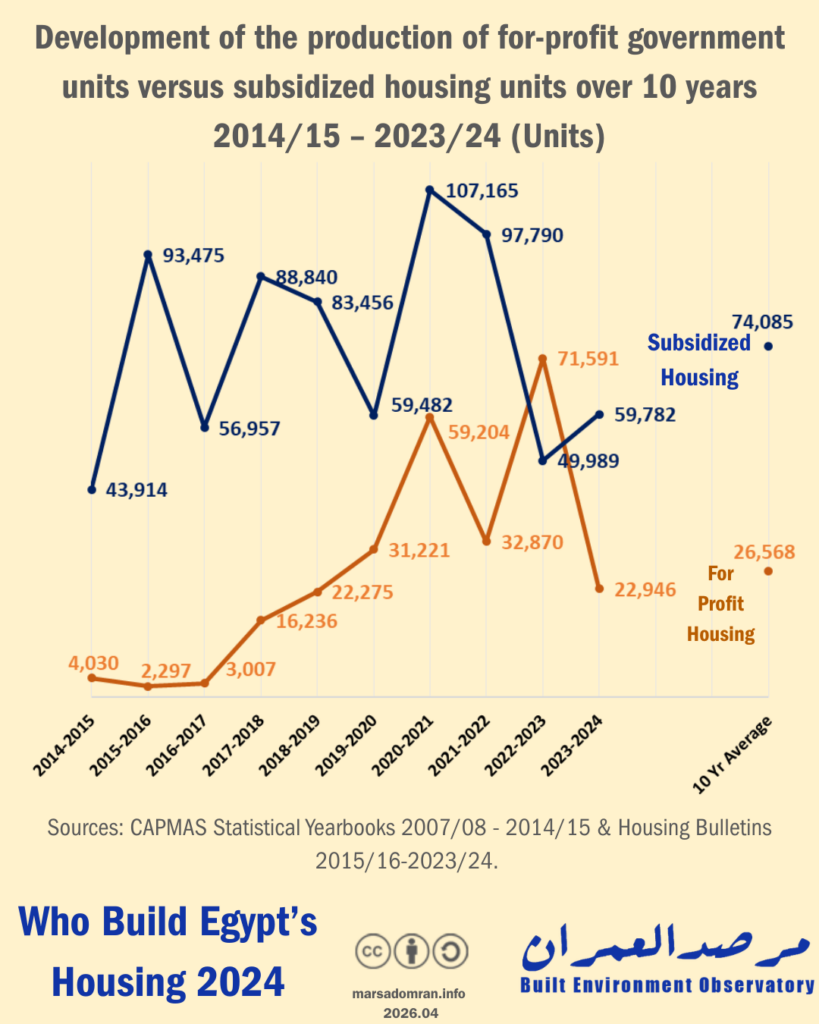
Looking at total units produced over the past decade, the public sector’s average annual production of subsidised housing units has been 74,000, compared to 26,000 units of for-profit housing (Figure 6, Appendix 3).
In 2023/2024, subsidised housing production increased in comparison to the year before, but remained at low levels compared to earlier years, and was about one-fifth below its ten-year average. In contrast, for-profit housing production declined significantly compared to the previous year, which was a record high, marking the first time it exceeded subsidised housing production.
Figure 6: Evolution of the number of for-profit government-built units versus subsidised units over 10 years, 2014/15–2023/2024 (units)
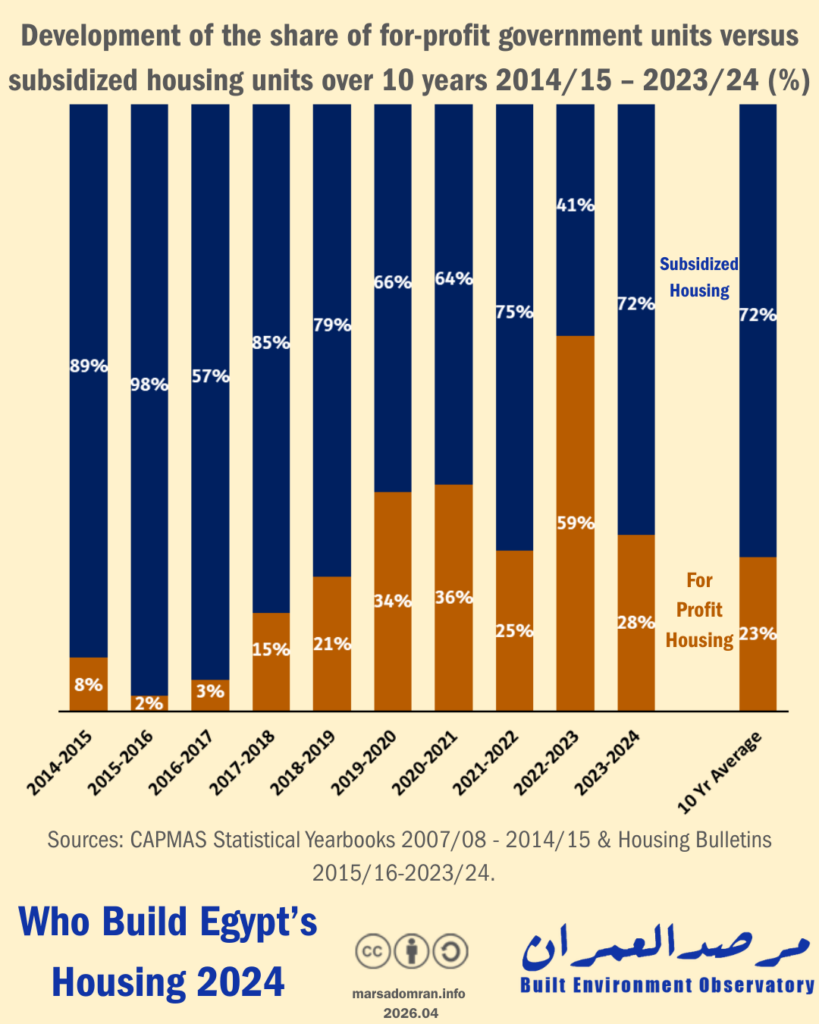
Over the past ten years for-profit housing as a share of public sector housing has gradually increased, relative to subsidised housing. Ten years ago, social housing accounted for 89% of public sector production, compared to just 8% for for-profit housing (Figure 7, see Appendix 3). In the most recent year, 2023/2024, for-profit investment housing projects accounted for 28% of total public sector production, a decline compared to the previous year when this share exceeded 50% of production. Despite this fluctuation, for-profit housing accounted for a quarter of the government’s housing production over the past ten years, signifying that it remains a major source of government housing alongside non-profit social housing.
Figure 7: Evolution of the share of for-profit government housing units versus subsidised units over 11 years, 2013/2014–2023/2024 (%)
Looking at the distribution of total public sector housing production across governorates over the past ten years, we find that for-profit housing accounted for half or more of total production in three governorates: Dakahlia, Damietta, and Matrouh. In Matrouh, particularly in New Alamein City, for-profit housing exceeded two-thirds of total production. Furthermore, more than half of government housing in Damietta Governorate—about 66%—was for-profit. Similarly, half of government housing in Dakahlia Governorate was for-profit, driven by the luxury housing project, New Mansoura.
Figure 8: Average share of government-built subsidised housing versus for-profit housing by governorate over 9 years, 2015/16–2023/2024 (%)
Subsidised Public Housing
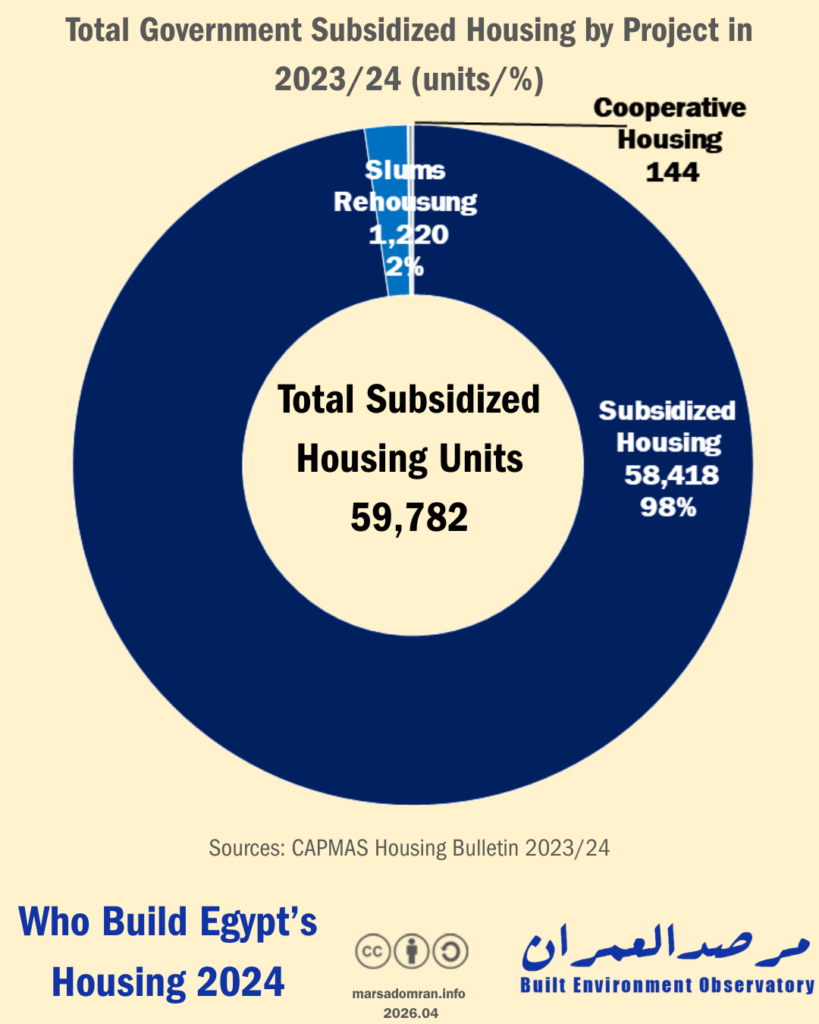
Total subsidised government housing production reached approximately 60,000 units during the 2023/2024 fiscal year (Figure 9, see Appendix 5). It comprises three major projects, foremost among them is the social housing project, Housing for All Egyptians, which accounted for about 98% of this production, equivalent to nearly 58,000 units. The project is managed by the Social Housing and Mortgage Finance Fund (SHMFF) under the Ministry of Housing, while construction is handled by multiple entities: NUCA, the Central Construction Agency, and governorate housing directorates, which then sell the units to the Fund. This explains why these entities appear in official statistics rather than the Fund itself.
In second place is slum-clearance rehousing, mainly two projects: Rawdat al-Sayyida 2 in the Sayyida Zeinab neighborhood and Shimal al-Hirafyin in the Manshiyat Nasser neighborhood in Cairo, with a total of 1,220 units representing about 2% of production during the 2023/2024 fiscal year, implemented by the Urban Development Fund (UDF) in Cairo Governorate.
Cooperative housing came in third place with 144 units. Cooperative housing sometimes benefits from government support for land prices and cooperative loans. The General Authority for Building and Housing Cooperative builds a portion of it and manages cooperative housing associations established by unions and groups of individuals. However, the role of these associations, and cooperative housing in general, has declined significantly over the past two decades7.
Figure 9: Total government subsidised housing production (non-profit) by project in 2023/2024 (Units/%)
For-profit public sector projects
Numerous SOEs operate in the fields of housing, real estate development, and for-profit housing construction,8 producing approximately 23,000 units throughout the 2023/2024 fiscal year (Figure 10, Appendix 4). Leading the way is NUCA, which accounted for 94% of production through a number of middle-income projects, such as Sakan Misr and Dar Misr, in addition to luxury housing projects, such as Jannah and Al-Tabi’ Al-Hadith, as well as other projects in the New Administrative Capital and New Mansoura, which target middle and upper-middle income buyers.9 The UDF ranked second in for-profit housing production, accounting for an average of 3% of units produced– the 614 units within the Fustat View project.
In addition to these two economic entities, other agencies are involved in building middle income and luxury for-profit housing, such as the housing and construction companies affiliated with the Holding Company for Construction and Development, including Maadi Housing and Development, Nasr Housing and Development, among others, the Joint Ventures Authority, and the Housing Finance Fund, which are affiliated with the Ministry of Housing, the Housing and Development Bank, which is listed on the stock exchange but controlled by the Ministry of Housing, and the Ministry of Housing’s Central Agency for Construction, as well as the Governorate Housing Directorates. These entities accounted for 3%, or the equivalent of only 753 units, of the government’s mid-range and luxury housing production during 2023/2024.
Figure 10: Total government for-profit housing production by project in 2023–2024 (Units/%)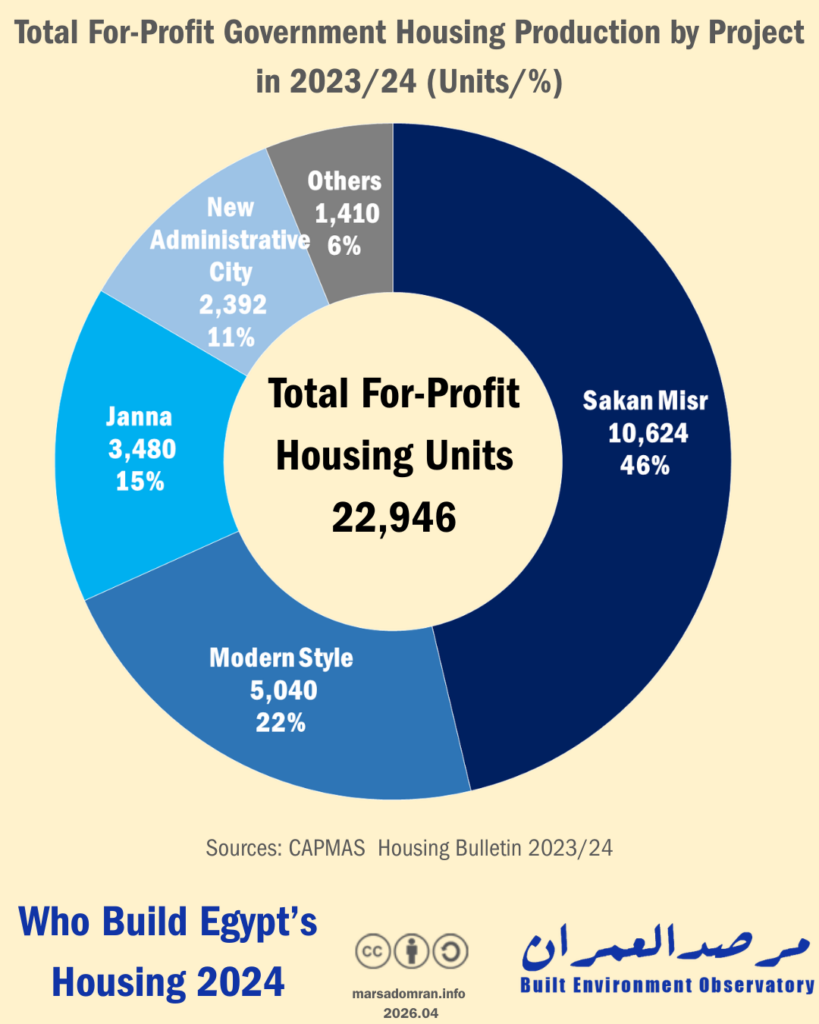
Part Three: Housing in New Cities and Existing Urban Areas
This section analyses statistics on official housing production, comparing existing urban areas (cities and villages) with new cities. It also analyses two of the three sectors producing housing: the formal private sector and the public sector through social housing projects. As for the informal private sector, given that most units are built in existing villages and towns, and since statistical data on the number of informal units within new cities (roof and basement construction) is unavailable, we could not analyse it in this section.
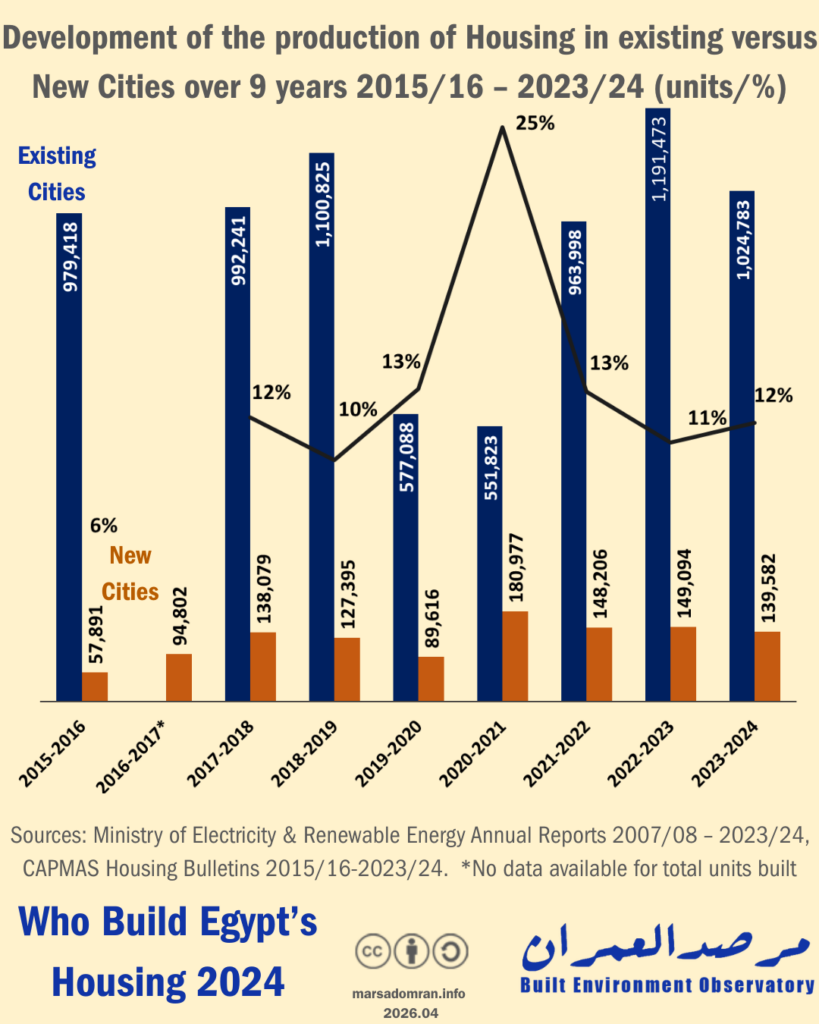
Housing production in new cities relative to existing urban areas rose from 6% in 2015/2016 to 12% two years later (Figure 11, Appendix 6). This ratio remained nearly constant in the following years, despite the expansion of new city construction over the past decade. This stability can be explained by the continued high output of the informal private sector, which builds the vast majority of units in existing settlements, whether in villages or cities. Given that rural homes account for a large share of the informal private sector, this data may reflect the lack of available plots in new cities that suit the needs of rural residents.
Figure 11: Trends in the number and share of housing production in existing urban areas versus new cities over a 9-year period, 2015/2016 to 2023/2024 (units and %)
Of the approximately 158,500 units built by the public housing sector during the 2023/2024 fiscal year,10 housing production in existing urban areas (cities and villages) accounted for only 12% of total production (19,000 units) (Figure 12, Appendix 6), compared to 88% (139,500 units) in new cities.
In terms of the evolution of housing production distribution between new cities and existing urban areas, there has been a marked increase in official housing production in new cities over the past nine years, rising from 23% in 2015/2016 to peak at 88% in 2023/2024 (Figure 12, Appendix 6).
This signifies a sharp decline in the number of official housing units (public and private) within existing urban areas, from approximately 195,000 units in 2015/2016 to about 19,000 units in 2023/2024–equivalent to about 10% of the output nine years ago, and approximately 85% less than the average output. In contrast, official housing production in new cities has doubled from approximately 58,000 units in 2015/2016 to more than 139,000 units in 2023/2024, which is about 12% higher than the nine-year average.
Figure 12: Evolution of the number and share of formal housing in existing urban areas versus new cities over 9 years, 2015/2016–2023/2024 (Units/%)
Comparison of the Public and Private Sectors in New Cities
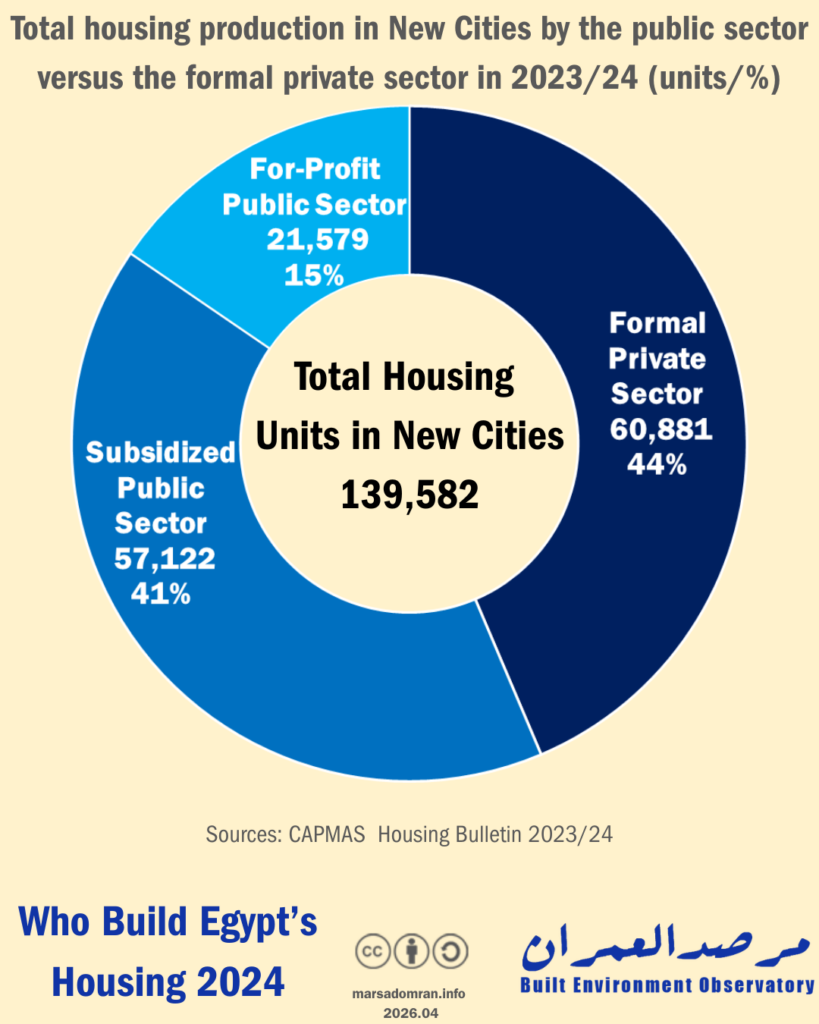
Of the approximately 140,000 units constructed in new cities throughout 2023/2024, the public sector built 78,700 of them (56%) through NUCA, while the formal private sector built 60,800 units (44%) (Figure 13, Appendices 6, 7, and 8) . Subsidised housing units accounted for 73% of public sector production in new cities, and 41% of total units built in new cities, this is compared to for-profit units, which are 27% of public sector production in new cities (about 15% of total housing units built in new cities).
Figure 13: Total housing production in new cities by the public sector versus the formal private sector in 2023/2024 (units/%)
Social Housing in New Cities vs.
Existing Cities
Of the 58,000 units built under the social housing project in 2023/2024, 98% (approximately 57,000 units) were constructed in new cities by NUCA (Figure 14, Appendix 7). Existing urban areas accounted for only 2%, or about 1,440 units, built by the Central Agency for Construction and the housing directorates of the governorates.
We can observe stark differences in the development of social housing units in existing cities and new cities over the past ten years. After production levels converged between 2013 and 2016, the number of units built in existing cities declined significantly, reaching its lowest level in 2023/2024 at 1,440 units. In contrast, subsidised housing production in new cities continued to rise, peaking at a 98% share of total production during the same year.
SHP domination in new cities can be understood through two factors: firstis the greater and easier availability of vacant land in New Cities, which are usually built on desert land on the margins of the Nile Valley and its delta, compared to the limited space in existing cities, especially state-owned land, as well as the complexity of the expropriation process and the importance of preserving agricultural land. The second factor could be the financial strength of NUCA in comparison to other agencies. With the concentration of poor and low-income populations concentrated in existing urban areas, the locations of SHP units in very remote areas, reduce its ability to meet the needs of these households.
Figure 14: Evolution of subsidised housing production in existing urban areas versus new cities over a 10-year period, 2014/2015–2023/2024 (units/%)
The Formal Private Sector in New Cities vs.
Existing Cities
Of the approximately 76,000 housing units built by the formal private sector in 2023/2024, 80% were constructed in new cities (60,000 units) (Figure 15, Appendix 8), compared to about 15,000 units in existing cities, representing only about one-fifth.
We can observe that the formal private sector dominated construction in existing cities during seven of the nine years covered by the data. Production in existing cities peaked at 167,000 units in 2017/2018, before declining to its lowest level in 2023/2024 with only 15,000 units built in existing cities—just 10% of the production level from nine years prior. In contrast, official private sector construction rates in new cities remained nearly stable during the same period at around 50,000 units annually, before dropping significantly in 2019/2020, then rising again since then, surpassing construction in existing urban areas for the second consecutive year and in the history of available data.
The likely reason behind this radical change is the government’s imposition of exceptional building regulations in 2021,11 which significantly curtailed official construction within existing cities due to the complexity and delays in the building permit process, in addition to the reluctance of a number of vacant land owners to build under these regulations, which reduced the allowable building ratio (floor area and number of stories), thereby reducing the potential returns of their construction projects.12 It should be noted that these requirements were repealed at the end of 2024, and the impact of this repeal may become apparent in future data.
Figure 15: Evolution of formal private sector production in existing urban areas versus new cities over 9 years, 2015/2016–2023/2024 (Units/%)
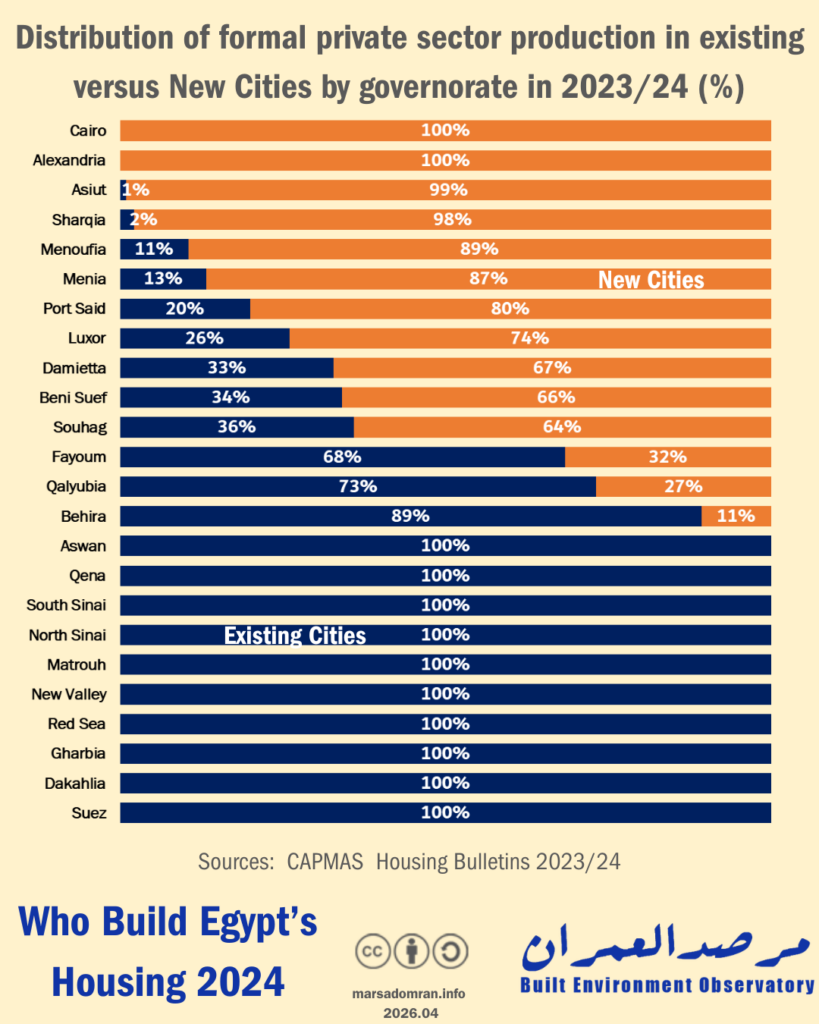
Looking at the distribution of official private sector construction across governorates, it is evident that construction in the governorates of Giza, Cairo, and Alexandria this year was limited solely to new cities, while it exceeded 50% in six other governorates, which may be linked to the continuation of the policy of halting construction in these governorates in accordance with presidential directives from previous years,13 and the imposition of special construction requirements since 2021 (Figure 16, Appendix 10).
Figure 16: Distribution of formal private sector housing in existing urban areas versus new cities by governorate in 2023/2024 (units/%)
Conclusion
The data reveals that recent urban planning policies have had a significant impact on housing construction, as decisions to restrict construction within existing urban areas have led to a marked decline in the formal private sector’s market share, causing it to fall to third place among producers. Although a large portion of its production has been redirected toward new cities, and the pace of housing construction there has increased compared to existing urban areas for the second consecutive year, this has not been sufficient to fully utilize its capacity, as total production has fallen to its lowest level in the past ten years.
As for the informal private sector, despite the emergence of the 2019 law on the reconciliation of building violations, and its subsequent editions –the latest of which was ratified in 2023– attempts to curb informal construction and the expansion of subsidised housing for low-income individuals and slum-clearance rehousing, it remained by far the largest producer of housing in Egypt. The informal sector has contributed to the stability of housing construction rates in Egypt over the past decade, which average one million units annually—a figure that exceeds the number of annual marriages (an indicator for measuring housing demand) by approximately 18%, or the equivalent of an annual surplus of nearly 185,000 units over the past five years.
Quantitatively, the study’s data indicates no actual need to build this number of housing units annually. The data also points to the importance of revising housing policies to include the informal private sector—which is predominantly a community-based sector—as it is the largest producer of housing in Egypt. This requires studying the mechanisms involved and reassessing certain aspects of building codes, as is currently being done with the Reconciliation Law, as well as amending NUCA’s policy on providing land for the private sector, while exploring ways to invest Egyptian expats’ savings in a productive industrial sector, instead of in real estate. We also reiterate the importance of establishing mechanisms to utilize the vast stock of unsold units, including both official and unofficial surpluses, which would help lower unit prices for both purchase and rent, in addition to reducing heat emissions from the construction sector—estimated at approximately 32% of total emissions—and mitigating climate change, which threatens millions of Egyptians, as outlined in the “National Strategy for Green Urbanism and Construction” launched in 2024.
Research Team
Senior Researcher: Yahia Shawkat
Assistant Researcher and Data Visualization: Sahar Nasser
Translation: Nadine Abd El Razek
When citing this study, please reference it as follows:
Yahia Shawkat and Sahar Nasser. Who Build Egypt’s Housing 2024. The Built Environment Observatory. April 26, 2026.
Appendices
Appendix 1: Methodology
The Formal Private Sector and the Public Sector
Housing statistics for the formal private sector and the public sector are collected on an annual basis by the government’s Central Agency for Public Mobilization and Statistics, collecting unit numbers from building permits issued by the local councils and the New Urban Communities Authority (responsible for new satellite cities), as well as housing built by state-owned enterprises (SOEs) from the ministry of housing. This information is collected on an annual (financial year) basis and has been published in a dedicated report from 2015,14 while prior to that it was part of a larger statistical report published since the 1960s.15
The Informal Private Sector
To date, no data on the informal private sector is collected on a regular basis. The Technical Inspection Authority for Construction Projects, affiliated with the Ministry of Housing, has stated that there are approximately three million informal buildings in Egypt that have been constructed since 2000.16 This figure does not specify the number of units within these buildings, which could number in the millions since each building contains between three and four units, nor is it broken down by year. The information is also based on police reports regarding building violations, which may include more than one violation per building, or those that have been repaired or demolished and are therefore no longer “informal.”
Consequently, methods relying on inference from other data are the only ones available to estimate housing production in the informal sector. The “residual” method was used to calculate production every ten years by isolating the net number of newly added housing units between each census and subtracting the officially produced units based on the data mentioned above.17 Although this method is somewhat accurate, these data are only available every ten years.
We used another method for the first time—the tenure security index as an indicator of urban deprivation—which relies on annual reports from the Ministry of Electricity and Renewable Energy detailing the total number of residential subscriptions.18 By subtracting the annual increase in subscribers, we can estimate the net annual additions of new housing units, which is significantly higher than the number of officially produced housing units reported by the Central Agency for Public Mobilization and Statistics. By subtracting the officially reported housing units from this total, the remaining figure represents an estimate of the number of informally built units.
Limitations
For the formal private sector, the data is based on building permits, which represent potential starts of construction and do not necessarily confirm actual construction. Projects are completed according to different timelines; the fastest projects are completed within one or two years, while others take longer to complete. In some cases, construction may never begin. Therefore, this is merely a forward-looking estimate of a potential future, not actual output during the year.
For the informal private sector, the data is based on the addition of subscribers with meters. Informally built units typically have tap-offs (stolen electricity connections),19 which are not metered and do not appear in the data as individual subscriptions. Since the 1990s, the government has allowed state-owned electricity companies to accept informal settlements in batches, with owners submitting subscription applications. In the most recent batch, between July 2020 and July 2021, after the ministry finally stopped accepting new applications, owners submitted requests to convert 2.1 million units from informal connections to meters20. Between then and May 2022, 980,000 meters were installed21—just under half of the applicants—leaving a large number of applicants still awaiting installation, while others may be denied installation if they fail to prove they meet certain criteria. Following the Cabinet’s announcement in August 2024 to install temporary code meters for all violators without exceptions or preconditions,22 nearly two million code meters were installed from the beginning of July 2024 through the end of October 2025.23 These figures represent actual units; however, they do not reflect annual production, as connections are provided to units that were established several years ago.
Appendix 2: Housing Production Figures by Sector, 2006/2007–2023/2024 (Units)
|
Year |
Total |
Public sector |
Formal private sector |
Informal private sector |
|
2006/07 |
Unavailable* |
16,567 |
142,482 |
Unavailable* |
|
2007/08 |
1,020,585 |
25,774 |
165,043 |
829,768 |
|
2008/09 |
692,456 |
33,904 |
124,630 |
533,922 |
|
2009/10 |
837,449 |
53,651 |
142,409 |
641,389 |
|
2010/11 |
861,470 |
70,293 |
114,149 |
677,028 |
|
2011/12 |
1,569,107 |
78,529 |
98,188 |
1,392,390 |
|
2012/13 |
1,344,369 |
30,573 |
105,057 |
1,208,739 |
|
2013/14 |
828,322 |
42,500 |
103,283 |
682,539 |
|
2014/15 |
864,561 |
47,944 |
131,082 |
685,535 |
|
2015/16 |
1,047,657 |
95,772 |
167,743 |
784,142 |
|
2016/17* |
Unavailable* |
100,548 |
216,636 |
Unavailable* |
|
2017/18 |
1,131,910 |
105,076 |
221,187 |
805,647 |
|
2018/19 |
1,223,093 |
100,511 |
180,770 |
941,812 |
|
2019/20 |
662,007 |
84,981 |
109,268 |
467,758 |
|
2020/21 |
737,921 |
166,531 |
169,798 |
401,592 |
|
2021/22 |
1,113,279 |
130,660 |
115,411 |
867,208 |
|
2022/23 |
1,343,049 |
122,452 |
118,308 |
1,102,289 |
|
2023/ 2024 |
1,164,797 |
82,728 |
76,211 |
1,005,858 |
|
10-year average |
1,032,030 |
103,720 |
150,641 |
784,649 |
* Data was not available to accurately calculate total production
Sources: See Methodology
Appendix 3: Public Sector Housing Production by Type, 2013/2014–2023/2024
|
Year |
Subsidised housing* |
For-profit housing** |
Total |
|
Total |
760,326 |
275,893 |
1,036,219 |
|
2013-2014 |
40,690 |
1,810 |
42,500 |
|
2014-2015 |
43,914 |
4,030 |
47,944 |
|
2015-2016 |
82,191 |
4,149 |
86,340 |
|
2016-2017 |
54,313 |
5,651 |
59,964 |
|
2017-2018 |
88,512 |
16,564 |
105,076 |
|
2018-2019 |
82,864 |
23,227 |
106,091 |
|
2019-2020 |
59,370 |
31,333 |
90,703 |
|
2020-2021 |
101,671 |
60,962 |
162,633 |
|
2021-2022 |
97,030 |
33,630 |
130,660 |
|
2022-2023 |
49,989 |
71,591 |
121,580 |
|
2023-2024 |
59,782 |
22,946 |
82,728 |
* Subsidized/non-profit housing: the Central Agency for Reconstruction, the Housing Directorates, the New Urban Communities Authority (Social Housing Project/Housing for All Egyptians), the Building and Housing Cooperatives Authority (cooperative housing), and the Urban Development Fund/Informal Settlements Development Fund (slum replacement housing).
** For-profit housing: New Urban Communities Authority (Masr Housing Projects, Dar Masr, Jannah, New Administrative Capital, New Alamein, New Mansoura), Urban Development Fund (Darah Project), Housing and Development Companies, Executive Authority for Joint Projects, Housing and Development Bank, and Housing Finance Fund.
Source: Central Agency for Public Mobilization and Statistics, “Housing Bulletin,” 2015/2016–2022/2023.
Appendix 4: For-Profit Government Housing by Authority and Project, 2013/2014–2023/2024
|
Year |
NUCA* |
UDF** |
Other** * |
Total |
|
Total |
182,560 |
60,426 |
32,907 |
275,893 |
|
2013-2014 |
– |
– |
1,810 |
1,810 |
|
2014-2015 |
– |
– |
4,030 |
4,030 |
|
2015-2016 |
– |
– |
4,149 |
4,149 |
|
2016-2017 |
1,800 |
– |
3,851 |
5,651 |
|
2017-2018 |
13,590 |
– |
2,974 |
16,564 |
|
2018-2019 |
22,122 |
– |
1,105 |
23,227 |
|
2019-2020 |
28,978 |
– |
2,355 |
31,333 |
|
2020-2021 |
53,669 |
– |
7,293 |
60,962 |
|
2021-2022 |
31,710 |
– |
1,920 |
33,630 |
|
2022-2023 |
9,112 |
59,812 |
2,667 |
71,591 |
|
2023-2024 |
21,579 |
614 |
753 |
22,946 |
* Sakan Misr Housing Projects, Dar Misr, Jannah, New Administrative Capital, New Alamein, New Mansoura
** The Darah Project and Al-Fustat View
*** Others: Projects of the Central Agency for Reconstruction, Housing Directorates, the Joint Projects Authority, the Housing Finance Fund, the Housing and Reconstruction Bank, and housing and reconstruction companies.
Source: Central Agency for Public Mobilization and Statistics, Annual Statistical Yearbook – Housing Section, 2008–2015, and: Housing Bulletin in Egypt, 2015/2016–2023/2024.
Appendix 5: Subsidised/Non-Profit Government Housing by Authority and Project, 2013/2014–2023/2024
|
Year |
Cooperative housing* |
Slum-clearance rehousing** |
Subsidised housing*** |
Total |
|
Total |
13,682 |
91,465 |
652,989 |
758,136 |
|
2013-2014 |
1,433 |
– |
39,257 |
40,690 |
|
2014-2015 |
809 |
– |
43,105 |
43,914 |
|
2015-2016 |
976 |
– |
80,363 |
81,339 |
|
2016-2017 |
382 |
17,363 |
36,568 |
54,313 |
|
2017-2018 |
1,154 |
5,357 |
82,001 |
88,512 |
|
2018-2019 |
2,088 |
12,904 |
67,704 |
82,696 |
|
2019-2020 |
2,768 |
4,208 |
51,224 |
58,200 |
|
2020-2021 |
2,988 |
20,302 |
78,381 |
101,671 |
|
2021-2022 |
124 |
28,903 |
68,003 |
97,030 |
|
2022-2023 |
816 |
1,208 |
47,965 |
49,989 |
|
2023-2024 |
144 |
1,220 |
58,418 |
59,782 |
* The General Authority for Building and Housing Cooperatives
** UDF/ISDF
*** NUCA, the Central Construction Agency, and governorate housing directorates
Source: Central Agency for Public Mobilization and Statistics, “Annual Statistical Yearbook – Housing Section,” 2008–2015, and: “Housing Bulletin in Egypt,” 2015/2016–2023/2024.
Appendix 6: Total Official Housing (Public and Private) in New Cities vs. Existing Areas, 2015/2016–2023/2024
|
Year |
Existing urban areas |
New cities |
Total |
|
Total |
1,186,469 |
1,125,642 |
2,312,111 |
|
2015-2016 |
195,276 |
57,891 |
253,167 |
|
2016-2017 |
181,126 |
94,802 |
275,928 |
|
2017-2018 |
186,594 |
138,079 |
324,673 |
|
2018-2019 |
159,013 |
127,395 |
286,408 |
|
2019-2020 |
109,330 |
89,616 |
198,946 |
|
2020-2021 |
150,231 |
180,977 |
331,208 |
|
2021-2022 |
96,790 |
148,206 |
244,996 |
|
2022-2023 |
89,184 |
149,094 |
238,278 |
|
2023-2024 |
18,925 |
139,582 |
158,507 |
Note: The formal private sector was calculated based on data from the “Housing Bulletin,” while the total informal private sector was calculated based on existing housing stock, given the prevalence of such activity in that sector and the lack of detailed data. The public sector was also calculated based on the most common region for the authority due to the unavailability of data, as follows: New cities: New Urban Communities Authority, Building and Housing Cooperatives Authority.
Existing Housing Stock: Urban Development Fund, Central Agency for Reconstruction, Housing Directorates, Joint Projects Authority, Housing Finance Fund, Housing and Reconstruction Bank, and Housing and Reconstruction Companies.
Sources: Appendix 2 and: Central Agency for Public Mobilization and Statistics, “Housing Bulletin,” 2015/2016–2023/2024.
Appendix 7: Social Housing in New Cities vs. Existing Urban Areas 2013/2014–2023/2024
|
Year |
Existing urban areas* |
New cities** |
New cities % |
Total |
|
Total |
140,299 |
486,170 |
626,469 |
|
|
2013-2014 |
7,104 |
12,068 |
63% |
19,172 |
|
2014-2015 |
22,858 |
16,282 |
42% |
39,140 |
|
2015-2016 |
40,719 |
38,816 |
49% |
79,535 |
|
2016-2017 |
8,440 |
27,912 |
77% |
36,352 |
|
2017-2018 |
12,325 |
69,676 |
85% |
82,001 |
|
2018-2019 |
17,368 |
50,336 |
74% |
67,704 |
|
2019-2020 |
7,392 |
43,832 |
86% |
51,224 |
|
2020-2021 |
13,471 |
64,910 |
83% |
78,381 |
|
2021-2022 |
4,803 |
62,888 |
93% |
67,691 |
|
2022-2023 |
4,635 |
42,472 |
90% |
47,107 |
|
2023-2024 |
1,184 |
56,978 |
98% |
58,162 |
* Central Agency for Reconstruction, Housing Directorates
** NUCA
Source: Central Agency for Public Mobilization and Statistics, “Housing Bulletin,” 2015/2016–2023/2024.
Appendix 8: Official Private Sector Production in New Cities vs. Existing Urban Areas, 2015/2016–2023/2024
|
Year |
Existing urban areas |
New cities |
New cities % |
Total |
|
Total |
904,884 |
470,448 |
34% |
1,375,332 |
|
2015-2016 |
150,496 |
17,247 |
10% |
167,743 |
|
2016-2017 |
151,928 |
64,708 |
30% |
216,636 |
|
2017-2018 |
167,528 |
53,659 |
24% |
221,187 |
|
2018-2019 |
128,089 |
52,681 |
29% |
180,770 |
|
2019-2020 |
96,400 |
12,868 |
12% |
109,268 |
|
2020-2021 |
110,388 |
59,410 |
35% |
169,798 |
|
2021-2022 |
62,239 |
53,172 |
46% |
115,411 |
|
2022-2023 |
22,486 |
95,822 |
81% |
118,308 |
|
2023-2024 |
15,330 |
60,881 |
80% |
76,211 |
Source: Central Agency for Public Mobilization and Statistics, “Housing Bulletin,” 2015/2016–2023/2024.
Appendix 9: Housing Production vs. Number of New Marriages, 2019/2020–2023/2024
|
Year |
New housing |
New marriages |
Surplus/deficit |
Surplus/deficit % |
|
2019/20 |
662,007 |
755,908 |
-93,901 |
-14% |
|
2020/21 |
737,921 |
764,345 |
-26,424 |
-4% |
|
2021/22 |
1,113,279 |
812,313 |
300,966 |
27% |
|
2022/23 |
1,343,049 |
824,444 |
518,605 |
39% |
|
2023/ 2024 |
1,164,797 |
936,739 |
228,058 |
20% |
|
5-year average |
1,004,211 |
818,750 |
185,461 |
18% |
Sources: Appendix 2 and: Central Agency for Public Mobilization and Statistics, “Annual Bulletin of Marriage and Divorce Statistics” 2019/2020–2023/2024.
Appendix 10: Official Private Housing Production in New Cities vs. Existing Housing Stock by Governorate for 2023–2024
|
Governorate |
New Cities |
Existing Urban Areas |
|
Suez |
– |
10 |
|
Al-Dakahliya |
– |
1,952 |
|
Al-Gharbiya |
– |
63 |
|
Red Sea |
– |
714 |
|
New Valley |
– |
356 |
|
Matrouh |
– |
576 |
|
North Sinai |
– |
7 |
|
South Sinai |
– |
95 |
|
Qena |
– |
5 |
|
Aswan |
– |
1,157 |
|
Al-Beheira |
129 |
1,083 |
|
Al-Qalyubia |
1,686 |
4,577 |
|
Fayoum |
661 |
1,430 |
|
Suhag |
1,485 |
832 |
|
Beni Suef |
562 |
291 |
|
Damietta |
2,007 |
978 |
|
Luxor |
647 |
228 |
|
Port Said |
404 |
101 |
|
Minya |
1,214 |
185 |
|
Al-Munufiya |
3,921 |
462 |
|
Al-Shar’iya |
9,699 |
218 |
|
Assiut |
2,879 |
10 |
|
Alexandria |
216 |
– |
|
Cairo |
11,204 |
– |
|
Giza |
24,167 |
– |
1 For example, five out of nine electricity distribution companies announced the installation of 881,000 smart meters for non-compliant buildings during the 2023/24 fiscal year. Al-Mal, “North Cairo Electricity Adds 175,000 Smart Meters for Its Subscribers During 2024/2023,” October 27, 2024.
Long Live Egypt, “370,000 New Meters and 128,000 Prepaid Cards in South Cairo During 2023–2024,” December 1, 2024.
Youm7, “Central Egypt” Leads Distribution Companies After Recovering 1.4 Billion Pounds from Electricity Theft,” October 18, 2024.
Youm7, “Alexandria Electricity Succeeds in Installing 108,000 Meters in 2024,” October 21, 2024.
Al-Watan, “EGP 975 Million in Investments Made Under the Beheira Electricity Distribution Plan Over the Course of a Year,” November 20, 2025.
2 BEO: “New Planning and Building Regulations – Summary of Developments.” April 28, 2021
3 Minister of Housing Decision No. 943 of 2024.
5 Ministry of Planning. “Dr. Rania Al-Mashat: We are working to implement a new framework for the ministry’s work that improves the formulation and effectiveness of development plans.” December 29, 2024.
6 The term “number of new marriages” was used rather than “total number of marriages” because the total figure includes remarriages and therefore does not serve as an indicator of new demand for housing.
7 For more information on cooperative housing, see:
Salma Khamis, “Tracing Cooperative Housing in Egypt,” 2022, https://depositonce.tu-berlin.de/handle/11303/17258.
Karim S. Noureldin, Ahmed O. El-Kholei, and Ibrahim Sedky Rezkalla, “Housing Cooperatives in Egypt: Challenges, Constraints, and Solutions,” Journal of Housing and the Built Environment 39, no. 4 (December 1, 2024): 1965–86, https://doi.org/10.1007/s10901-024-10137-2.
8 Yahia Shawkat and Dina Al-Mazzahi, “Estimating the Size of Egypt’s Public Real Estate Sector,” April 18, 2023.
9 The Authority wholly or partially owns real estate companies such as City Edge, Saudi Egyptian Construction, and Hyde Park, but the statistics do not appear to include the units they have developed.
10 Data distinguishing between new cities and existing urban areas has only been available since 2015/2016, so the comparison covers nine years rather than ten, as is the case with the rest of the data.
11 The BEO, New Planning and Building Regulations – Summary of Developments, April 29, 2021.
12 A Breakthrough Expected in the Construction Sector with the Return to the Old Law and the Suspension of New Requirements, Al-Shorouk, September 27, 2024,
14 Central Agency for Public Mobilization and Statistics, “Bulletin of Housing in Egypt”, 2015/2016 – 2023/2024
15 “Statistical Yearbook – Housing”, 2008 – 2015.
16 Al-Akhbar, ‘Housing inspection: 2 Million and 900 Thousand illegal properties in Egypt (Arabic)’, 26 February 2018
17 See for example: Yahia Shawkat, Egypt’s Housing Crisis: The Shaping of Urban Space (Cairo: American University in Cairo Press, 2020); David Sims, Understanding Cairo: The Logic of a City Out of Control (Cairo: American University in Cairo Press, 2010); Stephen K. Mayo, Harry Garnett, and Mohamed Ramez, ‘Informal Housing in Egypt’ (Cambridge Mass.: Abt Associates, Dames and Moore, GOBHR, USAID, January 1982)
18 Ministry of Electricity and Energy, ‘Egypt Electricity Holding Company Annual Report’ 2006/2007 through 2020/2021, and 2021/2022. Subscribers labelled as ‘Residential’, in addition to a weighted portion of ‘Closed/postponed’ and ‘Zero Reading’ because of their significant numbers. These statistics represent all formal electricity subscribers whether through formal contracts, or semi-formal ‘coded meters’. They do not include unmetered connections or mumarsa, as they are bundled together in ‘Others’, which may include many non-residential users.
19 Owners of homes built without a permit cannot initially apply formal electricity connections. They must first ‘steal’ power through informal connections to the grid and then report it to the police and electricity company authorities who then record the infringement and issue a penalty based on the size of the units and its use that is paid on a monthly or bimonthly basis. Failure to pay may result in a heavier fine or jail. Owners with such agreements have been allowed to change to so-called ‘coded meters’ since 2011 if they demonstrate certain criteria, a legal connection paying standard electricity rates, though without a fully formalized contract so as not to prove tenure. For more see: Shawkat, Egypt’s Housing Crisis: The Shaping of Urban Space, chap. 2.
20 ‘Coded Electricity Meters: Grace Period Officially Ends on Saturday and Last Chance to Apply (Arabic)’, Amwal al-Ghad, 29 July 2021.
21 ‘980,000 Meters Connected So Far for Violators (Arabic)’, Al-Youm al-Sabe’, 28 May 2022.
22 Egyptian Electricity Holding Company, August 15, 2024.