- Published on 19 November 2016
Introduction[1]
Have you ever wondered whether the government was spending enough on transport? Or whether your governorate got its fair share of public expenditure? Or how strong national policy favoured New Cities?
The Built Environment Budget series, starting with an analysis of the Financial Year (FY) 2015/16, seeks to answer these questions and more, by focusing on public investments in six sectors that make up Egypt’s built environment: housing; urban development; water; waste-water; electricity, and transport.
The BE Budget 2015/16 analyses these sectors by looking at both National and sub-national (governorate) level spending, to investigate spatial equity. It also gives a picture based on Egypt’s particular duality of local administration. On the one hand, this picture is based on examining the mainstream municipalities that run the Existing Built Environment (Existing BE) where over 98 percent of Egyptians live. On the other it is based on looking at the Ministry of Housing affiliated New Urban Communities Authority (NUCA), a large public corporation that builds and manages so-called New Cities that have been part of the government’s policy to redistribute population growth to the desert over the last four decades.[2]
Executive Summary and Key Findings
The BE Budget analysed the investment budgets (Chapter 6) of four ministries and 27 governorates, as well 14 agencies affiliated to them. These investments totalled 98.9 Bn EGP, of which only 37% was part of the General State Budget, while the rest were investments by state-owned enterprises (Table 1).[3]
Table 1: Investments in the built environment by administration (‘000s EGP)
| Administration | State-owned Enterprises | General State Budget | Total | |
| Ministry of Housing, Utilities & Urban communities | 29,885,183 | 21,384,689 | 51,269,872 | 51.8% |
| Ministry of Electricity | 25,303,400 | 0 | 25,303,400 | 25.6% |
| Ministry of Transport | 6,840,000 | 11,694,800 | 18,534,800 | 18.7% |
| Ministry of Local Development | 0 | 650,000 | 650,000 | 0.7% |
| Governorates | 362,735 | 2,765,536 | 3,128,271 | 3.2% |
| Total | 62,391,318 | 36,495,025 | 98,886,343 | 100.0% |
| 63.1% | 36.9% | 100% | ||
Total investments represented 3.6% of GDP, while the General State Budget expenditure represented almost half of total Chapter 6 expenditure by the Treasury this year. The largest investor by far was the Ministry of Housing, Utilities and Urban Communities (MoH) with a little over half the budget. The second largest investor was the Ministry of Electricity at a quarter of the budget, followed by the Ministry of Transport with a share of less than 20%. The governorates and Ministry of Local Development administer less than 4% of the built environment budget.
Duality of Managing the Built Environment: an Unexplained Contrast
Around 59% of the BE Budget is spent on local projects (housing, water and waste-water plants and networks, local electricity networks, local transport and urban development), while the rest is spent on projects that cross regional borders (railroads and power stations and grids) (Fig. 1). The BE Budget reveals the stark and unexplained contrast between how a single agency, the New Urban Communities Authority, is responsible for almost a third of the overall built environment budget, and half of the investments in local projects. It invests in all six sectors and operates in 19 governorates through 31 local branches.[4] On the other hand, the other half of local project spending goes to the Existing BE across the same six sectors, but is scattered among nine national-level agencies based in three ministries, and 27 offices in 27 governorates, in addition to two local governorate-based agencies.[5]
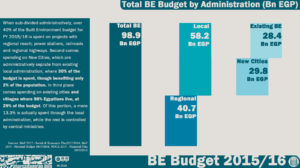
Fig. 1: Total BE Budget by Administration
Favouring Real Estate over Social Investments
This duality has also meant that public spending on the local level has favoured investments in real estate, as well as politically informed rather than needs driven urban development (Fig. 2). The analysis has found that 7% of the BE Budget has been directed solely to two New Cities. The first is the New Administrative Capital in Cairo (5 Bn EGP),[6] a government city being built from scratch despite there being no demonstrably urgent need to do so. The second is New Alamein in Matruh (2 Bn EGP), a large coastal tourist resort.[7] These investments are comparable to local investments for all sectors in Cairo’s Existing BE (5.8 Bn EGP), and are double those in Matruh (0.9 Bn EGP). They are also one and a half times more than the total investments for much needed waste-water infrastructure across Egypt (4.8 Bn EGP), and over two and a half times more than investments in water plants and networks for millions of Egyptians deprived of them (2.7 Bn EGP).
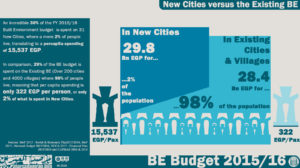
Fig. 2: Investments in local projects; New Cities versus the Existing BE
Spatial Inequality between New Cities and the Existing BE
Besides the stark regional inequality in public spending, there seems to be a conscious decision by officials to spend very little on the Existing BE in regions where there are New City projects. Per capita spending on Greater Cairo more than doubles when New Cities are factored in, while spending rises 70% in Alexandria, 50% in Upper Egypt and 40% in the Delta when New Cities are added (Table 2).
However, in spite of the added spending on New Cities in these four regions, they still lag in per capita terms behind the Suez Canal and Frontier regions’ Existing BE investments, where expenditure on New Cities has only been introduced this year. The difference also grows once New City expenditure is added.
Table 2: Effect of investments in New Cities on per capita spending by region (EGP/person)
| Regions | Existing BE (EGP/person) | Existing BE & New Cities
(EGP/person) |
Ratio |
| Grater Cairo | 63 | 140 | 2.2 |
| Alex. | 44 | 73 | 1.7 |
| Suez Canal | 141 | 148 | 1.0 |
| Delta | 37 | 52 | 1.4 |
| Upper Egypt | 45 | 68 | 1.5 |
| Frontier | 440 | 583 | 1.3 |
| Average | 128 | 177 | 1.4 |
Spatial Inequality in the Existing BE: Regional as well as Sub-regional Disparity
On the local Existing BE level, our analysis has shown a wide spectrum of per capita spending across the regions in each sector. The Frontier region received the highest per capita expenditure in all six sectors, an attribute partially explained by their far below average population sizes as well as their above average areas (Table 3). The Suez Canal region came second overall in per capita spending, with generally above average per capita spending throughout. Greater Cairo was third amongst the regions in per capita spending, and generally below average.
In fourth place was the predominantly rural Upper Egypt, with an overall per capita spending of 35% of the national average as most per capita spending was below and well below average across the sectors. Alexandria, an urban governorate and Egypt’s third largest city, was, surprisingly, next to last amongst the regions in per capita spending, with consistently below average per capita spending across all six sectors. The Delta was the region with the least per capita spending, at 29% of the average overall per capita share.
Table 3: Per capita spending on the Existing BE by Sector and Region (EGP/person)
| Regions | Existing BE | ||||||
| Electricity | Transport | Social Housing | Waste-water | Water | Urban Develop. | Average | |
| Grater Cairo | 4 | 191 | 72 | 72 | 31 | 9 | 63 |
| Alex. | 2 | 66 | 96 | 68 | 22 | 7 | 44 |
| Suez Canal | 28 | 57 | 551 | 133 | 37 | 41 | 141 |
| Delta | 3 | 28 | 105 | 58 | 26 | 1 | 37 |
| Upper Egypt | 9 | 41 | 142 | 45 | 24 | 6 | 45 |
| Frontier | 93 | 329 | 1556 | 181 | 283 | 198 | 440 |
| Average | 23 | 119 | 420 | 93 | 71 | 44 | 128 |
All regions suffered from internal spending disparities, with one or two governorates receiving above or high above average spending in a number of sectors, while others receiving below or well below average per capita spending in most if not all sectors.[8] This large range of per capita spending indicates that spending is not necessarily needs-based. Budgets are similar in a number of governorates regardless of their population, where Damietta, Kafr al-Shiekh and Luxor were assigned identical budgets for their Existing BE Social Housing budget (See Appendix 5).
Spatial Inequality in New Cities: Regional as well as Sub-regional Disparity
There was regional disparity in per capita spending on New Cities, with just one city on its own, New Alamein in Matruh, raising the Frontier governorates to the top of the six regions (Table 4). That is despite very modest spending in Wadi al-Gadid and no New City programmes in the remaining three Frontier governorates. Overall, Matruh received the highest per capita spending amongst all the governorates in four out of the six sectors, with no spending on Social Housing or Urban Development.
Greater Cairo received the second highest per capita spending, and were it not for the anomaly of high spending on New Alamein, would have been NUCA’s top region by far, at 2.6 times higher per capita spending than the next region down (Alexandria). Alexandria had the third highest per capita investments, all in New Borg al-‘Arab, though generally below average across the sectors. The Delta came fourth in per capita investments, even though it is home to five New Cities in four of its seven governorates. Upper Egypt trailed the Delta by a small margin, even though all its eight governorates are home to 11 New Cities, three of which are still under construction. The Suez Canal region understandably had the least per capita spending as it is the first year of construction for East Port Said and North Suez in Port Said and Suez respectively.
Table 4: Per capita spending in New Cities by Sector and Region (EGP/ Person)
| Regions | New Cities | ||||||
| Electricity | Transport | Social Housing | Waste-water | Water | Urban Develop. | Average | |
| Grater Cairo | 44 | 53 | 62 | 99 | 43 | 177 | 80 |
| Alex. | 26 | 20 | 46 | 76 | 11 | 0 | 30 |
| Suez Canal | 7 | 5 | 0 | 43 | 7 | 0 | 10 |
| Delta | 12 | 29 | 49 | 37 | 38 | 0 | 27 |
| Upper Egypt | 23 | 22 | 64 | 23 | 11 | 0 | 24 |
| Frontier | 536 | 321 | 0 | 751 | 537 | 0 | 358 |
| Average | 108 | 75 | 37 | 172 | 108 | 29 | 88 |
Sectoral Inequality between New Cities and the Existing BE
Per capita spending by sector was more than three times higher in New Cities than in the Existing BE. The biggest difference was in local electricity networks, where spending on new networks and maintenance in the New Cities was 45 times higher than in the Existing BE (Table 5). Urban Development was four times higher and local transport (all roads and bridges) was three times higher, even though investments in the Existing BE included public transit and underground metro lines. New Cities also received double the per capita spending on both water and waste-water infrastructure, and 30% more on Social Housing.
Table 5: Effect of investments in New Cities on per capita spending by sector
| Local Electricity | Local Transport | Social Housing | Waste-water | Water | Urban Develop. | Average | ||
| Existing BE
(EGP/person) |
7 | 85 | 126 | 54 | 30 | 18 | 53 | |
| Existing BE & New
(EGP/person) |
314 | 270 | 169 | 109 | 58 | 73 | 166 | |
| Ratio Existing : New | 45.6 | 3.2 | 1.3 | 2.0 | 1.9 | 4.0 | 3.1 | |
Numbers Do Not Tell the Whole Story: Evidence of Drastic Modification
In the end, elements of the public budget could be drastically modified, either raised or lowered, within the course of the financial year, rendering it and this analysis more indicative than definitive. In some cases, public investment figures may be over ambitious. For example, there was consistent under-spending for the Social Housing Projetct. Only between 20% and 52% of its planned budget over three consecutive financial years was spent (Fig. 3).[9]
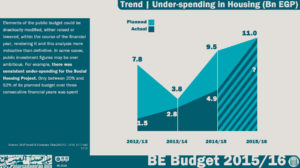
Fig. 3: Under-spending on housing in FY 2012/2013 through 2014/2015
On the other hand, year-end modifications, and not final accounts, show both modest and drastic changes to agency budgets. For example the Ministry of Housing, Utilities and Urban Communities’ budget for FY 2013/14 was increased by 13.5Bn EGP, or about 168%.[10]
1. Methodology
The Built Environment Budget for FY 2015/16 has compiled data and information from several sources to provide its analysis. The project uses publicly available information only, giving a near accurate estimate of how much money the government allocates to the various built environment related sectors: building housing units; developing residential areas; providing roads and transportation for commuting in neighbourhoods and cities; building water and waste-water stations and networks; as well as providing electricity through power stations and grids.
Therefore, data compiled is consolidated to reflect information through six main sectors: 1) Housing Projects, 2) Urban Development, 3) Water, 4) Waste-water, 5) Transportation and 6) Electricity, with more detail within the sectors in the case of multiple projects. Furthermore, the BE Budget categorises public built environment spending according to both local spending on the sub-national governorate level to analyse spatial equality of public spending, as well as National spending for projects that cross sub-national borders such as National highways, rail-roads and electricity generation and networks. Another administrative distinction is made at the sub-national level particular to Egypt, which has dual local administrative structures. The first is the Existing Built Environment, composed of the mainstream municipalities that manage over 200 cities and 4000 villages and where over 98 percent of Egyptians live. The second are the so-called New Cities, composed of around 31 new urban settlements built in desert locations over the last four decades where 20 active, one is a mega tourist resort, and nine are under construction. Most New Cities have been built as satellites to large existing cities, and all constructed and run by a public corporation, the New Urban Communities Authority (NUCA), chaired by the Minister of Housing, Utilities and Urban Development.
1.1 Built Environment Sectors
Six sectors were chosen to represent built environment spending based on a number of criteria (Table 6). The sectors had to make up the physical built environment, have a general public benefit, use public funds, and have budget data available at the national or sub-national levels.
Table 6: Built environment sectors by administration and projects
| Sector | Projects | ||
| National | Sub-national | ||
| Existing Built Environment | New Cities | ||
| Roads and Transportation | National Roads and Bridges | Local Roads and Bridges | Local Roads and Bridges |
| Railways | N/A | N/A | |
| N/A | Underground Metro | ||
| Public Buses | |||
| Electricity | Power Stations and Grids | Local Networks | Local Networks |
| Water | N/A | Treatment Stations & Networks | Treatment Stations & Networks |
| Waste-water | N/A | Treatment Stations & Networks | Treatment Stations & Networks |
| Housing | N/A | Social Housing Programme | Social Housing Programme |
| N/A | Middle Income Housing/ Dar Masr | ||
| Cooperative Housing Programme | N/A | ||
| Rural Housing (Desert Villages/Bedouin Housing/ Housing Repair) | N/A | ||
| Urban Development | N/A | Most Needy Villages Project | New Administrative Capital |
| Urban Renewal | |||
| Integrated Urban Development | |||
Physical Built Environment
The sectors of Transport, Electricity, Water, Waste-water, Housing, and Urban Development were all chosen because of how they constitute and shape the built environment. While the built environment cannot function without other sectors such as solid waste management and social services (health, education, security, etc.), the BE Budget has focused on sectors where public spending is used to build infrastructure. This is isolated in the public budget as Chapter 6, and does not include any other spending.
Some sectors that partly fit the criteria, but the main purpose of which does not comfortably fit within the everyday built environment sector category have not been selected. These include flood defences, National natural gas networks, airports and sea-ports. The local natural gas network sector was not included because of time constraints.
General Public Benefit
All projects identified in this analysis must be accessible to the public or provide general public benefit. Some exceptions to this are the Cooperative Housing Programme and the Middle Income Housing Programme (Dar Masr), which sell housing to middle and upper middle income groups and are considered profitable. These have been included to highlight how public finance is used, especially public land. The latter project represents a large proportion of spending by a government agency, NUCA, that is supposed to focus on public projects.
Public Funds
Most of the built environment sectors in Egypt depend on public spending through state affiliated agencies. These are classified into; Government (Ministries and their offices/departments, Service Authorities directly affiliated to ministries and Local Administration offices/departments), and State-Owned-Enterprises (Economic agencies, public sector companies). SOEs are defined as publicly owned corporations through which the government undertakes commercial activities for social and economic projects.
State-Owned-Enterprises’ investments are included in this research as they play a major role in the Built Environment projects in Egypt. Other than having funding from private sources and collecting payments from companies, there is also a relationship between SOE’s and the National Treasury, where funds come in to SOE’s through the National Treasury. Revenues from SOE’s flow to the National Treasury and to quasi-fiscal expenditures as well. SOE’s budgets are independent of the General State Budget but their investments directly serve the Egyptian Economic and Social Development Program.[11]
On the other hand there are a number of SOEs that use public money for mostly profitable construction and real estate activity, and these have not been included. One example is the Holding Company for Construction and Development and its real estate development subsidiaries, the Maadi, Heliopolis and el-Nasr companies.[12]
And while the private sector through their corporate social responsibility activities, charities, NGOs and donor agencies invest to some degree in the built environment, any of their expenditure that is exclusive to the State Budget and its agencies or that was not part of the agencies covered, is not included in the BE Budget.
Available Data
There are a number of agencies that fit the built environment criteria but that we could not find publicly available data for, and these were also not included. These include;
- The Holding Company for Water and Waste Water. Most public holding companies’ budgets are not published regularly or at all. Only the Egyptian Electricity Holding Company (EEHC) is made available as one bulk figure, published through the Ministry of Planning documents.
- So-called private funds, sanadiq khassa, investing in public housing and urban development projects and affiliated to government agencies such as the Tahya Masr Fund (Presidency) and Governorate Services’ Funds, are excluded, as their budgets are not published.
1.2 Built Environment Divisions & Regions
Spending has been analysed based on; regional and local projects; two local administration structures particular to Egypt (Existing BE and New Cities); and six geographic regions.
Spatial Spending 1; Regional Projects and Local Projects
Regional projects are those that cross sub-national (governorate) borders and that could not be isolated at the local level such as national highways, rail-roads and electricity generation and grids. Their spending is presented as national totals only. Local projects are those that serve communities within the administrative boundaries of governorates such as local roads and highways, water and waste-water infrastructure, housing, urban development and local electricity networks. Their spending is presented as both a national total as well as per governorate. In some cases some local projects’ spending within one sector is not disaggregated, hence there are differences between the sub-national totals and the grand totals.
Spatial Spending 2; Geographic Regions
There is as yet no regional level administration, even though a provision for such a system has existed since 1977 and outlined seven or eight so-called Economic Regions. In this research we have identified six socio-geographic regions that better reveal spatial inequality and are different from the Economic Regions. They are:
- The largely urban capital metropolis of Greater Cairo (Cairo, Giza and Qalyubia)
- Egypt’s second largest city/governorate of Alexandria
- The cohesive Suez Canal zone (Port Said, Ismailia and Suez)
- T he rural/industrial Delta (Damietta, Daqahlia, Kafr al-Sheikh, Beheira, Munfia, Gahrbia and Sharkia)
- T he mostly rural Upper Egypt (Fayoum, Beni Sweif, Minya, Assuit, Sohag, Qena, Luxor and Aswan)
- The sparsely populated desert Frontier (Matruh, Wadi al-Gadid, Red Sea, North Sinai and South Sinai).
Administrative Divisions; Existing Built Environment and New Cities
There is an administrative distinction at the sub-national level particular to Egypt. Within the 27 sub-national governorates, Egypt has a dual local administrative structure. There are mainstream local administrations, or municipalities, that manage over 200 cities and 4000 villages where over 98 percent of Egyptians live.[13] This we have termed the Existing Built Environment (Existing BE). And then there are the 31 so-called New Cities that have been built and run by the New Urban Communities Authority (NUCA), a public corporation administered at the national level by the Ministry of Housing, Utilities and Urban Development (MoH). These are referred to simply as New Cities.
1.3 Expenditure Data, Sources and Government Agencies’ Information
The BE Budget has focused only on public investments allocated to built environment projects outlined in the sectors presented in Chapter 6 of the General State Budget and other documents,. This means that the rest of the expenditure budget line items are omitted.[14]
Given that the General State Budget is not published in a programs budget format, only planned allocations of Chapter 6, Investments, are relevant to this study. This allocation is concerned with investments directed to construction or developing infrastructure across sectors.
These figures provide a picture of how the government plans to spend public money on economic and social development programs, and do not reveal actual spending or information on accessibility of services.
The project has gathered this information through three main data sources all of which were published online, excluding the Official Gazette documents as explained below;
- Mainstream budget documents released by the Ministry of Finance (MoF) and Offical Gazette,[15]
- Programmatic and geographic spending as outlined in the Ministry of Planning’s (MoP) Economic and Social Development Plan,[16]
- Agency specific budgets, in this case NUCA’s budget documents.[17]
Public Budget: Central administration, Local administration and Services authorities – (MoF)
The General State Budget provides economic expenditure allocations across three divisions of government: Central Administration, Local Administration and Services Authorities. Only Central Administration and Services Authorities’ documents are relevant for this study. Data for the relevant sectors of the Built Environment Budget is found through the sectoral sections of the MoF: Economic Affairs Sector, Environment Protection Sector and Housing & Public Infrastructure Sector.
Economic Entities’ Budgets – (MoF – Offical Gazette)
The Offical Gazette provides the budgets for Economic Entities: publicly owned corporations. Offical Gazette documents can be accessed through an e-mail mailing list with a paid membership. Seven economic entities are relevant for this study.
Economic and Social Development Plan – (MoP)
The ministry of planning publishes the government’s Economic and Social Development Plan annually. This outlines investments across all sectors in some detail. The Housing and Public Infrastructure Sector information in Part 4; Social Equality, Electricity Sector and Transportation Sector in Part 5; Economic Development, local spending of some of the aforementioned sectors were found in Part 6. There is also information on Spatial Development and the Appendices tables.[18]
Economic Agencies’ information published online (NUCA only)
NUCA publishes programmatic investment plans on its website whereas the MoF and Offical Gazette only publish an accounting budget. The plans can be found for FYs 2012/2013 to 2015/2016 in presentation slide format.
1.4 Data Organization and Results
Data Entry
There are three data entry files for each data source:
- MoF data entry consists of subsidy, investments, public spending and total expenditure for central administration and services authorities for eight-year periods. It also consists of information on economic entities, spending, investment, total capital investment and total budget for eight-year periods.
- MoP data entry file contains data for one financial year. It consists of all relevant tables from relevant parts of the economic and social development plan.
- NUCA data entry file contains two sheets for each financial year from 2012/2013 to 2015/2016. Each sheet consists of new urban cities project investments for each new city across different sectors.
Results
The Built Environment Budget data is presented as a current spatial distribution of built environment projects by sector, government agencies, regional and local projects, and New Cities and the Existing BE.
1.4.1 Sectors and Sub sectors
Table 7 below provides the built environment categorization, sectors and underlying projects, and the government agencies relevant to each as provided in the results. This table is created through the Spatial Distribution data from the Ministry of Planning.
Table 7: Budget classification of sources by government agency
| Spatial Distribution | Sector | Project | Government Agency | Budget Classification | ||
| Regional Projects | Roads and Transport | National Roads and Bridges | Central Agency for Construction (CAC) | General State Budget – Services Authority | ||
| General Authority for Roads, Bridges and Land Transport (GARBaLT) | General State Budget – Services Authority | |||||
| Railways | Egyptian National Railways (ENR) | Economic Entity (exclusive to the General State Budget) | ||||
| Electricity | Power Stations and Grid | Egypt Electricity Holding Company (EEHC) | Holding Company* (exclusive to the General State Budget) | |||
| Local Projects | Existing Built Environment | Water & Waste-water | Treatment Stations & Networks | National Organisation for Potable Water and Sanitary Drainage (NOPWASD) | General State Budget – Services Authority | |
| Construction Authority for Potable Water and Wastewater (CAPW) | General State Budget – Central Administration | |||||
| Ministry of Housing, Utilities and Urban Development | General State Budget – Central Administration | |||||
| Roads & Transport | Local Roads and Bridges | General Authority for Roads, Bridges and Land Transport (GARBaLT) | General State Budget – Services Authority | |||
| Governorates’ Offices | General State Budget – Local Municipalities | |||||
| Central Agency for Construction (CAC) | General State Budget – Central Administration | |||||
| Underground Metro | National Authority for Tunnels (NAT) | General State Budget – Services Authority | ||||
| Public Buses | Cairo Transport Authority (CTA) | Economic Entity (exclusive to the General State Budget) | ||||
| Alexandria Public Transport Authority (APTA) | ||||||
| Housing | Social Housing Programme | Ministry of Housing/ Social Housing Fund (SHF) | General State Budget – Central Administration | |||
| Guarantee and Subsidy Fund (GSF) | General State Budget – Services Authority | |||||
| Cooperative Housing Programme | General Authority for Cooperative Construction and Housing (GACCH) | Economic Entity (exclusive to the General State Budget) | ||||
| Other Housing projects (undefined allocations) | Ministry of Housing | General State Budget – Central Administration | ||||
| Central Agency for Construction (CAC) | General State Budget – Services Authority | |||||
| Electricity | Local Networks | Central Agency for Construction (CAC) | General State Budget – Services Authority | |||
| Governorates’ Offices | General State Budget – Local Municipalities | |||||
| Urban Development | 1000 Most Needy Villages Project | Central Agency for Construction (CAC) | General State Budget – Central Administration | |||
| Governorates’ Offices | General State Budget – Local Municipalities | |||||
| Informal Areas Development | Informal Settlements Development Facility (ISDF) | General State Budget – Services Authorities | ||||
| Integrated Urban Development | Central Agency for Construction (CAC) | General State Budget – Central Administration | ||||
| New Cities | Water & Waste-water | Treatment Stations & Networks | New Urban Communities Authority (NUCA) | Economic Entity (Exclusive to General State Budget) | ||
| Roads & Transport | Local Roads | New Urban Communities Authority (NUCA) | Economic Entity (Exclusive to General State Budget) | |||
| Electricity | Local Networks | New Urban Communities Authority (NUCA) | Economic Entity (Exclusive to General State Budget) | |||
| Housing | Social Housing Programme | New Urban Communities Authority (NUCA) | Economic Entity (Exclusive to General State Budget) | |||
| Middle Income Housing/ Dar Masr | New Urban Communities Authority (NUCA) | Economic Entity (Exclusive to General State Budget) | ||||
1.4.2 Spatial Distribution
This format utilizes data published by the ministry of planning relating to all the governorates. It includes sectors, government agencies for each sector and the Built Environment categorizations. This data is available for the current financial year 2015/2016 only.
2. Spending by Agency
14 agencies in four ministries and 27 governorates invest in the built environment (Table 8). The largest investor by far was the Ministry of Housing, Utilities and Urban Communities (MoH) with a little over half the budget. The second largest investor was the Ministry of Electricity at a quarter of the budget, followed by the Ministry of Transport with a share of less than 20%. The governorates and Ministry of Local Development administer less than 4% of the built environment budget.
The Ministry of Housings’ New Urban Communities Authority made the largest investments by agency at almost a third of the budget. It was followed by the Ministry of Electricity’s Egypt Electricity Holding Company, with investments equal to a quarter of the budget. This in turn was followed by the MoH’s Social Housing Fund at 11% of the built environment budget. The smallest investor was the MoH’s Guarantee & Subsidy Fund (GSF), at one million EGP, or 0.01% of the budget. However it is worth noting that the GSF’s main activity is funding the subsidy component of the Social Housing Programme’s mortgage units, for which it has allocated 1.5 Bn EGP in FY 2015/16.[19]
In terms of sectoral involvement, the MoH was the only ministry to invest in all six built environment sectors, specifically through it’s New Urban Communities Authority, which was the only agency to do so.[20] The Central Agency for Construction (part of the MoH) and the offices of the governorates were the only agencies to invest in three of the built environment sectors each, with the rest of the agencies only investing in one or two sectors.
Table 8: Agency budget by sector (‘000s EGP)
| Sector | Electricity | Transport | Housing | Waste-water | Water | Other/ Urban Develop. | Total | |
| Ministry of Housing, Utilities & Urban communities | New Urban Communities Authority | 2,391,890 | 2,713,394 | 11,978,225 | 5,107,087 | 2,591,087 | 5,000,000 | 29,781,683 |
| Central Agency for Construction |
47,500 | 1,838,000 | 229,500 | 0 | 0 | 163,000 | 2,278,000 | |
| Office of the ministry | 0 | 0 | 25,000 | 41,100 | 49,150 | 0 | 115,250 | |
| Social Housing Fund | 0 | 0 | 10,970,000 | 0 | 0 | 0 | 10,970,000 | |
| Guarantee & Subsidy Fund | 0 | 0 | 1,000 | 0 | 0 | 0 | 1,000 | |
| General Authority for Cooperative Construction and Housing | 0 | 0 | 103,500 | 0 | 0 | 0 | 103,500 | |
| Informal Settlements Development Facility | 0 | 0 | 0 | 0 | 0 | 685,840 | 685,840 | |
| Construction Authority for Potable Water and Wastewater | 0 | 0 | 0 | 1,694,465 | 686,635 | 0 | 2,381,100 | |
| National Organisation for Potable Water and Sanitary Drainage | 0 | 0 | 0 | 3,017,567 | 1,935,932 | 0 | 4,953,499 | |
| Sub-total | 2,439,390 | 4,551,394 | 23,307,225 | 9,860,219 | 5,262,804 | 5,848,840 | 51,269,872 | |
| Ministry of Electricity | Egypt Electricity Holding Company | 25,303,400 | 0 | 0 | 0 | 0 | 0 | 25,303,400 |
| Ministry of Transport | General Authority for Roads, Bridges and Land Transport | 0 | 7,635,000 | 0 | 0 | 0 | 0 | 7,635,000 |
| National Authority for Tunnels | 0 | 4,059,800 | 0 | 0 | 0 | 0 | 4,059,800 | |
| Egyptian National Railways | 0 | 6,840,000 | 0 | 0 | 0 | 0 | 6,840,000 | |
| Sub-total | 0 | 18,534,800 | 0 | 0 | 0 | 0 | 18,534,800 | |
| Local Admin. | Offices of the governorates | 560,614 | 2,109,880 | 0 | 0 | 0 | 95 ,042 | 2,765,536 |
| Cairo Transport Authority | 0 | 177,735 | 0 | 0 | 0 | 0 | 177,735 | |
| Alexandria Public Transport Authority | 0 | 185,000 | 0 | 0 | 0 | 0 | 185,000 | |
| Sub-total | 560,614 | 2,472,615 | 0 | 0 | 0 | 95,042 | 3,128,271 | |
| Ministry of Local Development | Office of the ministry | 0 | 0 | 0 | 0 | 0 | 650,000 | 650,000 |
| Total | 28,303,404 | 25,558,809 | 23,307,225 | 9,860,219 | 5,262,804 | 6,593,882 | 98,886,343 | |
| Sector | Electricity | Transport | Housing | Waste-water | Water | Other/ Urban Develop. | Total | |
3. Spending by Regional or Local Projects
This section gives an overview of public spending on the built environment in Egypt, based on sectoral totals at the National level, as well as comparing spending by administrative division; National spending; projects that cross sub-national borders and that could not be isolated at the sub-national level such as national highways, rail-roads and electricity generation and grids; and sub-national governorate level spending on locally identified projects. This section also analyses the further administrative distinction at the sub-national level particular to Egypt, where sub-national spending is divided and compared between the dual local administrative structures of the Existing Built Environment (BE), and the New Cities.[21]
Total Spending
Spending on the six built environment sectors totaled 98.9 Bn EGP (Table 9). When sub-divided administratively, over 40% of the Built Environment Budget for FY 2015/16 is spent on projects with National reach: power stations and networks, railroads and highways. Second comes spending on New Cities, which are administratively separate from existing local administration, where 30% of the budget is spent. This spending is mostly for real estate investments where new subdivisions are prepared and sold, as well as spending on both for profit housing schemes and public housing within the New Cities. Only two percent of the population benefits from this spending. In third place, at 29% of the budget, comes spending on the Existing BE where 98% Egyptians live. Of this portion, a mere 13.3 percent is actually spent through the local administration. The rest is controlled by central ministries.
Table 9: Total spending on the BE by sector and administration
| Sector | Local Projects | Regional Projects | Total | |||||
| Existing BE | New Cities | |||||||
| ‘000s EGP | % | ‘000s EGP | % | ‘000s EGP | % | ‘000s EGP | % | |
| Electricity | 608,114 | 2.1% | 2,391,890 | 8.5% | 25,303,400 | 89.4% | 28,303,404 | 28.6% |
| Transport | 7,477,415 | 29.3% | 2,713,394 | 10.6% | 15,368,000 | 60.1% | 25,558,809 | 25.8% |
| Housing | 11,329,000 | 48.6% | 11,978,225 | 51.4% | 0 | 0.0% | 23,307,225 | 23.6% |
| Waste-water | 4,753,132 | 48.2% | 5,107,087 | 51.8% | 0 | 0.0% | 9,860,219 | 10.0% |
| Urban Dev. | 1,593,882 | 24.2% | 5,000,000 | 75.8% | 0 | 0.0% | 6,593,882 | 6.7% |
| Water | 2,671,717 | 50.8% | 2,591,087 | 49.2% | 0 | 0.0% | 5,262,804 | 5.3% |
| Total | 28,433,260 | 28.8% | 29,781,683 | 30.1% | 40,671,400 | 41.1% | 98,886,343 | 100.0% |
Total Per Capita Spending
Total BE spending translated to a national per capita spending of 1098 EGP per person (Table 10). Per capita spending fluctuated greatly between the different administrative divisions, where spending on New Cities was highest at 15,537 EGP per person, or about 15 times the national average. This was followed by National projects at 451 EGP per person, and then the Existing BE at 322 EGP per person, or about a third of the national average.
Table 10: Per capita spending on the BE by sector and administration
| Sector | Local Projects | Regional Projects | Total | |||||
| Existing BE | New Cities | |||||||
| ‘000s EGP | EGP/ pax | ‘000s EGP | EGP/ pax | ‘000s EGP | EGP/ pax | ‘000s EGP | EGP/pax | |
| Electricity | 608,114 | 7 | 2,391,890 | 1248 | 25,303,400 | 281 | 28,303,404 | 314 |
| Transport | 7,477,415 | 85 | 2,713,394 | 1416 | 15,368,000 | 171 | 25,558,809 | 284 |
| Housing | 11,329,000 | 128 | 11,978,225 | 6249 | 0 | 0 | 23,307,225 | 259 |
| Waste-water | 4,753,132 | 54 | 5,107,087 | 2664 | 0 | 0 | 9,860,219 | 109 |
| Urban Dev. | 1,593,882 | 18 | 5,000,000 | 2608 | 0 | 0 | 6,593,882 | 73 |
| Water | 2,671,717 | 30 | 2,591,087 | 1352 | 0 | 0 | 5,262,804 | 58 |
| Total | 28,433,260 | 322 | 29,781,683 | 15,537 | 40,671,400 | 451 | 98,886,343 | 1098 |
Total Per Capita Spending on the Sub-national Level
Looking only at the sub-national Built Environment Budget (only Existing BE and the New Cities) and dividing it by the total population produces an average per capita spending of 1140 EGP per person across the governorates. However, spending is very uneven (fig 4). Almost all Delta and Upper Egyptian governorates fall below the national average with Daqahlia receiving almost a tenth of the average. On the other hand only five governorates received near average spending. Cairo received almost double the average spending, and the Frontier governorates were all much higher than average, a fact emphasised by their very small populations. Matruh for example receiving five and a half times the national average spending. This is possibly explained by these governorates’ importance to the tourism sector.
Per Capita Spending on the Existing BE
Isolating spending on only the Existing BE shows an average per capita spending of 322 EGP per person, or about a third of the national average from the total BE Budget. Only seven governorates received spending close to that average (fig 5): Qalubia in Greater Cairo; Alexandria, Egypt’s second largest city; Damietta, a largely urban governorate; Munufia in the Delta, and Luxor and Aswan, the two tourism oriented governorates in Upper Egypt. By contrast, most Delta and Upper Egyptian governorates received less than average spending. Meanwhile urban governorates such as Cairo, Port Said and Suez received double to triple the average spending, while the frontier governorates’ per capita spending was between 6 to 16 times the national average, possibly because of their very small populations as well as being important for tourism.
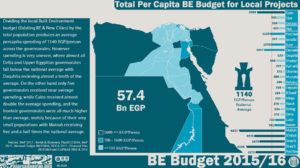
Fig. 4: Total sub-national per capita spending on local projects

Fig. 5: Sub-national per capita spending on local projects in the Existing BE
Table 11: Calculating per capita expenditure for the New Cities in each governorate
| Regions | Gov | Population | Investments (‘000 EGP) | Per Capita (EGP/person) | |||
| Egypt | New Cities | Based on NC pop | Based on Gov pop | Based on NC/Gov pop | |||
| Grater Cairo | Cairo | 9,440,374 | 550,825 | 13,637,431 | 24,758 | 1445 | 24,758 |
| Giza | 7,762,792 | 506,318 | 3,348,231 | 6,613 | 431 | 6,613 | |
| Qalubia | 5,215,446 | 107,462 | 1,058,164 | 9,847 | 203 | 9,847 | |
| Alex. | Alexandria | 4,901,910 | 98,305 | 877,516 | 8,926 | 179 | 8,926 |
| Suez Canal | Port Said | 678,564 | 0 | 5,000 | 0 | 7 | 7 |
| Ismailia | 1,209,663 | _ | _ | _ | _ | _ | |
| Suez | 636,841 | 0 | 73,200 | 0 | 115 | 115 | |
| Delta | Damietta | 1,359,643 | 64,291 | 1,500,200 | 23,334 | 1103 | 23,334 |
| Daqahlia | 6,074,446 | _ | _ | _ | _ | _ | |
| Sharkia | 6,640,664 | 354,947 | 3,477,174 | 9,796 | 524 | 9,796 | |
| Kafr al-Sheikh | 3,249,268 | _ | _ | _ | _ | _ | |
| Gharbia | 4,852,968 | _ | _ | _ | _ | _ | |
| Munfia | 4,035,137 | 68,554 | 479,706 | 6,998 | 119 | 6,998 | |
| Beheira | 5,959,050 | 99,444 | 82,738 | 832 | 14 | 832 | |
| Upper Egypt | Fayoum | 3,280,103 | 0 | 58,848 | 0 | 18 | 18 |
| Beni Sweif | 2,943,740 | 45,314 | 165,623 | 3,655 | 56 | 3,655 | |
| Minya | 5,309,254 | 11,647 | 509,600 | 43,752 | 96 | 43,752 | |
| Assiut | 4,364,111 | 4,462 | 700,065 | 156,906 | 160 | 160 | |
| Sohag | 4,734,676 | 144 | 539,341 | 0 | 114 | 114 | |
| Qena | 3,128,194 | 0 | 498,336 | 0 | 159 | 159 | |
| Luxor | 1,173,753 | 5,134 | 318,850 | 62,111 | 272 | 272 | |
| Aswan | 1,466,965 | 0 | 447,660 | 0 | 305 | 305 | |
| Frontier | Matruh | 468,218 | 0 | 1,999,000 | 0 | 4269 | 4,269 |
| Wadi al-Gadid | 230,591 | 0 | 5,000 | 0 | 22 | 22 | |
| Sinai N | 445,811 | _ | _ | _ | _ | _ | |
| Sinai S | 169,822 | _ | _ | _ | _ | _ | |
| Red Sea | 354,263 | _ | _ | _ | _ | _ | |
| Total | 90,086,267 | 1,916,846 | 29,781,683 | 17,876 | 481 | 7,198 | |
Per Capita Spending on New Cities
Gross per capita spending on New Cities amounted to 15,537 EGP per person, or about 15 times the national average.[22] Cairo governorate received the highest spending by NUCA (13.6 Bn EGP, or 46% of NUCA’s budget), that spending translated to 24,758 EGP per person based on population in its New Cities, and 1445 EGP per person based on Cairo’s total population (Table 11). This makes it the second highest per capita spending after Minya, which had per capita spending of 43,752 EGP per person, even though actual spending was only 510 Mn EGP, or about 1.7% of NUCA spending.
Total Governorate Level Spending to Population Ratio
When viewed as a ratio between spending and population, only six governorates were within the 1:1 ratio (0.8 to 1.2) (Table 12). Most Delta and Upper Egyptian governorates were below, ranging between a high of 0.6 for Assiut, Qena and Munfia, and a low of 0.2 for Daqahlia. Meanwhile almost all urban governorates were higher: between 1.7 for Suez and Port Said, to 3.2 for Cairo with the highest share of spending at 21% of the budget for 10.1% of the population. The exception was Alexandria, which was a low 0.7. Frontier governorates all had very high spending to population ratios, ranging from 2.9 for North Sinai, to a staggering 9.8 for Matruh.
Existing BE Governorate Level Spending to Population Ratio
When governorate level spending is isolated to show only spending on Existing BE, only three governorates, Qalubeya, Alexandria and Mufia are near a 1:1 ratio (Table 12). Again, almost all Delta and Upper Egyptian governorates are below that, ranging from a high of 0.7 for most, to a low of 0.4 for Daqahlia. Once again we see also that only Damietta in the Delta, and Luxor and Aswan in Upper Egypt were higher than 1, all receiving 1.5 times more spending than their population. Urban governorates were also much higher than 1, with Cairo, Suez and Port Said at 2.1, 3 and 3.5 times respectively. Alexandria was the exception at only 0.8. Frontier governorates all ranged from a low of 6 for North Sinai, to an overall high of 17 for South Sinai.
New Cities’ Governorate Level Spending to Population Ratio
New City spending ignored local governorate populations even more. Only two governorates received near 1:1 spending, Luxor and Aswan at 0.8 and 0.9 respectively, while the rest of the Upper Egyptian New Cities received spending of between 0.1 in Fayoum to 0.5 in Qena and Assuit (Table 12). Cairo was the highest of the Urban Governorates at 4.4, while Giza was 1.3 and Alexandria a mere 0.5. Most Delta governorates do not have New Cities, but the ones that do received between less than 0.1 for Beheira, and 3.3 for Damietta. 2015/16 is also the first year where one of the Frontier governorates will have a New City. New Alamein is a New City in Matruh, which will lead the governorates with a 12.9 spending to population ratio
Table 12: Spending to population ratios per governorate and administration
| Region | Gov | Total BE | New Cities | Existing BE | |
| Grater Cairo | Cairo | 3.2 | 4.4 | 2.1 | |
| Giza | 0.9 | 1.3 | 0.6 | ||
| Qalubia | 0.8 | 0.6 | 1.0 | ||
| Alex. | Alexandria | 0.7 | 0.5 | 0.8 | |
| Suez Canal | Port Said | 1.7 | 0.0 | 3.5 | |
| Ismailia | 0.8 | _ | 1.6 | ||
| Suez | 1.7 | 0.3 | 3.0 | ||
| Delta | Damietta | 2.4 | 3.3 | 1.5 | |
| Daqahlia | 0.2 | 0.0 | 0.4 | ||
| Sharkia | 1.0 | 1.6 | 0.5 | ||
| Kafr al-Sheikh | 0.4 | _ | 0.7 | ||
| Gharbia | 0.3 | _ | 0.5 | ||
| Munfia | 0.6 | 0.4 | 0.9 | ||
| Beheira | 0.3 | 0.0 | 0.5 | ||
| Upper Egypt | Fayoum | 0.4 | 0.1 | 0.7 | |
| Beni Sweif | 0.4 | 0.2 | 0.7 | ||
| Minya | 0.4 | 0.3 | 0.5 | ||
| Assiut | 0.6 | 0.5 | 0.7 | ||
| Sohag | 0.5 | 0.3 | 0.7 | ||
| Qena | 0.6 | 0.5 | 0.6 | ||
| Luxor | 1.1 | 0.8 | 1.5 | ||
| Aswan | 1.2 | 0.9 | 1.5 | ||
| Frontier | Matruh | 9.8 | 12.9 | 6.3 | |
| Wadi al-Gadid | 3.6 | 0.1 | 7.2 | ||
| Sinai N | 2.9 | _ | 6.0 | ||
| Sinai S | 8.4 | _ | 17.0 | ||
| Red Sea | 3.4 | _ | 6.9 | ||
| Average | 1.8 | 1.4 | 2.5 | ||
Governorate Level Spending on New Cities versus Existing BE
Over half (51.9%) of the local BE budget was spent on New Cities (Fig 6). In some governorates, spending on New Cities was almost triple the spending on their existing BE where most of their populations live. For example in Sharkia, Giza, Damietta and Cairo, the government designated 79.4%, 72.5%, 71.3% and 70.1% respectively of their local spending on their New Cities. By contrast, the lowest rate was in Fayoum at 7.7%. Port Said, Suez and the New Valley were even lower. However this is the first year they receive funds to build New Cities, while another seven governorates do not have a New City programme.
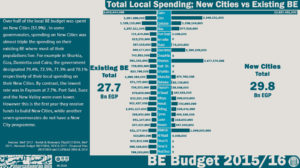
Fig. 6: Total local spending; New Cities versus the Existing BE
4. Spending by Sector
Six sectors were chosen to represent spending on the built environment in Egypt: Transport; Electricity; Water; Waste-water; Housing, and Urban Development. This section analyses overall spending on a sector-by-sector basis, as well as the administrative shares between National and Sub-national sectors. The section also analyses the spatial equality of sub-national sectors as the per capita share of each governorate in each sector, as well as comparing spending in the Existing BE with spending on New Cities.
Total Sectoral Spending
Egypt’s total built environment budget for FY 2015/16 was 98.9 Bn EGP. The highest spending was on electricity (mostly power stations), where 29% of the budget is allocated (fig. 7). Transport, including National highways and railroads, is second at 26% of the budget. Housing projects for both social and middle income housing are third with almost a quarter of the budget. Spending on waste-water infrastructure accounted for 10%. 6.6 % was spent on Urban Development (projects that include more than one sector), where most of it was for the New Administrative Capital in Cairo (5%), while the rest were designated for Informal Area Upgrading and the Most Needy Villages programmes. Finally, about 5.3% went to drinking water plants and networks.
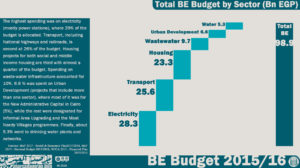
Fig. 7: Total BE Budget by sector
Per Capita Sectoral Spending
In per capita terms, the national share for built environment projects ranged from 314 EGP per person, for electricity projects, to 18 EGP per person for urban development projects (Table 13). When isolated on the sub-national level for the Existing BE, per capita spending ranges from 128 EGP per person for housing projects, to 7 EGP for electricity (local networks). On the other hand in New Cities, per capita spending ranges from a high of 6249 EGP per person for housing projects, which include the profitable Dar Masr, to 1352 EGP per person for projects in the water sector.
Table 13: Total and per capita sectoral spending
| Sector | Local Projects | Regional Projects | Total | |||||
| Existing BE | New Cities | |||||||
| ‘000s EGP | EGP/ pax | ‘000s EGP | EGP/ pax | ‘000s EGP | EGP/ pax | ‘000s EGP | EGP/pax | |
| Electricity | 608,114 | 7 | 2,391,890 | 1248 | 25,303,400 | 281 | 28,303,404 | 314 |
| Transport | 7,477,415 | 85 | 2,713,394 | 1416 | 15,368,000 | 171 | 25,558,809 | 284 |
| Housing | 11,329,000 | 128 | 11,978,225 | 6249 | 0 | 0 | 23,307,225 | 259 |
| Waste-water | 4,753,132 | 54 | 5,107,087 | 2664 | 0 | 0 | 9,860,219 | 109 |
| Urban Dev. | 1,593,882 | 18 | 5,000,000 | 2608 | 0 | 0 | 6,593,882 | 73 |
| Water | 2,671,717 | 30 | 2,591,087 | 1352 | 0 | 0 | 5,262,804 | 58 |
| Total | 28,433,260 | 322 | 29,781,683 | 15,537 | 40,671,400 | 451 | 98,886,343 | 1098 |
Total Sectoral Spending on Local Projects
The leading expenditure in both New Cities and Existing BE is housing, representing 40% of the BE Budget (fig 8). In New Cities over half of the budget is for the profitable Dar Masr project. Both administrative systems spend approximately the same amounts on Waste Water and Water at around 17% and 9% respectively. However, expenditure on transport is much higher in the Existing BE, though most of it goes to the underground metro in one city, Cairo. In urban development 17% of the New Cities’ budget is allocated to one project; the New Administrative Capital in Cairo, compared to 5% of the Existing BE budget that goes to slum and village upgrading.
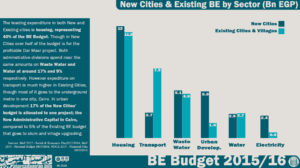
Fig. 8: Spending in New Cities and the Existing BE by sector
For more information on each sector click on the following links
5. Conclusions and Recommendations
There are two main conclusions that can be drawn from the analysis of the Built Environment Budget for FY 2015/16. The first is the stark administrative inconsistency in investing in and managing the built environment. The work of 12 national agencies in four ministries, 2 sub-national agencies and 27 governorates largely overlaps, while the strict duality between New Cities and the Existing BE has created an exclusivity of urban development that ignores the local needs.
The other main conclusion is that information on the budget has been both extremely hard to gather, and very time consuming to analyse. Over 30 documents and almost one hundred tables from three main data sources were digitised and analysed. Sub-national spending was also not publicly available for most sectors. This is a regression from previous years, which required a special request to the Ministry of Planning to acquire the information.
5.1 Spatial In-equality of Sectoral Spending in the Existing BE
On the local Existing BE level, our analysis has shown a wide spectrum of per capita spending in each governorate and in each sector. The Frontier region received the highest per capita expenditure in all six sectors (Table 21). This is partially explained by their far below average population sizes. The tourism-oriented South Sinai received the most spending per capita in four out of the six sectors. In contrast, in neighbouring North Sinai, which has been the scene of armed conflict, investments ranged from above average to below average.
The Suez Canal region came second overall in per capita spending, with generally above average per capita spending throughout. Port Said led the region in two out of the six sectors, Suez received high above average spending in two sectors, and Ismailia in one.
Greater Cairo was third among the regions in per capita spending, and spending was generally below average. Qalubia led the region in two out of the six sectors, though with below average spending in the other four. Cairo received far above average spending on Transport, coming in second overall, below South Sinai. Giza received consistently below average spending in all six sectors.
Upper Egypt came in fourth with an overall per capita spending of 35% the national average as most per capita spending was below and well below average across the sectors. There was a large disparity within the region. Both Aswan and Luxor, the two tourism oriented governorates, received the highest per capita spending among the region in two sectors each. Spending on Social Housing and Water in Aswan was twice the national average. Fayoum, Minya and Qena all received less than average spending in five out of the six sectors.
Alexandria, an urban governorate and Egypt’s second largest city, surprisingly came in next to last amongst the regions in per capita spending, with consistently below average per capita spending across all six sectors.
The Delta was the region with the least per capita spending at 29% of the average overall per capita share. There was some regional disparity as Damietta, a largely urban governorate and port city received the highest per capita spending in four out of the six sectors. In three of those, spending was high above the national average. Munfia was a distant second with average to above average spending in three out of the six sectors. In contrast, spending was below or well below average in the remaining five Delta governorates.
Table 21: Per capita spending in the Existing BE by sector and governorate
| Regions | Governorates | Existing BE | ||||||
| Electricity | Transport | Social Housing | Waste-water | Water | Urban Develop. | Average | ||
| Grater Cairo | Cairo | 4 | 487 | 71 | 47 | 18 | 27 | 109 |
| Giza | 4 | 62 | 49 | 42 | 16 | 1 | 29 | |
| Qalubia | 3 | 24 | 100 | 127 | 59 | 0 | 52 | |
| Alex. | Alexandria | 2 | 66 | 96 | 68 | 22 | 7 | 44 |
| Suez Canal | Port Said | 25 | 114 | 755 | 80 | 30 | 104 | 185 |
| Ismailia | 20 | 40 | 268 | 94 | 74 | 10 | 84 | |
| Suez | 40 | 16 | 644 | 225 | 5 | 7 | 156 | |
| Delta | Damietta | 5 | 34 | 237 | 141 | 49 | 0 | 78 |
| Daqahlia | 3 | 22 | 59 | 21 | 17 | 0 | 20 | |
| Sharkia | 1 | 40 | 53 | 23 | 26 | 0 | 24 | |
| Kafr al-Sheikh | 3 | 55 | 94 | 51 | 16 | 7 | 38 | |
| Gharbia | 3 | 16 | 74 | 57 | 19 | 2 | 29 | |
| Munfia | 4 | 16 | 129 | 85 | 40 | 0 | 46 | |
| Beheira | 1 | 11 | 91 | 29 | 16 | 0 | 25 | |
| Upper Egypt | Fayoum | 6 | 22 | 140 | 23 | 23 | 0 | 36 |
| Beni Sweif | 8 | 24 | 124 | 55 | 11 | 10 | 39 | |
| Minya | 6 | 16 | 59 | 33 | 27 | 16 | 26 | |
| Assiut | 13 | 26 | 107 | 33 | 36 | 3 | 36 | |
| Sohag | 5 | 33 | 97 | 26 | 51 | 7 | 37 | |
| Qena | 10 | 20 | 100 | 43 | 15 | 4 | 32 | |
| Luxor | 10 | 149 | 262 | 35 | 5 | 1 | 77 | |
| Aswan | 16 | 36 | 278 | 109 | 25 | 11 | 79 | |
| Frontier | Matruh | 141 | 367 | 667 | 387 | 329 | 76 | 328 |
| Wadi al-Gadid | 85 | 208 | 1,399 | 155 | 178 | 230 | 376 | |
| Sinai N | 74 | 247 | 1,233 | 33 | 64 | 224 | 313 | |
| Sinai S | 164 | 588 | 3,716 | 194 | 648 | 27 | 889 | |
| Red Sea | 0 | 235 | 1,177 | 135 | 195 | 430 | 362 | |
| Average | 7 | 85 | 128 | 54 | 30 | 18 | 54 | |
5.2 Spatial Inequality of Sectoral Spending in New Cities
There was regional disparity in per capita spending on New Cities. A single city, New Alamein in Matruh, raised the Frontier governorates to the top of the six regions (Table 22). That is despite very modest spending in Wadi al-Gadid and no New City programmes in the remaining three Frontier governorates. Overall, Matruh received the highest per capita spending amongst all the governorates in four out of the six sectors, with no spending on Social Housing or Urban Development.
Greater Cairo received the second highest per capita spending. Were it not for the anomaly of high spending on New Alamein, it would have been NUCA’s top region by far, at 2.6 times higher per capita spending than the next region down (Alexandria). Cairo itself led spending in five out of the six sectors, and had the most and only spending on Urban Development: a lump sum designated to the New Administrative Capital. Giza was second with around average spending and at a mere 30% of the spending on Cairo, while Qalubia received consistently below average spending across the sectors at barely 10% of Cairo spending.
Alexandria had the third highest per capita investments, all in one city, New Borg al-‘Arab, though generally below average across the sectors.
The Delta came fourth in per capita investments. This, even though it is home to five New Cities in four of its seven governorates. Sharkia was top of the region overall, leading in four out of six sectors regionally, and in one sector, Social Housing, nationally. Overall per capita spending in Sharkia was 2.7 times higher than the next governorate down, Damietta, and a full 32.5 times more than the governorate with the least per capita spending in the region and nationally, Beheira.
Upper Egypt trailed the Delta by a small margin, despite the fact that all its eight governorates are home to 11 New Cities, including three of which are still under construction. Aswan received the highest per capita spending by far, and led in three out of the six sectors. Luxor was a very close second, while Beni Sweif and Fayoum trailed the region. The latter received 6% of the per capita share of Aswan.
The Suez Canal region understandably had the least per capita spending as it is the first year of construction for East Port Said and North Suez, in Port Said and Suez respectively.
Table 22: Per capita spending in New Cities by sector and governorate
| Regions | Governorates | New Cities | ||||||
| Electricity | Transport | Social Housing | Waste-water | Water | Urban Develop. | Average | ||
| Grater Cairo | Cairo | 76 | 76 | 98 | 210 | 45 | 530 | 172 |
| Giza | 47 | 65 | 49 | 74 | 66 | 0 | 50 | |
| Qalubia | 10 | 18 | 38 | 14 | 20 | 0 | 17 | |
| Alex. | Alexandria | 26 | 20 | 46 | 76 | 11 | 0 | 30 |
| Suez Canal | Port Said | 1 | 1 | 0 | 2 | 2 | 0 | 1 |
| Ismailia | _ | _ | _ | _ | _ | _ | _ | |
| Suez | 12 | 8 | 0 | 84 | 11 | 0 | 19 | |
| Delta | Damietta | 12 | 23 | 44 | 14 | 50 | 0 | 24 |
| Daqahlia | _ | _ | _ | _ | _ | _ | _ | |
| Sharkia | 26 | 23 | 146 | 103 | 94 | 0 | 65 | |
| Kafr al-Sheikh | _ | _ | _ | _ | _ | _ | _ | |
| Gharbia | _ | _ | _ | _ | _ | _ | _ | |
| Munfia | 9 | 69 | 0 | 26 | 5 | 0 | 18 | |
| Beheira | 0 | 1 | 4 | 5 | 3 | 0 | 2 | |
| Upper Egypt | Fayoum | 6 | 5 | 2 | 2 | 3 | 0 | 3 |
| Beni Sweif | 9 | 12 | 10 | 15 | 11 | 0 | 9 | |
| Minya | 3 | 13 | 15 | 21 | 7 | 0 | 10 | |
| Assiut | 17 | 30 | 98 | 15 | 0 | 0 | 27 | |
| Sohag | 14 | 17 | 52 | 19 | 12 | 0 | 19 | |
| Qena | 8 | 32 | 71 | 23 | 25 | 0 | 27 | |
| Luxor | 60 | 15 | 134 | 57 | 5 | 0 | 45 | |
| Aswan | 68 | 50 | 127 | 33 | 26 | 0 | 51 | |
| Frontier | Matruh | 1,068 | 639 | 0 | 1,495 | 1,068 | 0 | 712 |
| Wadi al-Gadid | 4 | 4 | 0 | 7 | 7 | 0 | 4 | |
| Sinai N | _ | _ | _ | _ | _ | _ | _ | |
| Sinai S | _ | _ | _ | _ | _ | _ | _ | |
| Red Sea | _ | _ | _ | _ | _ | _ | _ | |
| Average | 74 | 56 | 47 | 115 | 74 | 26 | 65 | |
5.3 Recommendations
Administrative Restructuring towards Equitable and Needs-based Sub-national Investment
The spatial inequality revealed through the BE Budget for FY 2015/16 on both the regional and sub-regional levels, as well as across the dual administrative structures governing the Existing BE and New Cities, can only be addressed through massive administrative restructuring. Overall, none of these agencies implements projects directly. Their primary role is in coordinating and overseeing public or private specialised contractors. Therefore it is recommended that:
- Short Term Solutions: Local Plans & Improved Transparency
- Draw a yearly, comprehensive and needs-based socio-economic plan for each governorate
- Improve budget transparency and accessibility by releasing budget data by programme and disaggregated by governorate and city/village three months prior to FY
- Releasing Final Accounts data for each agency within three months of end of FY
- Medium to Long Term Solutions: Administrative Restructuring
- Central Government ministries should play a strictly monitoring vis-avis the national, regional and sub-national agencies’ performance, as well as governing standards and overseeing regional and sub-regional equity.
- National agencies in charge of regionally shared services such as rail-roads, regional highways, power stations and the national electricity grid should continue to operate that way (ENR and EEHC). Those that engage in both regional and local operations should be restructured to operate on one level or the other, but not both (CAC and GARBaLT).
- National agencies with strictly local operations should be redrawn across geographic rather than sectoral lines. Sub-national investments in all six sectors should be merged into five or six regional agencies with 27 local branches in order to streamline planning and implementation.
- The duality between New Cities and the Existing BE should also be merged at the local level to balance investments between needs based investment and real estate investments. These can then cross subsidise and support each other in a local and transparent manner.
Appendices
Appendix 1: Per capita expenditure on local projects for the total BE (New Cities & Existing BE) by governorate and sector (EGP/person)
| Regions | Gov | Total BE | ||||||
| Electricity | Transport | Social Housing | Waste-water | Water | Urban Develop. | Average | ||
| Grater Cairo | Cairo | 80 | 534 | 163 | 254 | 62 | 555 | 274 |
| Giza | 51 | 123 | 93 | 114 | 81 | 1 | 77 | |
| Qalubia | 12 | 42 | 136 | 138 | 78 | 0 | 68 | |
| Alex. | Alexandria | 28 | 85 | 141 | 142 | 33 | 7 | 73 |
| Suez Canal | Port Said | 26 | 115 | 755 | 82 | 32 | 104 | 186 |
| Ismailia | 20 | 40 | 253 | 94 | 74 | 10 | 82 | |
| Suez | 52 | 24 | 642 | 309 | 17 | 7 | 175 | |
| Delta | Damietta | 16 | 55 | 270 | 148 | 97 | 0 | 98 |
| Daqahlia | 3 | 22 | 59 | 21 | 17 | 0 | 20 | |
| Sharkia | 27 | 61 | 196 | 125 | 119 | 0 | 88 | |
| Kafr al-Sheikh | 3 | 55 | 94 | 51 | 16 | 7 | 38 | |
| Gharbia | 3 | 16 | 74 | 57 | 19 | 2 | 29 | |
| Munfia | 13 | 85 | 127 | 110 | 44 | 0 | 63 | |
| Beheira | 1 | 12 | 94 | 34 | 19 | 0 | 27 | |
| Upper Egypt | Fayoum | 12 | 27 | 143 | 25 | 27 | 0 | 39 |
| Beni Sweif | 16 | 35 | 132 | 69 | 21 | 10 | 47 | |
| Minya | 8 | 30 | 73 | 55 | 34 | 16 | 36 | |
| Assiut | 30 | 57 | 203 | 48 | 36 | 3 | 63 | |
| Sohag | 19 | 50 | 149 | 46 | 62 | 7 | 56 | |
| Qena | 18 | 52 | 169 | 67 | 40 | 4 | 58 | |
| Luxor | 71 | 164 | 395 | 92 | 10 | 1 | 122 | |
| Aswan | 85 | 86 | 372 | 142 | 52 | 11 | 124 | |
| Frontier | Matruh | 1,209 | 1,005 | 655 | 1,882 | 1,397 | 76 | 1,037 |
| Wadi al-Gadid | 90 | 213 | 1,329 | 162 | 184 | 230 | 368 | |
| Sinai N | 74 | 247 | 1,146 | 33 | 64 | 224 | 298 | |
| Sinai S | 164 | 588 | 3,616 | 194 | 648 | 27 | 873 | |
| Red Sea | 0 | 235 | 1,011 | 135 | 195 | 430 | 334 | |
| Average | 314 | 284 | 172 | 109 | 58 | 73 | 168 | |
Appendix 2: Per capita expenditure on local projects for the Existing BE by governorate and sector (EGP/person)
| Regions | Gov | Existing BE | ||||||
| Electricity | Transport | Social Housing | Waste-water | Water | Urban Develop. | Average | ||
| Grater Cairo | Cairo | 4 | 487 | 71 | 47 | 18 | 27 | 109 |
| Giza | 4 | 62 | 49 | 42 | 16 | 1 | 29 | |
| Qalubia | 3 | 24 | 100 | 127 | 59 | 0 | 52 | |
| Alex. | Alexandria | 2 | 66 | 96 | 68 | 22 | 7 | 44 |
| Suez Canal | Port Said | 25 | 114 | 755 | 80 | 30 | 104 | 185 |
| Ismailia | 20 | 40 | 268 | 94 | 74 | 10 | 84 | |
| Suez | 40 | 16 | 644 | 225 | 5 | 7 | 156 | |
| Delta | Damietta | 5 | 34 | 237 | 141 | 49 | 0 | 78 |
| Daqahlia | 3 | 22 | 59 | 21 | 17 | 0 | 20 | |
| Sharkia | 1 | 40 | 53 | 23 | 26 | 0 | 24 | |
| Kafr al-Sheikh | 3 | 55 | 94 | 51 | 16 | 7 | 38 | |
| Gharbia | 3 | 16 | 74 | 57 | 19 | 2 | 29 | |
| Munfia | 4 | 16 | 129 | 85 | 40 | 0 | 46 | |
| Beheira | 1 | 11 | 91 | 29 | 16 | 0 | 25 | |
| Upper Egypt | Fayoum | 6 | 22 | 140 | 23 | 23 | 0 | 36 |
| Beni Sweif | 8 | 24 | 124 | 55 | 11 | 10 | 39 | |
| Minya | 6 | 16 | 59 | 33 | 27 | 16 | 26 | |
| Assiut | 13 | 26 | 107 | 33 | 36 | 3 | 36 | |
| Sohag | 5 | 33 | 97 | 26 | 51 | 7 | 37 | |
| Qena | 10 | 20 | 100 | 43 | 15 | 4 | 32 | |
| Luxor | 10 | 149 | 262 | 35 | 5 | 1 | 77 | |
| Aswan | 16 | 36 | 278 | 109 | 25 | 11 | 79 | |
| Frontier | Matruh | 141 | 367 | 667 | 387 | 329 | 76 | 328 |
| Wadi al-Gadid | 85 | 208 | 1,399 | 155 | 178 | 230 | 376 | |
| Sinai N | 74 | 247 | 1,233 | 33 | 64 | 224 | 313 | |
| Sinai S | 164 | 588 | 3,716 | 194 | 648 | 27 | 889 | |
| Red Sea | 0 | 235 | 1,177 | 135 | 195 | 430 | 362 | |
| Average | 7 | 85 | 128 | 54 | 30 | 18 | 54 | |
Appendix 3: Per capita expenditure on local projects for New Cities by governorate and sector (EGP/person)
| Regions | Gov | New Cities | ||||||
| Electricity | Transport | Social Housing | Waste-water | Water | Urban Develop. | Average | ||
| Grater Cairo | Cairo | 76 | 76 | 98 | 210 | 45 | 530 | 172 |
| Giza | 47 | 65 | 49 | 74 | 66 | 0 | 50 | |
| Qalubia | 10 | 18 | 38 | 14 | 20 | 0 | 17 | |
| Alex. | Alexandria | 26 | 20 | 46 | 76 | 11 | 0 | 30 |
| Suez Canal | Port Said | 1 | 1 | 0 | 2 | 2 | 0 | 1 |
| Ismailia | _ | _ | _ | _ | _ | _ | _ | |
| Suez | 12 | 8 | 0 | 84 | 11 | 0 | 19 | |
| Delta | Damietta | 12 | 23 | 44 | 14 | 50 | 0 | 24 |
| Daqahlia | _ | _ | _ | _ | _ | _ | _ | |
| Sharkia | 26 | 23 | 146 | 103 | 94 | 0 | 65 | |
| Kafr al-Sheikh | _ | _ | _ | _ | _ | _ | _ | |
| Gharbia | _ | _ | _ | _ | _ | _ | _ | |
| Munfia | 9 | 69 | 0 | 26 | 5 | 0 | 18 | |
| Beheira | 0 | 1 | 4 | 5 | 3 | 0 | 2 | |
| Upper Egypt | Fayoum | 6 | 5 | 2 | 2 | 3 | 0 | 3 |
| Beni Sweif | 9 | 12 | 10 | 15 | 11 | 0 | 9 | |
| Minya | 3 | 13 | 15 | 21 | 7 | 0 | 10 | |
| Assiut | 17 | 30 | 98 | 15 | 0 | 0 | 27 | |
| Sohag | 14 | 17 | 52 | 19 | 12 | 0 | 19 | |
| Qena | 8 | 32 | 71 | 23 | 25 | 0 | 27 | |
| Luxor | 60 | 15 | 134 | 57 | 5 | 0 | 45 | |
| Aswan | 68 | 50 | 127 | 33 | 26 | 0 | 51 | |
| Frontier | Matruh | 1,068 | 639 | 0 | 1,495 | 1,068 | 0 | 712 |
| Wadi al-Gadid | 4 | 4 | 0 | 7 | 7 | 0 | 4 | |
| Sinai N | _ | _ | _ | _ | _ | _ | _ | |
| Sinai S | _ | _ | _ | _ | _ | _ | _ | |
| Red Sea | _ | _ | _ | _ | _ | _ | _ | |
| Average | 74 | 56 | 47 | 115 | 74 | 26 | 65 | |
Appendix 4: Local and Regional (not sub-nationally allocated) investments in the Total BE (Existing BE & New Cities) by sector and governorate (‘000s EGP)
| Regions | Governorates | Total BE | ||||||
| Electricity | Transport | Housing | Waste-water | Water | Urban Develop. | Total | ||
| Grater Cairo | Cairo | 754,842 | 5,039,987 | 5,432,122 | 2,395,747 | 580,907 | 5,237,290 | 19,440,895 |
| Giza | 394,784 | 952,286 | 1,749,230 | 883,967 | 628,810 | 7,043 | 4,616,120 | |
| Qalubia | 64,727 | 218,436 | 1,247,742 | 720,752 | 405,635 | 0 | 2,657,292 | |
| Alex. | Alexandria | 136,047 | 418,094 | 688,726 | 696,491 | 159,500 | 35,876 | 2,134,734 |
| Suez Canal | Port Said | 17,724 | 78,197 | 512,000 | 55,877 | 21,996 | 70,788 | 756,582 |
| Ismailia | 24,453 | 48,626 | 324,500 | 113,376 | 90,065 | 12,240 | 613,260 | |
| Suez | 32,993 | 15,300 | 410,000 | 196,734 | 10,593 | 4,602 | 670,222 | |
| Delta | Damietta | 22,252 | 75,197 | 1,672,400 | 201,195 | 131,632 | 201 | 2,102,877 |
| Daqahlia | 19,016 | 131,289 | 358,000 | 125,000 | 105,200 | 2,048 | 740,553 | |
| Sharkia | 181,707 | 404,844 | 2,174,170 | 827,370 | 788,664 | 1,500 | 4,378,255 | |
| Kafr al-Sheikh | 10,368 | 177,943 | 306,500 | 167,100 | 53,500 | 23,584 | 738,995 | |
| Gharbia | 15,331 | 77,362 | 358,000 | 277,290 | 92,510 | 10,305 | 830,798 | |
| Munfia | 53,766 | 341,873 | 548,000 | 444,862 | 177,788 | 0 | 1,566,289 | |
| Beheira | 7,160 | 70,336 | 557,899 | 203,600 | 115,500 | 0 | 954,495 | |
| Upper Egypt | Fayoum | 39,069 | 89,696 | 467,500 | 80,936 | 88,000 | 0 | 765,201 |
| Beni Sweif | 48,151 | 104,399 | 388,000 | 203,487 | 62,391 | 30,110 | 836,538 | |
| Minya | 43,171 | 156,990 | 585,600 | 290,250 | 178,550 | 87,297 | 1,341,858 | |
| Assiut | 133,087 | 246,854 | 891,500 | 211,000 | 157,600 | 11,461 | 1,651,502 | |
| Sohag | 90,137 | 237,213 | 707,200 | 216,575 | 295,778 | 33,577 | 1,580,480 | |
| Qena | 56,735 | 162,775 | 533,136 | 208,503 | 125,897 | 11,242 | 1,098,288 | |
| Luxor | 82,895 | 192,194 | 464,000 | 107,897 | 12,153 | 908 | 860,047 | |
| Aswan | 123,962 | 125,875 | 595,000 | 208,160 | 76,150 | 15,961 | 1,145,108 | |
| Frontier | Matruh | 566,234 | 470,743 | 312,500 | 881,000 | 654,000 | 35,776 | 2,920,253 |
| Wadi al-Gadid | 20,710 | 49,050 | 322,500 | 37,300 | 42,500 | 53,068 | 525,128 | |
| Sinai N | 32,879 | 110,255 | 549,500 | 14,800 | 28,485 | 100,000 | 835,919 | |
| Sinai S | 27,804 | 99,932 | 631,000 | 32,950 | 110,000 | 4,526 | 906,212 | |
| Red Sea | 0 | 83,263 | 417,000 | 48,000 | 69,000 | 152,429 | 769,692 | |
| Sub Total | 3,000,004 | 10,179,009 | 23,203,725 | 9,850,219 | 5,262,804 | 5,941,834 | 57,437,595 | |
| Not sub-nat. allocated | 25,303,400 | 15,379,800 | 103,500 | 10,000 | 0 | 653,000 | 41,449,700 | |
| Total | 28,303,404 | 25,558,809 | 23,307,225 | 9,860,219 | 5,262,804 | 6,594,834 | 98,887,295 | |
Appendix 5: Local investments in the Existing BE by sector and governorate (‘000s EGP)
| Regions | Governorates | Existing BE | ||||||
| Electricity | Transport | Housing | Waste-water | Water | Urban Develop. | TOTAL | ||
| Grater Cairo | Cairo | 33,862 | 4,326,842 | 629,000 | 417,470 | 159,000 | 237,290 | 5,803,464 |
| Giza | 32,609 | 446,894 | 357,500 | 305,843 | 118,000 | 7,043 | 1,267,889 | |
| Qalubia | 14,633 | 124,608 | 512,000 | 646,252 | 301,635 | 0 | 1,599,128 | |
| Alex. | Alexandria | 8,097 | 319,345 | 461,000 | 324,900 | 108,000 | 35,876 | 1,257,218 |
| Suez Canal | Port Said | 16,724 | 77,197 | 512,000 | 54,377 | 20,496 | 70,788 | 751,582 |
| Ismailia | 24,453 | 48,626 | 324,500 | 113,376 | 90,065 | 12,240 | 613,260 | |
| Suez | 25,593 | 10,000 | 410,000 | 143,334 | 3,493 | 4,602 | 597,022 | |
| Delta | Damietta | 5,952 | 43,997 | 306,500 | 182,395 | 63,632 | 201 | 602,677 |
| Daqahlia | 19,016 | 131,289 | 358,000 | 125,000 | 105,200 | 2,048 | 740,553 | |
| Sharkia | 9,227 | 249,544 | 332,000 | 145,347 | 163,463 | 1,500 | 901,081 | |
| Kafr al-Sheikh | 10,368 | 177,943 | 306,500 | 167,100 | 53,500 | 23,584 | 738,995 | |
| Gharbia | 15,331 | 77,362 | 358,000 | 277,290 | 92,510 | 10,305 | 830,798 | |
| Munfia | 15,510 | 63,373 | 512,000 | 338,212 | 157,488 | 0 | 1,086,583 | |
| Beheira | 7,160 | 65,497 | 532,000 | 171,600 | 95,500 | 0 | 871,757 | |
| Upper Egypt | Fayoum | 19,361 | 73,556 | 460,500 | 75,936 | 77,000 | 0 | 706,353 |
| Beni Sweif | 23,067 | 68,938 | 358,000 | 159,900 | 30,900 | 30,110 | 670,915 | |
| Minya | 29,671 | 86,990 | 311,000 | 176,250 | 141,050 | 87,297 | 832,258 | |
| Assiut | 58,722 | 115,354 | 465,500 | 144,900 | 155,500 | 11,461 | 951,437 | |
| Sohag | 25,539 | 156,023 | 460,500 | 124,650 | 240,850 | 33,577 | 1,041,139 | |
| Qena | 30,735 | 61,575 | 312,000 | 136,003 | 48,397 | 11,242 | 599,952 | |
| Luxor | 11,895 | 174,694 | 306,500 | 41,047 | 6,153 | 908 | 541,197 | |
| Aswan | 23,962 | 52,725 | 408,000 | 159,400 | 37,400 | 15,961 | 697,448 | |
| Frontier | Matruh | 66,234 | 171,743 | 312,500 | 181,000 | 154,000 | 35,776 | 921,253 |
| Wadi al-Gadid | 19,710 | 48,050 | 322,500 | 35,800 | 41,000 | 53,068 | 520,128 | |
| Sinai N | 32,879 | 110,255 | 549,500 | 14,800 | 28,485 | 100,000 | 835,919 | |
| Sinai S | 27,804 | 99,932 | 631,000 | 32,950 | 110,000 | 4,526 | 906,212 | |
| Red Sea | 0 | 83,263 | 417,000 | 48,000 | 69,000 | 152,429 | 769,692 | |
| Sub Total | 608,114 | 7,465,615 | 11,225,500 | 4,743,132 | 2,671,717 | 941,834 | 27,655,912 | |
| Not sub-nat. allocated | 0 | 11,800 | 103,500 | 10,000 | 0 | 653,000 | 778,300 | |
| Total | 608,114 | 7,477,415 | 11,329,000 | 4,753,132 | 2,671,717 | 1,594,834 | 28,434,212 | |
Appendix 6: Local investments in New Cities by sector and governorate (‘000s EGP)
| Regions | Governorates | New Cities | ||||||
| Electricity | Transport | Housing | Waste-water | Water | Urban Develop. | Total | ||
| Grater Cairo | Cairo | 720,980 | 713,145 | 4,803,122 | 1,978,277 | 421,907 | 5,000,000 | 13,637,431 |
| Giza | 362,175 | 505,392 | 1,391,730 | 578,124 | 510,810 | 0 | 3,348,231 | |
| Qalubia | 50,094 | 93,828 | 735,742 | 74,500 | 104,000 | 0 | 1,058,164 | |
| Alex. | Alexandria | 127,950 | 98,749 | 227,726 | 371,591 | 51,500 | 0 | 877,516 |
| Suez Canal | Port Said | 1,000 | 1,000 | 0 | 1,500 | 1,500 | 0 | 5,000 |
| Ismailia | _ | _ | _ | _ | _ | _ | _ | |
| Suez | 7,400 | 5,300 | 0 | 53,400 | 7,100 | 0 | 73,200 | |
| Delta | Damietta | 16,300 | 31,200 | 1,365,900 | 18,800 | 68,000 | 0 | 1,500,200 |
| Daqahlia | _ | _ | _ | _ | _ | _ | _ | |
| Sharkia | 172,480 | 155,300 | 1,842,170 | 682,023 | 625,201 | 0 | 3,477,174 | |
| Kafr al-Sheikh | _ | _ | _ | _ | _ | _ | _ | |
| Gharbia | _ | _ | _ | _ | _ | _ | _ | |
| Munfia | 38,256 | 278,500 | 36,000 | 106,650 | 20,300 | 0 | 479,706 | |
| Beheira | 0 | 4,839 | 25,899 | 32,000 | 20,000 | 0 | 82,738 | |
| Upper Egypt | Fayoum | 19,708 | 16,140 | 7,000 | 5,000 | 11,000 | 0 | 58,848 |
| Beni Sweif | 25,084 | 35,461 | 30,000 | 43,587 | 31,491 | 0 | 165,623 | |
| Minya | 13,500 | 70,000 | 274,600 | 114,000 | 37,500 | 0 | 509,600 | |
| Assiut | 74,365 | 131,500 | 426,000 | 66,100 | 2,100 | 0 | 700,065 | |
| Sohag | 64,598 | 81,190 | 246,700 | 91,925 | 54,928 | 0 | 539,341 | |
| Qena | 26,000 | 101,200 | 221,136 | 72,500 | 77,500 | 0 | 498,336 | |
| Luxor | 71,000 | 17,500 | 157,500 | 66,850 | 6,000 | 0 | 318,850 | |
| Aswan | 100,000 | 73,150 | 187,000 | 48,760 | 38,750 | 0 | 447,660 | |
| Frontier | Matruh | 500,000 | 299,000 | 0 | 700,000 | 500,000 | 0 | 1,999,000 |
| Wadi al-Gadid | 1,000 | 1,000 | 0 | 1,500 | 1,500 | 0 | 5,000 | |
| Sinai N | _ | _ | _ | _ | _ | _ | _ | |
| Sinai S | _ | _ | _ | _ | _ | _ | _ | |
| Red Sea | _ | _ | _ | _ | _ | _ | _ | |
| Sub Total | 2,391,890 | 2,713,394 | 11,978,225 | 5,107,087 | 2,591,087 | 5,000,000 | 29,781,683 | |
| Not sub-nat. allocated | 0 | 0 | 0 | 0 | 0 | 0 | 0 | |
| Total | 2,391,890 | 2,713,394 | 11,978,225 | 5,107,087 | 2,591,087 | 5,000,000 | 29,781,683 | |
Appendix 7: Governorate, Existing BE and New City Populations in 2006[24]
| Region | Gov | New City | 2006 Population | ||
| New Cities | Gov. | % | |||
| Greater Cairo | Cairo | New Cairo | 118,678 | ||
| Shorouk | 20,983 | ||||
| Badr | 17,172 | ||||
| 15-May | 90,324 | ||||
| Total | 247,157 | 8,471,859 | 2.9% | ||
| Giza | 6th October | 157,135 | |||
| Sheikh Zayed | 29,553 | ||||
| Total | 186,688 | 5,724,545 | 3.3% | ||
| Qalubia | Obour | 43,802 | 4,251,672 | 1.0% | |
| Alexandria | Alexandria | Borg al-‘Arab | 41,351 | 4,123,869 | 1.0% |
| Suez Canal | Port Said | None | / | 570,603 | 0.0% |
| Ismailia | None | / | 953,006 | 0.0% | |
| Suez | None | / | 512,135 | 0.0% | |
| Delta | Damietta | New Damietta | 25,944 | 1,097,339 | 2.4% |
| Daqahlia | None | / | 4,989,997 | 0.0% | |
| Kafr al-Sheikh | None | / | 2,620,208 | 0.0% | |
| Gharbia | None | / | 4,011,320 | 0.0% | |
| Beheira | New Nubaria | 39,611 | 4,747,283 | 0.8% | |
| Munufia | Sadat | 27,781 | 3,270,431 | 0.8% | |
| Sharkia | 10th of Ramadan | 124,120 | |||
| New Salhiya | 18,968 | ||||
| Total | 143,088 | 5,354,041 | 2.7% | ||
| Upper Egypt | Fayoum | New Fayoum | 0 | 2,511,027 | 0.0% |
| Beni Sweif | New Beni Sweif | 17,638 | 2,291,618 | 0.8% | |
| Minya | New Minya | 4,570 | 4,166,299 | 0.1% | |
| Assuit | New Assuit | 1,761 | 3,444,967 | 0.1% | |
| Sohag | New Sohag | 57 | 3,747,289 | 0.0% | |
| Qena | قنا الجديدة | 0 | 3,001,681 | 0.0% | |
| Luxor | طيبة | 1000 | 457,286 | 0.2% | |
| Aswan | New Aswan | 0 | 1,186,482 | 0.0% | |
| Fronteir | Matruh | None | / | 323,381 | 0.0% |
| Wadi al-Gadid | None | / | 187,263 | 0.0% | |
| Red Sea | None | / | 288,661 | 0.0% | |
| Sinai N | None | / | 343,681 | 0.0% | |
| Sinai S | None | / | 150,088 | 0.0% | |
| Total | 780,391 | 72,798,031 | 1.1% | ||
Appendix 8: Governorate, Existing BE and New City Populations in 2016[25]
| Region | Gov | Egypt* | Existing BE** | New Cities*** | ||
| Count | Count | Count | 2006 % of Gov | 2016 % of Gov | ||
| Grater Cairo | Cairo | 9,440,374 | 8,889,549 | 550,825 | 2.9% | 5.8% |
| Giza | 7,762,792 | 7,256,474 | 506,318 | 3.3% | 6.5% | |
| Qalubia | 5,215,446 | 5,107,984 | 107,462 | 1.0% | 2.1% | |
| Alex. | Alexandria | 4,901,910 | 4,803,605 | 98,305 | 1.0% | 2.0% |
| Suez Canal | Port Said | 678,564 | 678,564 | 0 | 0.0% | 0.0% |
| Ismailia | 1,209,663 | 1,209,663 | 0 | 0.0% | 0.0% | |
| Suez | 636,841 | 636,841 | 0 | 0.0% | 0.0% | |
| Delta | Damietta | 1,359,643 | 1,295,352 | 64,291 | 2.4% | 4.7% |
| Daqahlia | 6,074,446 | 6,074,446 | 0 | 0.0% | 0.0% | |
| Sharkia | 6,640,664 | 6,285,717 | 354,947 | 2.7% | 5.3% | |
| Kafr al-Sheikh | 3,249,268 | 3,249,268 | 0 | 0.0% | 0.0% | |
| Gharbia | 4,852,968 | 4,852,968 | 0 | 0.0% | 0.0% | |
| Munfia | 4,035,137 | 3,966,583 | 68,554 | 0.8% | 1.7% | |
| Beheira | 5,959,050 | 5,859,606 | 99,444 | 0.8% | 1.7% | |
| Upper Egypt | Fayoum | 3,280,103 | 3,280,103 | 0 | 0.0% | 0.0% |
| Beni Sweif | 2,943,740 | 2,898,426 | 45,314 | 0.8% | 1.5% | |
| Minya | 5,309,254 | 5,297,607 | 11,647 | 0.1% | 0.2% | |
| Assiut | 4,364,111 | 4,359,649 | 4,462 | 0.1% | 0.1% | |
| Sohag | 4,734,676 | 4,734,532 | 144 | 0.0% | 0.0% | |
| Qena | 3,128,194 | 3,128,194 | 0 | 0.0% | 0.0% | |
| Luxor | 1,173,753 | 1,168,619 | 5,134 | 0.2% | 0.4% | |
| Aswan | 1,466,965 | 1,466,965 | 0 | 0.0% | 0.0% | |
| Frontier | Matruh | 468,218 | 468,218 | 0 | 0.0% | 0.0% |
| Wadi al-Gadid | 230,591 | 230,591 | 0 | 0.0% | 0.0% | |
| Sinai N | 445,811 | 445,811 | 0 | 0.0% | 0.0% | |
| Sinai S | 169,822 | 169,822 | 0 | 0.0% | 0.0% | |
| Red Sea | 354,263 | 354,263 | 0 | 0.0% | 0.0% | |
| Total | 90,086,267 | 88,169,421 | 1,916,846 |
|
||
Notes
[1] This research has been authored by Yahia Shawkat and Amira Khalil, with copy editing by Waleed Almusharaf. We would also like to thank Dr Nihal al-Megharbel for all her help.
[2] For an overview of NUCA’s New Cities see http://www.newcities.gov.eg/english/New_Communities/default.aspx
[3]For more see 1.1 Built Environment Sectors, Public Funds
[4]Each New City has a subsidiary agency, the Gihaz al-Madina that is in charge of construction and management.
[5] A further two agencies are responsible for regionally shared investments in electricity and railroads.
[6]For more on the New Administrative Capital see NUCA 2016: New Administrative Capital Implementation Report 04.05.2016 http://newcities.gov.eg/know_cities/NewCapital/default.aspx And; The Capital Cairo 2015. http://thecapitalcairo.com/ Ret: 23.05.2016.
[7]For more on New Alamein see NUCA 2016: New Alamein, Implementation Report 04.05.2016 http://newcities.gov.eg/know_cities/alameen_new.aspx Ret: 23.05.2016
[8] For more on spatial equality on the city level see Tadamun 2015, Investigating Spatial Inequality in Cairo http://www.tadamun.info/2015/12/15/investigating-spatial-inequality-cairo/?lang=en#.V07E-OSm0ow
[9] This information was based on an exceptional instance where the MoP’s Socio-economic Plan for FY 2015/16 outlined this information in a table. See MoP 2015, Chapter 4, p 138
[10] The original investment budget (Ch 6) for the MoH’s offices (diwan ‘am) as published in FY 2013/2014 was 8,051,600,000 EGP, however the FY 2014/2015 budget document showed the previous year’s modified budget as 21,401,600,000 EGP. See MoF Muwaznat al-gihaz al-idari, Istikhdamat Qita’ al-Iskan wal-Marafiq wal-Khadamat, 2013/2014 and 2014/2015.
[11] For a simple introduction to general definitions of State-Owned-Enterprises:
Natural Resource Governance Institute, State Participation and State Owned Enterprises, http://www.resourcegovernance.org/sites/default/files/nrgi_State-Participation-and-SOEs.pdf
For a more understanding of Quasi-Fiscal Activities and their relationship to public budgets:
IBP, Guide to Transparency in Public Finances: Looking Beyond the Core Budget,
http://www.internationalbudget.org/wp-content/uploads/Looking-Beyond-the-Budget.pdf
For more general information regarding Egyptian State-Owned-Enterprises:
Budgetary and Human Rights Observatory, الهيئات الاقتصادية المصرية: موازنة خارج الموازنة
http://bahroegy.org/userfiles/pdf/arabic/Esdarat/AwrakSyasat/2700.pdf
[12] For more on the HCCD see http://www.hccd-construction.com/Hccd_main.aspx
[13] For population numbers at the National, Existing BE and New Cities, please see Appendicies 7 and 8.
[14] Budget line items are arranged as follows; Salaries and Compensation (Ch 1), Purchase of Goods and Services (Ch 2), Interest, Subsidy (Ch 3), Grants and Social Benefits (Ch 4), Other Expenditures (Ch 5), Investments (Ch 6), Acquisition of Financial Assets (Ch 7), Repayment of Loans (Ch 8).
[15]MoF 2015. Al-Muwazna al-‘Amma lil-Dawla lil-Sana al-Malia 2015/2016. Accessed: 01.11.2015 http://www.mof.gov.eg/Arabic/%D8%B9%D9%86%D8%A7%D9%88%D9%8A%D9%86%20%D8%B1%D8%A6%D9%8A%D8%B3%D9%8A%D9%87/PE/Pages/budget15-16.aspx
[16]MoP 2015. Khitat al-Tanmiya al-Iqtisadia wal-Igtimaeya lil-‘Am al-Mali 2015/2016. Accessed: 01.11.2015 https://web.archive.org/web/20160510204433/http://mop.gov.eg/plan/Plan2016.aspx?ModID=2&MID=31
[17]NUCA website, Khitat al-Hay’a, Al-Khitta al-Moqtaraha 2015/2016, May 3rd, 2015. Accessed: 01.11.2015 https://web.archive.org/web/20160323024252/http://newcities.gov.eg/about/maps/default.aspx
[18]A request to a senior official at the ministry of planning resulted in more detailed information for specific government agencies across governorates. Some of this data was present in the publicly published economic and social development plan, but some governorates were missing.
[19]As subsidies are part of Chapter 3 expenditure in the General State Budget, they have not been taken into account in this study. For more see Section 1.1 Built Environment Sectors & Data
[20]Most projects in the Urban Development sector require investments in more than one of the other five sectors. However, investments listed here were ones where sectoral division was not made available. It is also worth mentioning that NUCA’s investments allocated to this sector are for a lump sum dedicated to one New city, the New Administrative Capital, where investments in the other New Cities were disaggregated, and hence are not mentioned as part of the Urban Development sector in the rest of this study so as not to skew results.
[21] For more on administrative divisions, please see section 1.2 Built Environment Divisions & Regions
[22] Sub-national per capita spending primarily uses the populations of New Cities within the governorate boundaries, unless where the population numbers drop below 5000 people where a number of them have not gained any meaningful population, or are still under construction, in which case the total governorate population has been used. For more information please see Appendicies 7 and 8.
[23] It is worth mentioning that Cairo governorate’s slum clearance and urban upgrading programmes received funding more than the grand total of the ISDF’s budget for all of Egypt, through the Tahya Masr Fund (One Bn EGP), the Cairo Governorate’s Services’ Fund (Around 200 Mn EGP), and the large charity Ma’an (Around 300 Mn EGP), this despite the fact that they are not part of this analysis for the reasons outlined in the Methodology Section 1.1 Built Environment Sectors & Data
[24] CAPMAS 2016, Egypt in Numbers, Population (as of January 1st 2016. New City populations were projected from 2006 census data (see Appendix 7) by calculating their proportion of the governorate population and then doubling it to reflect their higher than average growth rate.
[25] CAPMAS 2016, Egypt in Numbers, Population (as of January 1st 2016. New City populations were projected from 2006 census data (see Appendix 7) by calculating their proportion of the governorate population and then doubling it to reflect their higher than average growth rate.