- Published on 18 November 2016
*This section is part of BE Budget 2015/2016
Total Sub-national Spending on Waste-water
Public spending on waste-water treatment stations and networks totalled 9.9 Bn EGP. This translates to a per capita spending of 109 EGP per person (Table 19). With a little over half the budget, per capita spending in New Cities was 2664 EGP per person, or about 24 times the national average. In contrast, per capita spending in the Existing BE was 54 EGP per person, or about half the national average.
Table 19: Total and per capita local spending on waste-water by administration
| Existing BE | New Cities | Total | |
| Investments (EGP) | 4,753,132,000 | 5,107,087,000 | 9,860,219,000 |
| 48.2% | 51.8% | 100% | |
| Per Capita (EGP/pax) | 54 | 2664 | 109 |
Combining spending on both New Cities and the Existing BE at the local level, Matruh led the Frontier governorates with the highest local per capita spending of 1882 EGP per person, or about 18 times the national average (fig. 19). The rest of the Frontier governorates were mostly above average, except for North Sinai at a third of the national average. Suez received the second highest per capita spending at 309 EGP, or about three times the average, with the two other Canal zone governorates just below average. Cairo had the third highest per capita spending, leading the Greater Cairo region, with both Qalubia and Giza receiving slightly higher than average spending at 138 and 114 EGP per person respectively. Alexandria received almost 1.5 times the average per capita spending. All the Delta governorates, except Damietta, Sharkia and Munufia (all with New Cities), received half the average spending or less. Again, the Upper Egypt governorates received well below average spending, except Aswan at 1.5 times the average.
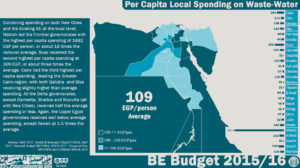
Fig. 19: Total per capita spending on waste water
Sub-national Spending on Waste-water in the Existing BE
Isolating spending on the Existing BE halves the sub-national per capita average to 54 EGP per person. Matruh still has the highest sub-national per capita spending at 387 EGP per person, with the rest of the Frontier governorates much higher than average, except North Sinai at 33 EGP per person, which is below average (fig. 20). Suez remained second at 225 EGP per person (about four times the average), with the two other Canal zone governorates almost double the average. Spending in Greater Cairo’s Existing BE drops significantly when the New Cities are excluded. Thus, Qalubia receives 1.2 times the average, and Cairo and Giza just less than average. Two Delta governorates received higher than average spending, another two around average, and the remaining three less than average. Upper Egyptian governorates received below average spending, with only Beni Sweif receiving near average spending at 55 EGP per person, and Aswan twice the average.
Sub-national Spending on Waste-water in New Cities
Average per capita spending in New Cities was 2664 EGP per person (fig. 20). Minya had the highest per capita spending at 9788 EGP per person, or over three times the New Cities average. The other New Cities in Upper Egypt received far below the average spending. New Burg al-‘Arab received the second highest per capita spending. New Cities in Cairo were third, and the other two Greater Cairo governorates received less than half the average. Delta New Cities all received well below average spending on waste-water.
Spending on Waste-water; The Existing BE vs New Cities
Public spending on waste-water projects in New Cities was higher in per capita terms in 9 of the 14 governorates with active New Cities (fig. 20). Overall, residents in New Cities received per capita spending of 2664 EGP per person, or about 49 times more than residents in the Existing BE. This ratio ranged from a high of 294:1 in Minya, to a low of 0.1:1 in Fayoum. In Greater Cairo, New Cities there received between 5.5 to 76.5 times the per capita spending on waste-water in its Existing BE.
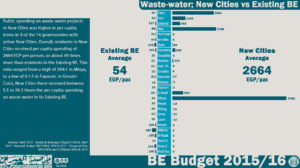
Fig. 20: Local per capita spending on waste-water; New Cities versus the Existing BE
*Click here to go back to BE Budget 2015/2016