- Published on 18 November 2016
*This section is part of BE Budget 2015/2016
Programmatic Spending on Transport
Total expenditure on transport was EGP 24.3 Bn. Of that amount, 58% was spent on projects with a regional reach and 42% on local projects, two thirds of which were assigned to the Existing BE (fig. 9).
On the project level, 30% went to National highways, 28% to railroads, while 24% was assigned to local highways, roads and bridges. Of this, 65% was in the Existing BE. The remaining 18% of the transport budget was for public transport (underground metro, tram and buses), of which a staggering 90.7% was in Cairo alone.
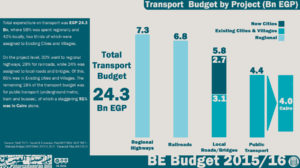
Fig. 9: Spending by project and administration in the Transport sector
National Per Capita Spending on Transport
While total per capita spending on transport averaged 284 EGP per person, it was highest in New Cities where spending on local roads and bridges translated to 1416 EGP per person (Table 14). This was followed by regional projects (highways and railroads), at 171 EGP per person. The least per capita spending was for local roads and public transport, at 85 EGP per person in the Existing BE.
Sub-national Per Capita Spending on Transport
Per capita spending on transport fluctuated greatly between the governorates, from a high of 1005 EGP per person in Matruh, mostly due to New Alamein which is under construction, down to 12 EGP for Beheira. Most Delta and Upper Egyptian governorates received far less than the national average of EGP 270 per person. Even though Cairo received 50% of the local transport budget, it was second in per capita spending at 534 EGP per person after South Sinai. The latter received 588 EGP per capita even though it received only 1.3% of spending.
Table 14: Total and per capita spending on Transport projects by administration (‘000s EGP)
| Local Projects | Regional Projects | Total | |||
| Existing BE | New Cities | ||||
| Roads & Bridges | 3,054,880 | 2,713,394 | 8,528,000 | 14,296,274 | 55.9% |
| Railroads | _ | _ | 6,840,000 | 6,840,000 | 26.8% |
| Public Transport | 4,422,535 | _ | _ | 4,422,535 | 17.3% |
| Total | 7,477,415 | 2,713,394 | 15,368,000 | 25,558,809 | 100% |
| 29.3% | 10.6% | 60.1% | 100.0% | ||
| Per Capita (EGP/pax) | 85 | 1,416 | 171 | 284 | |
Spending on Local Public Transport
The BE Budget only found three agencies that provide local public transport in Egypt based in four governorates with investments totalling 4.4 Bn EGP, of which 90.7% was in Cairo governorate alone, translating to 451 EGP/pax (Table 15). Expenditure on the underground metro in Greater Cairo accounted for 91.8% of the public transport budget, where 81% of that was in Cairo governorate. On the other hand spending on public buses through the Cairo Transport Authority and the Alexandria Public Transport Authority accounted for only 8.2% of the Public Transport budget, while Qalubia received the least per capita spending at 4 EGP per person.
Table 15: Total and per capita investments in Public Transport
| Underground Metro | Public Buses | Total | Per capita | ||
| ‘000 EGP | ‘000 EGP | ‘000 EGP | % | EGP/pax | |
| Cairo | 3,831,000 | 177,735 | 4,008,735 | 90.7% | 451 |
| Giza | 205,000 | 0 | 205,000 | 4.6% | 28 |
| Qalubia | 20,000 | 0 | 20,000 | 0.5% | 4 |
| Alexandria | 0 | 185,000 | 185,000 | 4.2% | 39 |
| Total | 4,056,000 | 362,735 | 4,418,735 | 100.0% | 50 |
| 91.8% | 8.2% | 100.0% | |||
Transport Spending; New Cities Versus Existing BE
Spending on transport in New Cities exceeded that in the Existing BE in six out of the 20 governorates that have a New Cities programme, with Sadat City in Munufia receiving 4.4 times more funding than it’s ten cities and towns and 381 villages (fig. 10). Spending on New Cities in another six governorates was between 50% to 100% of spending on existing BE, while Beheira had the least New City-to-Existing BE ratio at 7.4%.
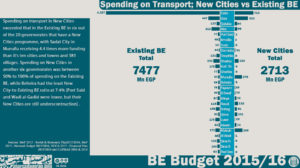
Fig. 10: New Cities’ percentage of spending on local transport
*Click here to go back to BE Budget 2015/2016