- Published on 12 September 2022
1- Company Ownership
Financial oversight institutions and transparency advocates in a number of countries have developed what has been termed as Ultimate Beneficiary Ownership or UBO, where companies must disclose who their actual owners are – either natural persons made of flesh and blood, like the Tax Justice Network calls them, or states, where ownership remains institutional and cannot be attributed to real people.
One would think that that is a foregone conclusion: company registers or stock market disclosures typically show who the people or states owning controlling shares – 5 to 25% – of these companies are. However, that has increasingly become the exception, where many companies’ owners are other companies, funds, banks, trusts, or agents – lawyers or accountants that represent an owner,[1] who may also be a company. This can create a complex chain of legal owners based in many countries, at times making it impossible to find out the actual owner.
This anonymity has allowed financial corruption such as money laundering, monopolization and tax evasion, political corruption hiding politically connected owners, or those that oversight institutions or states have blacklisted for misconduct or geo-political threats.[2] Complex ownership structures that use offshore companies and trusts may also be legitimate, or legal, however, it is investor identities, rather than practices, that this study has focused on revealing.
Thus, we were interested in two levels of ownership. The first is the Ultimate Beneficiary Ownership (UBO), the country where an individual owner is from, or identifies as from. The second method of defining ownership, is the Tax Resident (TR) method, where the company individual investors use to own shares, is tax resident. For example, an Egypt-based company owned by a Kuwaiti person is considered tax domiciled in Egypt under the TR method, and would pay taxes on dividend income and capital gains in Egypt.[3] This is so, even though under UBO, its ultimate beneficial owner is considered Kuwaiti. In another case, an Egyptian owner whose stocks are owned through a company in the Cayman Islands, under the TR method this ownership would be considered to be in the Caymans Islands, while under UBO, would be in Egypt.
What is the Ultimate Beneficiary Owner (UBO) Method?
The UBO method shows the actual owner, who either invested directly in their name, or through one or more companies. In some cases, investors were grouped together as families, as their investments were found to be always related, but controlled by one member. In the event family members had different nationalities, or were dual nationals, the nationality of the lead controlling member, or where they identify as from, was used.
What is the Tax Resident (TR) Method?
The TR method shows where the income made by that owner is taxed. For this second level, we focused on owners who used a chain of ownership, to show where the last company in that chain is domiciled.
What is the study/data timeframe?
All data on ownership is a snapshot in time on 31 December 2021. Thus, ownership structures may have changed since then.
What are the sources used?
We have relied on primary official sources for the majority of data in this study as far as has been available.
For Listed Companies:
-
- Ownership above disclosure thresholds – 5% for companies, and 3% for insiders on the EGX, has been found in stock market disclosures, financial reports, or presentations. They have been downloaded from the stock market websites – for eg: the EGX Disclosure Archive, company investor relations websites – see Company Factsheets, or specialized third party websites that have archived these disclosures such as info.
- Ownership below disclosure thresholds has been sought from professional stock market data providers, namely Simply Wall Street which uses S&P Global Market Intelligence
- Limitations: The above data shows institutional investors – companies and funds, down to 0.01% shareholding, and individual investors down to 3% holdings, unless they are insiders or related to main investors.
.
For Private Companies:
-
- Publicly available primary sources such as articles of association, gazette announcements, stock market disclosures and financial reports, and company reports and websites were used.
For a full list of sources, see the appendices in the Company Factsheets.
In the case an online link is not available, please check it on the online archiving tool web.archive.org.
What are the limitations on the nationalities of Individuals?
Information on nationality was gained primarily from official sources such as company documents – articles of association, stock market disclosures, company websites. Where not available, less official sources such leading media, were used. Many high-net-worth individuals in this study, however, carry dual nationalities, or may be long term residents of countries other than their nationality. Or, in the cases of investor families, members may not hold the same nationalities, or be tax resident in the same jurisdictions. Thus, we could not necessarily identify their tax resident status correctly, and instead have relied on their cultural nationality, i.e. where they predominantly identify as from.
What are the limitations on the nationalities of companies?
Under the TR method, for private companies, the nationality where the last company in a chain of ownership is incorporated. In the case of a listed company where UBO was not sought, the country where it is primarily listed. Under the UBO method, the nationalities were listed as mixed/unknown, as it was either impossible to identify investors’ nationalities, or, the breakdown of a company by investor would have resulted in miniscule landholdings that would not have been beneficial for the study – for example those of well known asset managers who hold small shares in the case study companies such as BalckRock, Inc., Deutsch Bank and HSBC.
2- Developer Land Banks
How was land ownership attributed?
Given the complicated and somewhat indirect nature in how many land plots were acquired, we developed three methods of defining land possession:
1-De Jure Ownership in 2021:
Net land areas legally owned by the companies according to legal buying, selling, return/retrieval to/by NUCA until 31.12.2021.
- For indirect ownership, percentage of land ownership was determined by share of subsidiaries, or affiliate companies as stated in financial statements.
- For co-development or revenue share agreements with other private sector companies:
- Where a subsidiary is established by the shareholding companies, de jure ownership is prorated based on the company share each main company holds.
- Where a subsidiary is not found, de jure ownership rests with the stated landowner, while control ownership rests with the company with the greatest revenue share, as the revenue paid in cash or in kind represents transactional value for the land, while ultimate control of the project from a client is exercised by it (advertising, use of logos/brands, sales, management, etc..).
- For co-developments agreements with the government (NUCA), de jure land ownership rests with the developing company.
.
2-Control ownership in 2021:
Net land areas under the full control of the company according to the sources stated above, recognized as:
- For indirect ownership 100% of land area for land plots with majority legal ownership (+50% in subsidiaries, controlling stake in listed companies), and zero % where minority of shares is held.
- For co-development or revenue share agreements with other private sector companies:
- 100% control for a company undertaking all development activity under its brand name (marketing, construction and sales) in co-development agreements, even if the legal ownership rested with a third party.
- 0% if development activity was under another brand name (especially co-development) even if it had legal ownership.
.
3-Total Lands:
The full original plot size of the development regardless of type of ownership, or subsequent sales or retrieval/ giving up by/to NUCA.
What land bank information has been gathered?
All developments or land plots that were still under development, or if sold, still managed, between 2011 and 2021 by the developers and/or their subsidiaries.
How was land bank information gathered?
First, projects that had units advertised for sale between 2011 and 2021 were identified based on the developers’ available information (websites and annual reports).
Second, plot areas and sale/assignment dates were gathered from the following sources depending on availability:
- Official government sources: Minister of Housing or Governor decrees approving masterplans or detailed plans, as published in the Official Gazette – electronically available for free on the Court of Cassation Archive, or org, or if unavailable, by subscription on the Egyptian Cabinet’s Archive, or Eastlaws.
- Developers’ information as published on their websites, annual reports, PR releases or stock market disclosures. In the case that dates of land sale/assignment were not stated, they were decided as one year prior to the project launch.
- Aerial photography and GIS where land plot areas were mapped from Google Earth and land sale/assignment dates attributed as one year prior to start of construction as evidence by the Google Earth time-line feature.
- News and online media reports based on government-owned or private media specializing in real estate industry.
.
For a full list of sources, see the appendices in the Company Factsheets.
In the case an online link is not available, please check it on the online archiving tool web.archive.org.
3- Greater Cairo Urban Land
What is Greater Cairo?
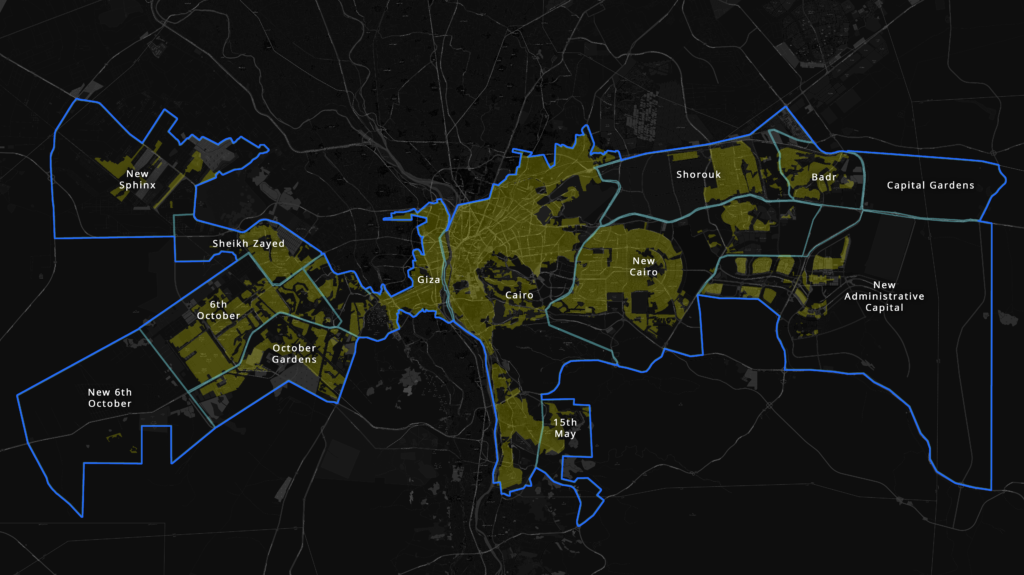
As there is no administrative designation of Greater Cairo, urbanists and planners have used a number of designations chief of which are the cities of Cairo, Giza and Shubra al-Kheima in Cairo, Giza and Qalyubia governorates respectively, or all three governorates. In this research, we have focused on the contiguous urban agglomeration in the Cairo and Giza governorates made up of Cairo and Giza cities, as well as the new cities that have been built – or a are still being built around them with significant land holdings by large scale developers: New Cairo, New Administrative Capital, Shorouk, and Capital Gardens in Cairo Governorate, and: 6th of October City, October Gardens, Sheikh Zayed and New Sphinx in the Giza governorate.
What is urban land/cordon?
Areas tat have been designated as urban, namely cities, and that have a defined limit as per official decree, as opposed to areas designated as rural, namely villages and their agricultural surroundings, or unallocated desert land.
What is built-up land?
Areas within urban land that have already been built or subdivided to be built.
What is residential land?
Areas within built-up land that are, or are designated to be, solely or predominantly residential development (Figure 1).
Figure 1: Extract from GIS database showing administrative cordons (blue) and built-up land within them (green) in the case study region (Sources: see tables below).
What is the unit of measurement?
We have used the national standard, the feddan, for this study, which equates to 4200 square metres, or 0.42 hectares. For ease of understanding, in the English version of the study we have used the more interchanged the term for the widely known acre, which measures 4047 square metres, or 0.41 hectares.
What is the area of Greater Cairo in this study?
Table 1: Total area and sub-areas of the Greater Cairo region in this case study as of December 2021 (Acres)
| Governorate | City | Residential area | Built Up Area | Cordon |
| Cairo | 15th of May | 5,033 | 6,236 | 18,329 |
| Cairo | Badr | 7,018 | 14,200 | 18,545 |
| Cairo | Cairo City | 48,544 | 58,893 | 58,893 |
| Cairo | Capital Gardens | 16,852 | 29,436 | 29,436 |
| Cairo | New Administrative Capital | 10,525 | 40,407 | 184,216 |
| Cairo | New Cairo City | 69,723 | 83,867 | 99,815 |
| Cairo | Sherouk | 27,284 | 28,268 | 52,992 |
| Giza | 6th of October City | 38,139 | 53,744 | 53,744 |
| Giza | Giza City | 7,265 | 18,780 | 19,151 |
| Giza | Hadayek October | 14,432 | 18,000 | 40,749 |
| Giza | New 6th of October | 65,577 | 78,500 | 78,500 |
| Giza | New Sphinx | 29,582 | 76,921 | 76,921 |
| Giza | Sheikh Zayed | 19,992 | 20,940 | 23,250 |
| TOTAL | 359,966 | 528,191 | 754,540 |
All areas mapped by GIS from the below sources
Table 2: The sources of mapping the Greater Cairo metropolitan area according to cordon, built-up areas, and residential areas
| City | Sources |
| Cairo | Cairo Governorate Maps 2020, GOPP 2008* p.48 |
| Giza | Giza Governorate Maps 2016, GOPP 2008* p.48 |
| New Cairo | NUCA New Cairo page, PD 191/2000, 499/2016, MoH 1060/2017 |
| Shorouk | NUCA Shorouk page, MoH 227/2018 |
| Badr | NUCA Badr City page |
| Capital Gardens | NUCA Capital Gardens page, PD 645/2020 |
| New Administrative Capital | MoH New Administrative Capital Strategic Plan, PD 57/2016 |
| 15 May | NUCA, 15 May page, PD 390/2017 |
| 6Th October | NUCA 6th October page, |
| Hadayek October | NUCA Hadayek October page, Plan based on MoH 888/2019 |
| New 6th October | NUCA New 6th October page, MoH Master Plan, MoH 146/2018 |
| Sheikh Zayed | NUCA Sheikh Zayed page, MoH Strategic Plan, MoH 367/2020 |
| New Sphinx | NUCA New Sphinx Page, MoH 90/2020 |
| *GOPP, “Istratigeyet al-tanmaiya li-muhafzat al-gumhuriya: Iqlim al-qahira (Governorate Development Strategy: The Greater Cairo Region)”, General Organisation for Physical Planning (GOPP). 2008.
Notes: PD: Presidential Decree, MoH: Minister of Housing Decree
|
|
References
[1] Though in Egypt, that is not practised.
[2] Emile van der Does de Willebois, Emily M Halter, and Robert A. Harrison, “The Puppet Masters : How the Corrupt Use Legal Structures to Hide Stolen Assets and What to Do About It” (Washington D.C.: World Bank, 2011), https://openknowledge.worldbank.org/handle/10986/2363.
[3] Only applicable from 2022 as per Law 199/2020 amending Income Law 91/2005