- Published on 07 June 2024
Contents
Real estate SOEs’ share of public revenue
1- The Holding Company for Construction and Development
2- The New Urban Communities Authority
Recent efforts to improve Treasury capture
Executive Summary
In the third paper in our Taamir series that aims to understand the public real estate sector in Egypt, this study focuses on the relationship of state-owned real estate activities to the Treasury, especially as it is a non-strategic sector. State-owned real estate activities have been found to encompass more than just social housing, extending to middle-income and luxury housing. Here we pose the questions. Do the residents ultimately benefit from these activities, which are supposed to bolster public revenue so that the government can spend on social needs? Or, are real estate activities not profitable for the state, and therefore cannot eliminate its negative impact, such as raising housing prices and making them more unaffordable for the majority of the population?
The study begins by analysing the Treasury’s (government) revenue from state-owned real estate activity, by looking at the final accounts of the public budget – which show actual rather than planned spending, over recent years. The New Urban Communities Authority (NUCA) and the Holding Company for Construction and Development (HCCD), the largest state-owned real estate enterprises and which own more than ten real estate companies, accounted for an average of 7% of the dividends paid out by state-owned enterprises (SOEs) to the Treasury over the past eight years.
Focusing on economic entities, the main payer of dividends to the Treasury over the past seven years (2016/2017 – 2022/2023), NUCA accounted for 8.9% of total dividends paid out by economic entities. The authority ranked third after the Suez Canal, which paid out 60%of dividends, and state-owned ports, which generated about 12% of dividend transfers.
However, when comparing the dividends paid out to the treasury to the profits actually realised by NUCA and the HCCD, we found that they were very low, representing only 55% of their net profits. After analysing the process of transferring the dividends of state-owned real estate companies to the Treasury, we found that they are ‘diluted’ through a cascading accounting system that leads to the retention and reinvestment of a much higher portion by the companies, diverting revenue away from the Treasury.
In the first case study on HCCD, five real estate companies that it held full or partial stakes in (Maadi, Al-Nasr, Heliopolis, Al-Shams, and Madinat Masr), paid out an average of 40% of their profits as dividends to their shareholders between 2017/2018 and 2020/2021, of which HCCD received LE 1.6bn.
However, HCCD paid out only EGP 257mn. to the Treasury during the same period, or 16% of the total dividends paid out to it from these profitable subsidiaries. In total, HCCD paid out only 7.4% of its net profits to the Treasury over the same period.
The other case study, which focused on NUCA, found that the authority’s accounts do not show a “net profit” item in the sense commonly used by companies, as Egypt’s Unified Finance Law stipulates that economic entities negotiate a “surplus” with the Ministry of Finance (MoF) each fiscal year without specifying a fixed percentage of dividends. NUCA can then transfer all or part of this surplus to the treasury or reinvest it all in its activities.
However, while NUCA’s revenues more than quadrupled over the past few years: From LE 26bn in 2015/2016 to LE 108bn in 2022/2023, its actual surplus remained flat over the same period, thus shrinking as a percentage of revenues, from 19% in 2015/2016 to only 4.9% in 2022/2023.
In addition to its main activity, which is the construction of new cities and social, medium and luxury housing projects, NUCA invests in five for-profit real estate companies that develop and sell luxury residential units: City Edge Developments, Hyde Park Developments, Housing and Development Bank, Saudi Egyptian Developments, and Administrative Capital for Urban Development.
Here, NUCA’s revenue from investments, which includes its dividends paid out to it by these five companies, reached LE 45.6bn over the six years between 2015/2016 and 2020/2021, representing 14% of NUCA’s total revenue during that period.
However, NUCA paid out only LE 24.5bn to the Treasury during the same period, or only 54% of its revenues from its investments, its secondary activity, which means that the majority of the subsidiaries’ dividends were directed to NUCA’s own activities, rather than the Treasury.
These developments by SOEs have not been ignored by the government, where recent efforts to address some of the ‘transmission losses’ of SOE dividends to the Treasury. However, these efforts focused mostly on companies, leaving out economic agencies, or the extent of their impact was not yet clear due to the unavailability or incompleteness of financial statements since their implementation.
The study concludes with a number of recommendations aimed at governing state-owned real estate enterprises, and indeed SOEs in general, from a social perspective. While they have a clear mandate to invest in profitable, non-strategic and non-social real estate development, they need to pay out more dividends out of their significant profits to the Treasury, in order to boost public spending on the social needs of the residents.
Real estate SOEs’ share of public revenue
After analysing how much income state owned enterprises (SOE) make from real estate in the first Taamir report, this essay analyses how much the government gains from these real estate investments. By the government, we mean the Treasury, the central government entity where the ultimate dividends on public investments are paid in, as happens with all other publicly owned assets (oil, ports, the Suez Canal).
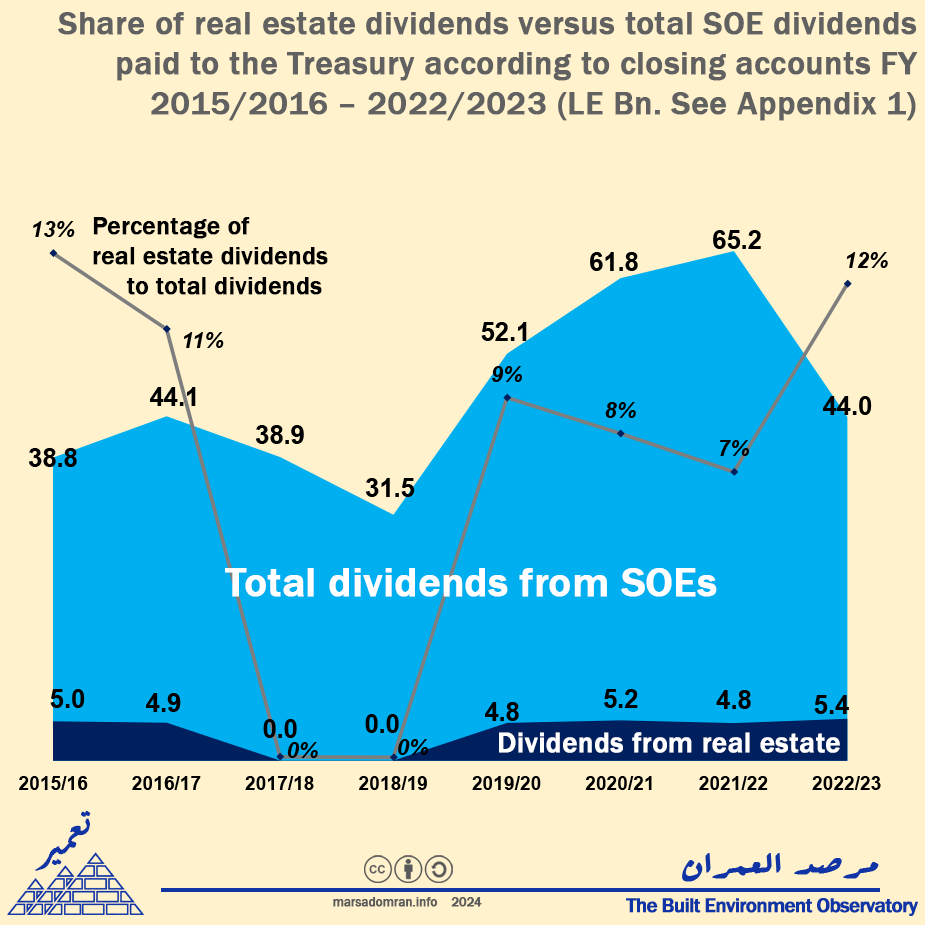
Using the public budget’s closing accounts data – which show actual rather than planned expenditure, we analysed the two main real estate SOEs: the New Urban Communities Authority (NUCA), and the Holding Company for Construction and Development (HCCD), who themselves wholly or partially own ten subsidiary real estate companies.[1] Over the last eight years, the two SOEs accounted for 7% of the Treasury’s revenue from all state-owned businesses over that time. Revenue share however, fluctuated widely from a high of 15% in 2015/2016, to almost zero in 2017/18, 2018/19 (Figure 1).
Figure 1: Share of real estate dividends versus total SOE dividends paid to the Treasury according to closing accounts FY 2015/16 – 2022/2023 (LE Bn. See Appendix 1)
Real estate dividends in third place
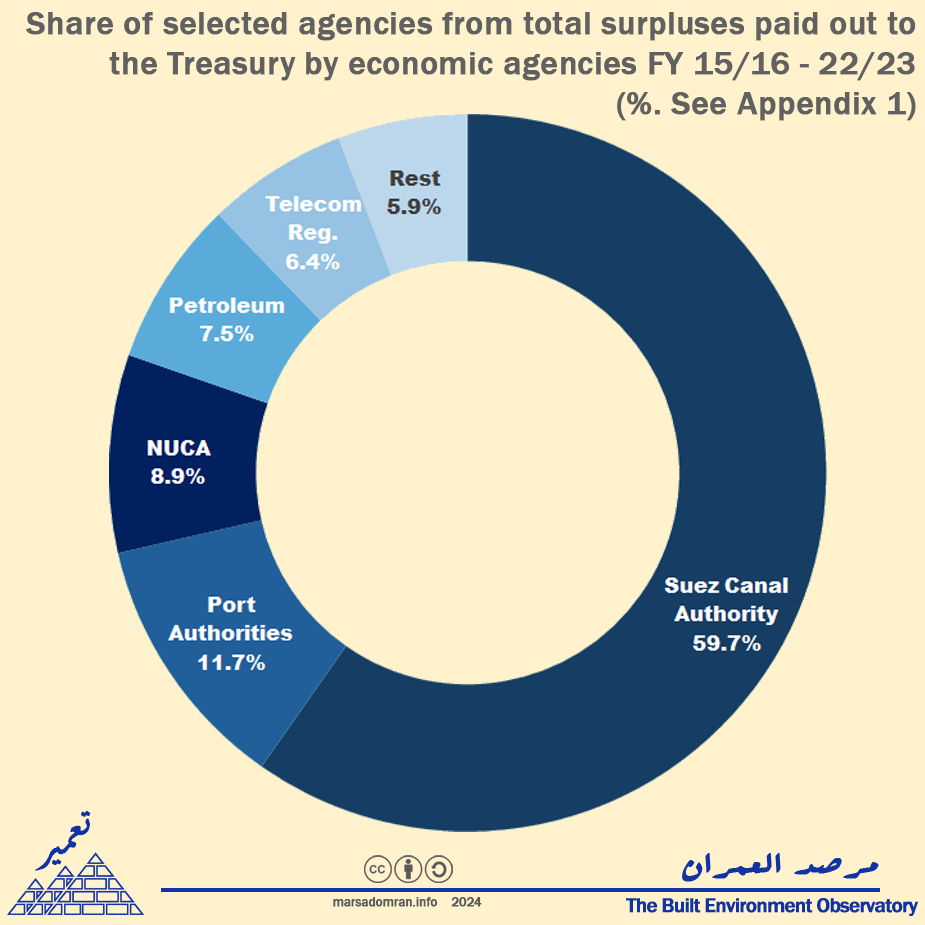
If we focus on economic agencies, the main form of SOE dividend payer to the Treasury over the last seven years (2016/17 – 2022/23), we find that NUCA is a significant revenue generator for the government. At 8.9%, NUCA came in third place after the Suez Canal, which generated 60% of the Treasury’s dividends, and state-owned ports which garnered 11.7% of dividend income (). NUCA beat longtime contributor, the Egyptian General Organisation for Petroleum, which only paid out 7.5% of the dividends, as well as communications (6.4%), and almost 50 other economic agencies that together paid out the remaining 5.9% of dividends.
Figure 2: Economic agency surpluses paid out to the Treasury by selected agencies between FY 2015/16 – 2022/23 (%. See Appendix 1)
However, real estate dividends are low
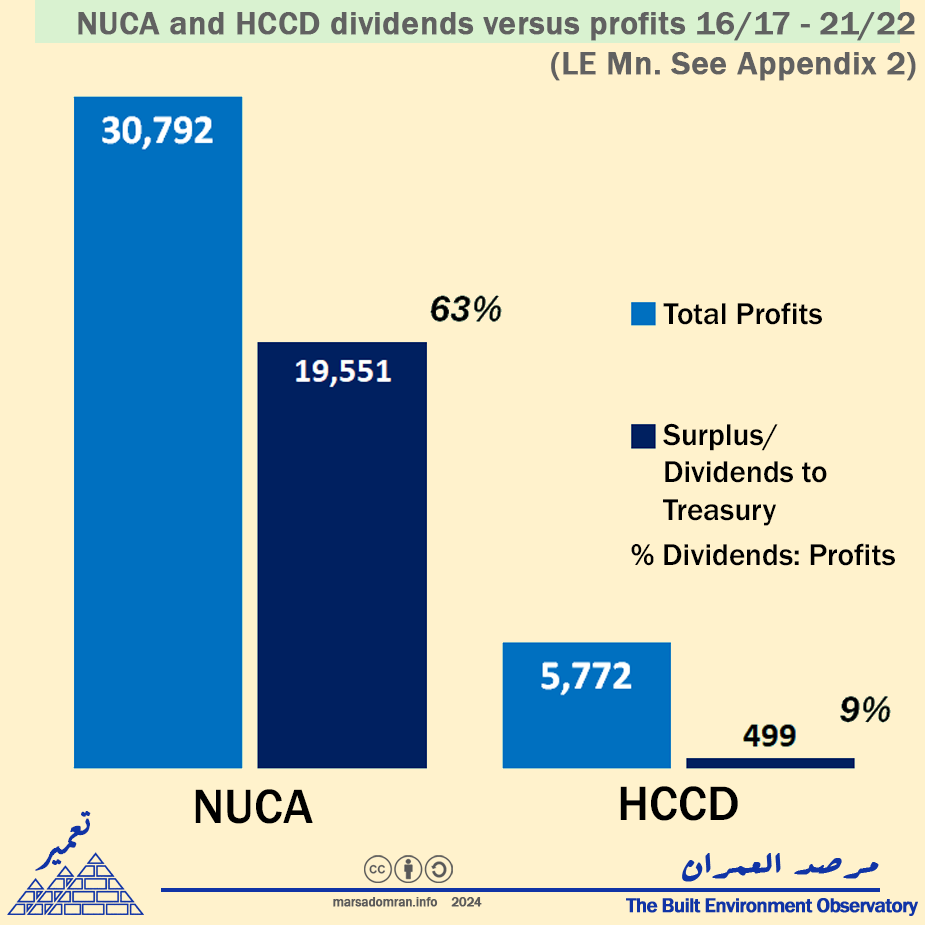
Even though the contribution of public real estate activity to the Treasury is significant, when compared to the total profits these SOEs generate, it is actually quite low. Over the last six years (2016/17 – 2021/2022), closing accounts show how NUCA and HCCD transferred only LE 20.1 Bn out of LE 36.3 Bn of the profits they generated, or only two 55% (Figure 3). If we add up the profits of the subsidiary companies, the gap widens even further. Under general accounting practices, not all profits are paid out as dividends, as the laws and statutes for these companies and agencies allow for retaining profits for reserves or reinvestment, as well as pay outs to and employees and the boards of directors (BoD). However, as this analysis will show, these retentions are higher than they should be, leading to generally low dividends paid out to their shareholder: the Treasury.
Figure 3: NUCA and HCCD dividends versus profits between 2016/17 – 2021/22 (LE Mn. See Appendix 2)
Transmission Losses
Engineers have defined the difference between the amount of electricity generated by a power station, and the actual electricity that reaches users as ‘transmission losses’, as a certain amount of energy is consumed in order to transport it from production to consumer. However, only a certain amount of loss is considered acceptable, whereas in the event it exceeds a certain figure, the network has to be investigated for leaks.
While there are 14 real estate SOEs in this study, ten of them are wholly or partially owned by two of the 14. This means that only four of the 14 have a direct relationship to the Treasury, where the ten subsidiaries pay out their dividends to the SOEs that ‘own’ their shares, and in turn, the two SOEs pay out their dividends directly to the Treasury. Here, heavy ‘transmission losses’ have been found occur, as reserves are retained, profits are mostly reinvested into the companies, and whatever remains are distributed to the holding companies or agencies that own the companies. These holding companies then apply the same cycle of reserves, reinvestment and dividends, diluting the original profits. Some of the companies also have subsidiaries, which means, that profits from these smaller companies, go through three cycles of redistribution. Following is an analysis of two of the main holding companies and agencies, that show the extent of just how much profit is diluted.
1- The Holding Company for Construction and Development
As of 2020/2021, the HCCD owned or was a shareholder in at least five major real estate companies (Figure 4). These were: Maadi for Development and Construction, Al-Nasr for Housing and Development, Madinet Masr (formerly Madinet Nasr for Housing and Development), Heliopolis for Housing and Development, and Al-Shams for Housing and Development.
Figure 4: Ownership network of HCCD’s real estate subsidiaries at the end of 2022 (Sources: see text)
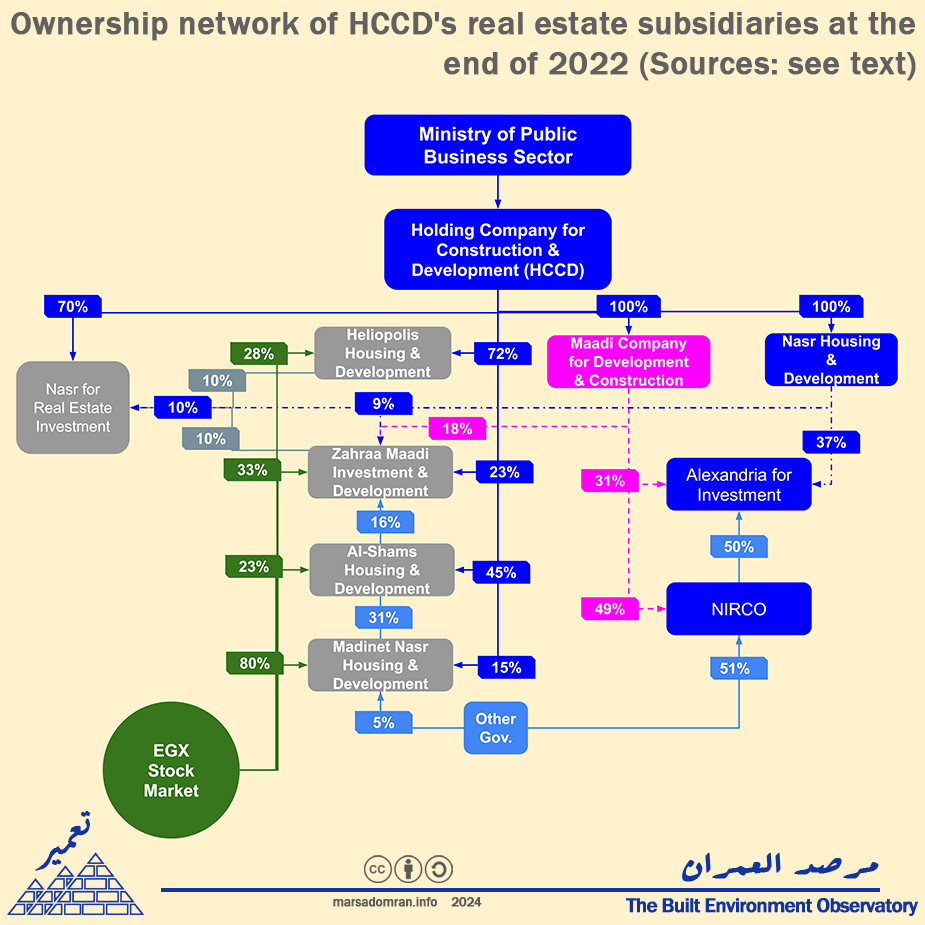
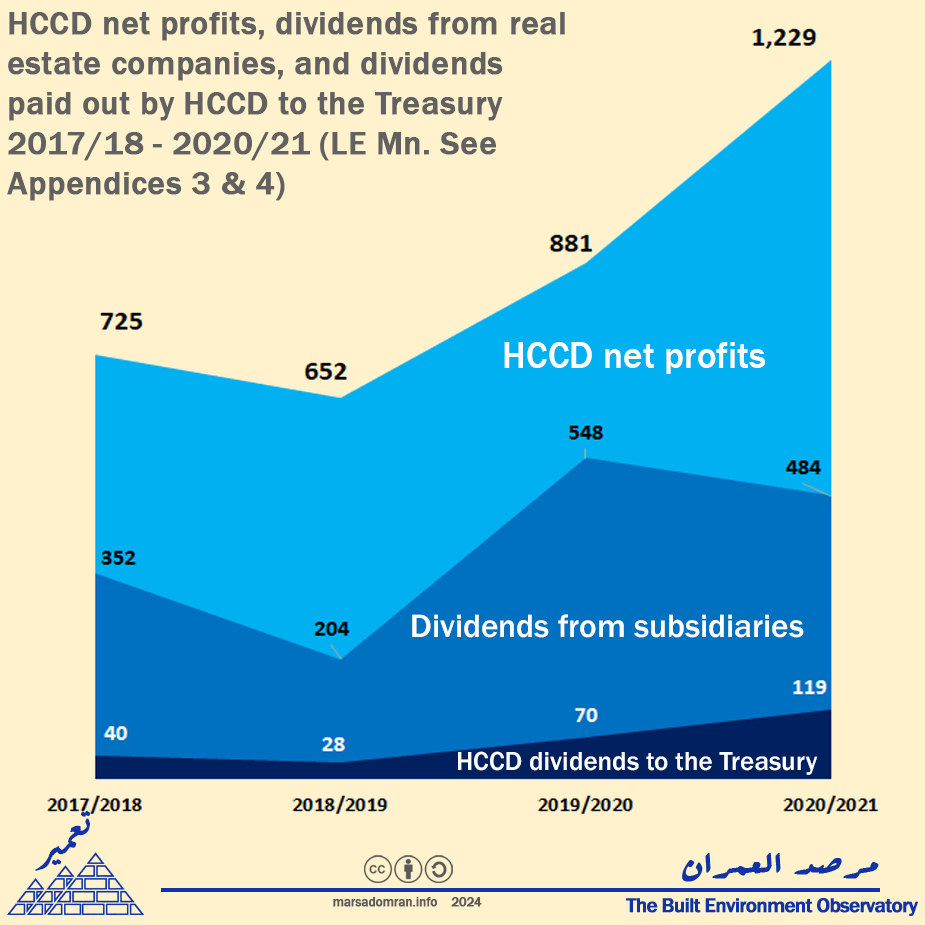
Between 2017/18 and 2020/21, these companies paid out an average of 40% of their profits to their shareholders, of which the HCCD received LE 1.6Bn (Figure 5). If we add other companies in HCCD’s portfolio – contracting, and small interests in listed real estate companies, its share from dividends over that time rises to LE 3.5Bn in net profit (Figure 5). However, over those four years, the HCCD has paid out only LE 257 Mn to its only shareholder, the government, representing a mere 16% of the real estate dividends paid out to it, or 7.6% its total profits. So where have most of the profits gone?
Figure 5: HCCD net profits, dividends from real estate companies, and dividends paid out by HCCD to the Treasury 2017/18 – 2020/21 (LE Mn. See Appendices 3 & 4)
Profit distribution policy
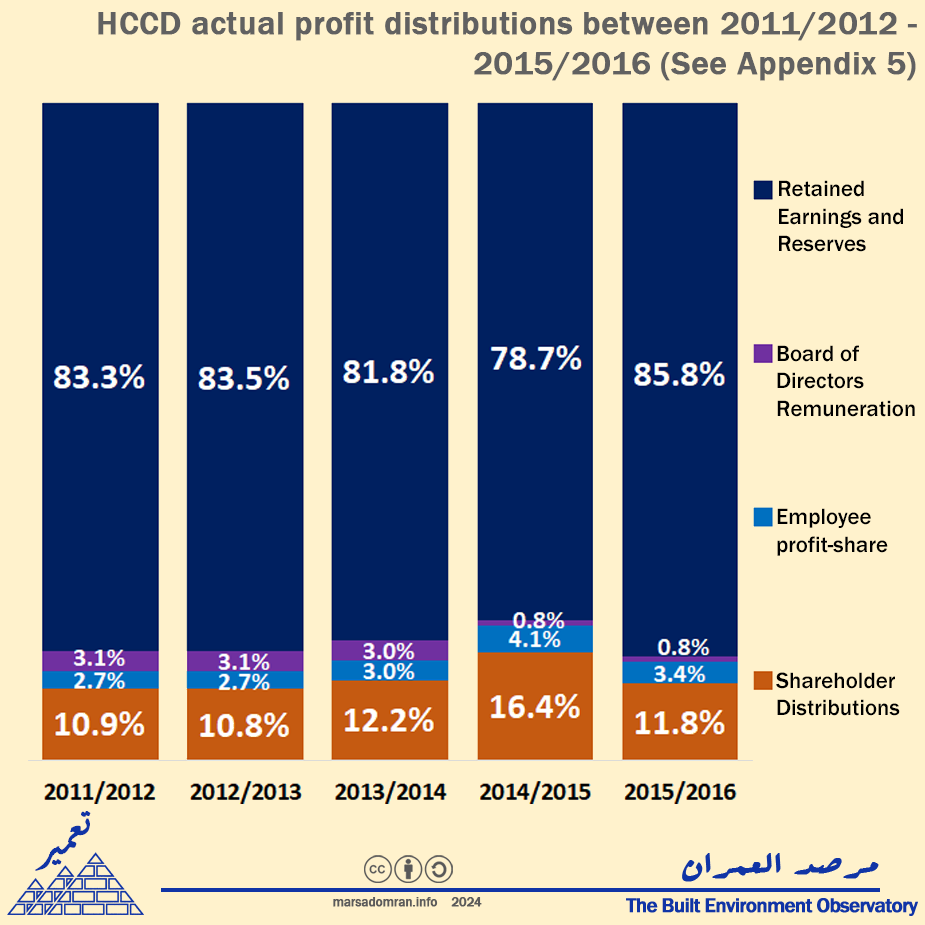
According to the HCCD’s accounting and profit distribution policies,[2] reserves can account for up to 25% of the profits, thereafter employees receive a profit share of up to 10% of the remaining profits, shareholders a minimum of 5%, and the board of directors (BoD) 5% of the remaining profits after the previous profits are distributed. After these payouts, any remaining profits can be paid out to the shareholders on top of the initial 5%. The articles also allow the remaining profits to be reinvested into the company and not paid out at the discretion of the Annual General Meeting (AGM) based on the recommendation of the BoD, in order to “preserve the company’s financial standing”.[3] Between 2011/12 and 2015/16, HCCD accounts show us something else.[4] Over that time, an average of 83% the profits were added to reserves and/or retained (Figure 6). This means that only 17% of the profits were distributed, where on average 1.8% went to the BoD, 2.8% to employees, and only 12% was paid out to HCCD shareholders, i.e. the Treasury (Figure 6).
Figure 6: HCCD actual profit distributions between 2011/2012 – 2015/2016 (See Appendix 5)
Hoarding profits
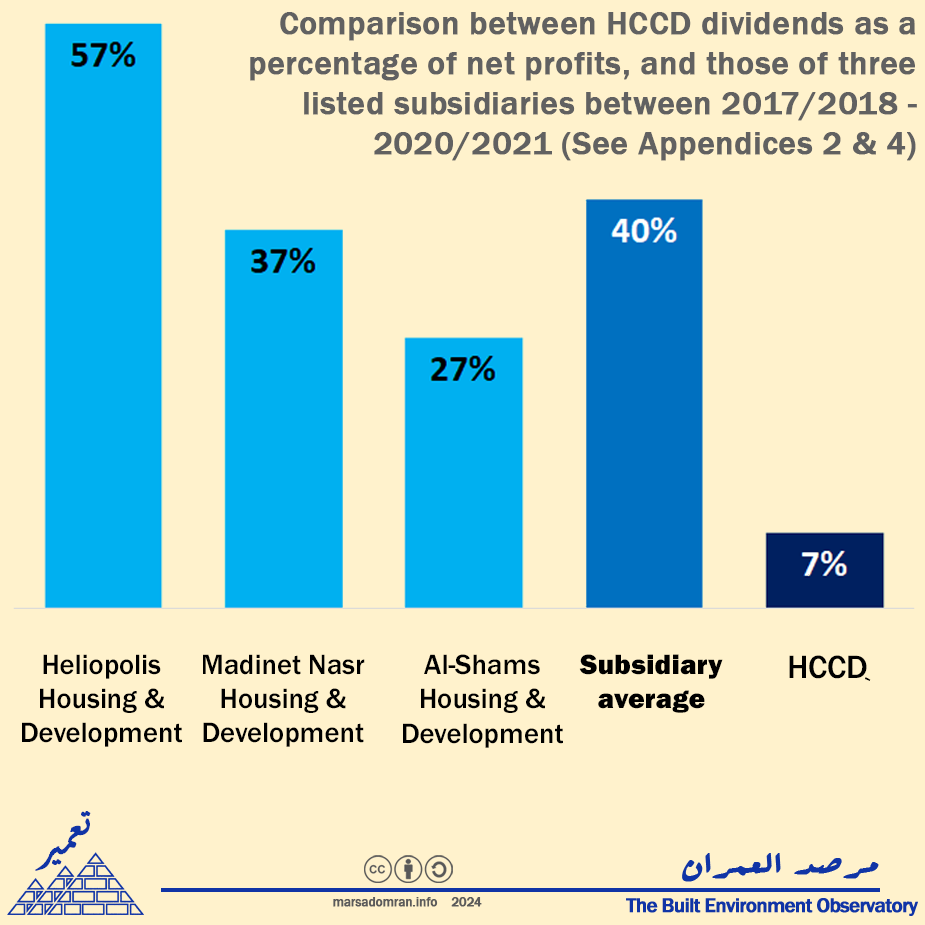
Overall, in more recent years, HCCD’s dividends to the Treasury have shrunk even more, averaging only 7% of its net profits between 2017/2018 – 2020/2021 (Figure 7). By comparison, the three listed real estate companies it owns shares in, paid out between a low of 27% and a high of 57% of their profits out as dividends over the same period, averaging 40% (Figure 7). Even amongst other state-owned holding companies, the practice of hoarding such a high percentage of profits seems to be unique to the HCCD. Among seven other state-owned holding companies, the HCCD had the sixth lowest return on investments (0.8%), well below the average of 5.8%, and only ahead of the Spinning and Weaving Holding Company that has been chronically loss making.[5] Given that the HCCD is largely a holding company without any main activity of its own except to manage the companies in its portfolio, there is no reason for it to retain so much of these profits. An overwhelming majority of its companies are profitable – 16 out of 19,[6] and as we have seen, already retain over half their profits to manage reinvestment and expansion. Therefore, as a holding company the HCCD should transfer the majority of its profits to the Treasury in order to benefit public spending on social programs.
Figure 7: Comparison between HCCD dividends as a percentage of net profits, and those of three listed subsidiaries between 2017/2018 – 2020/2021 (See Appendices 2 & 4)
2- The New Urban Communities Authority
Since NUCA is an economic agency, rather than a state-owned company, its accounting standards are different. While its income statements show how revenue is made, they do not show expenses in the same way they are shown in company statements, leading to no ‘net profit’ line item in the traditional sense. Here, economic agencies negotiate a ‘surplus’ with the Ministry of Finance (MoF) each fiscal year.[7] The ministry then recommends, and parliament approves whether all or part of this surplus is paid out to the Treasury, or, reinvested by the SOE. For the current FY 2023/2024, the Treasury expects all economic agencies to generate LE 196Bn. in profits, but only expects one third of that (LE 66.2Bn.) in dividends, with the remainder being reinvested by the agencies.[8]
Negotiated surplus flat
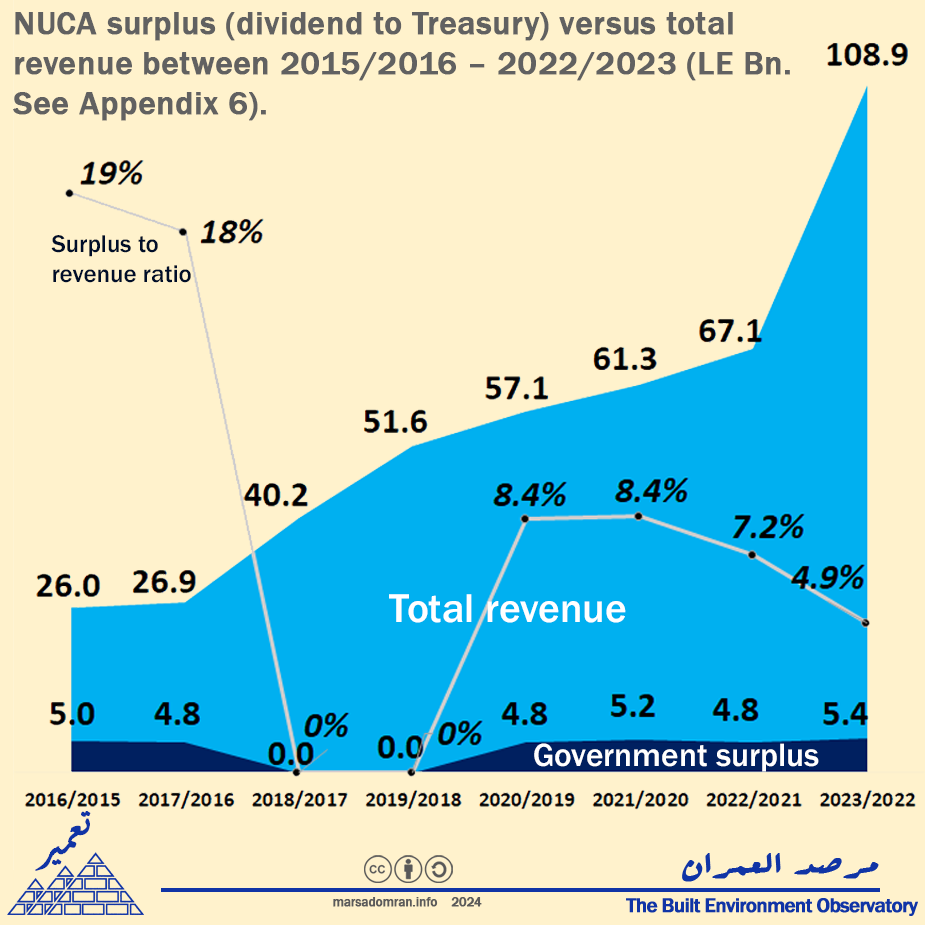
Taking a closer look at NUCA, we find significantly increasing revenues quadrupling from LE 26 Bn in 2015/2016, to LE 109 Bn in 2022/2023 (Figure 8). However, its closing accounts show an actual surplus that has either stayed flat, or not materialized at all, falling by a quarter from 19% of revenue in 2015/2016, to barely 5% in 2022/2023 (Figure 8).
The years where a surplus does not show in NUCA’s income statements are those where it has negotiated with the MoF that it will reinvest them in ‘national projects’ under the jurisdiction of the Ministry of Housing (MoH) and its agencies.[9] Some of these projects are social, such as financing the construction of social or slum replacement housing for other agencies. Others are for profit, such as the Cairo Aqueduct real estate development branded ‘Arabesque’, and the New Administrative Capital, according to the deputy housing minister.[10]
Figure 8: NUCA surplus (dividend to Treasury) versus total revenue between 2015/2016 – 2022/2023 (LE Bn. See Appendix 6).
Even so, NUCA is paid back for these projects by their respective agencies, or even turn a profit. The social housing NUCA builds, is then bought by another government agency, the Social Housing and Mortgage Finance Fund (SHMFF), using its own resources – down payments and mortgage pay outs made out to it by applicants and banks.[11] The SHMFF is also obligated to cover any differences in costs that NUCA incurs from when it is contracted to build the units till they are completed by up to 10%.[12] Here, NUCA only covers the cost of the land, which is given to it by the state for free, as well as infrastructure, which is already earmarked a 10% cut of the agencies land sales at a minimum of LE 3.67 Bn.[13] For slum clearance projects, NUCA receives land in-kind from authorities such as the governorates or the former Informal Settlements Development Fund – now the Urban Development Fund (UDF), that it co-develops as real estate investment projects where it stands to make a profit.[14] Other investment projects such as the New Capital, are planned as for profit projects, and should rely on the already retained profits, rather than any extra retentions. Therefore, this retaining of surplus has little social basis as public funds have already been allocated to other agencies, or, merely serve to increase capital for additional real estate investment projects, on top of the ones NUCA’s regular budget is already engaged in.
Investment revenue diverted
NUCA’s revenues are earned mainly by its core activities of building new cities (selling land plots), as well as selling social, middle and luxury housing such as Dar Misr, Jenna and others. However, NUCA is also a shareholder in at least five major real estate developers that build luxury housing (Figure 9): Saudi Egyptian Developers (38%),[15] Administrative Capital for Urban Development (49%),[16] the Housing and Development Bank (29.8%),[17] which with the latter controls City Edge Developments (74%), and Hyde Park Developments (18%).[18]
Figure 9: NUCA’s relationship to subsidiary real estate companies (End of 2023. Sources: See text)
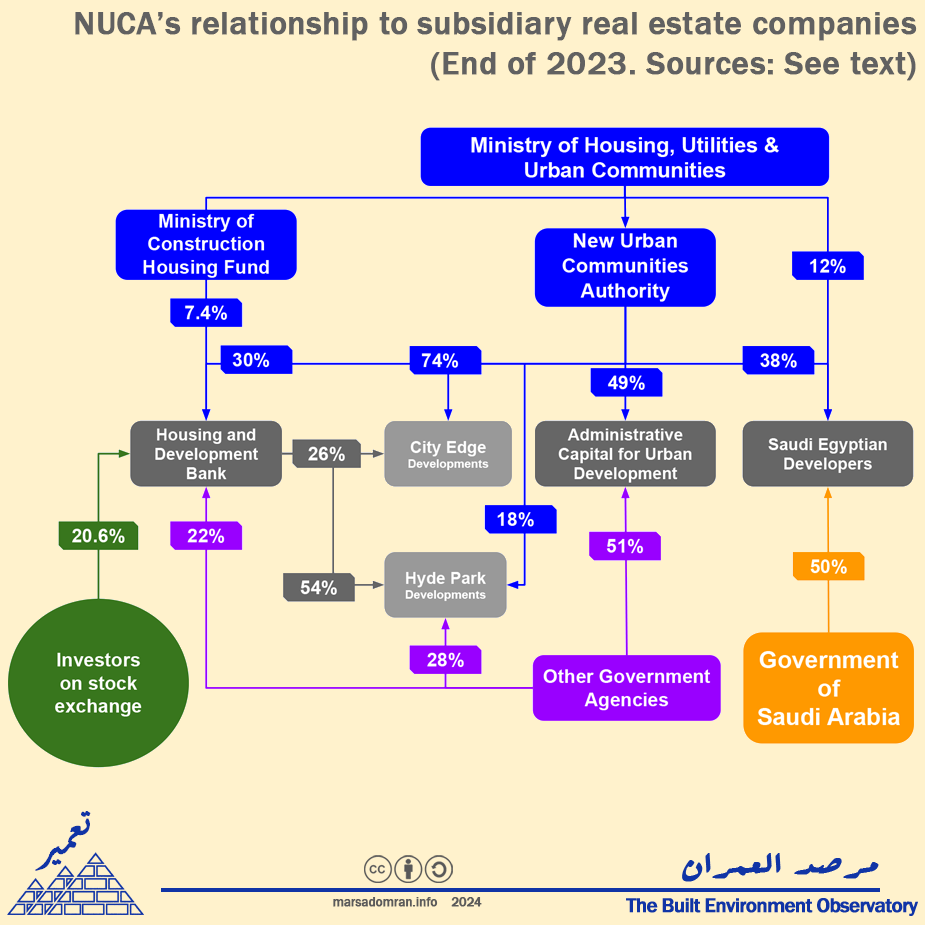
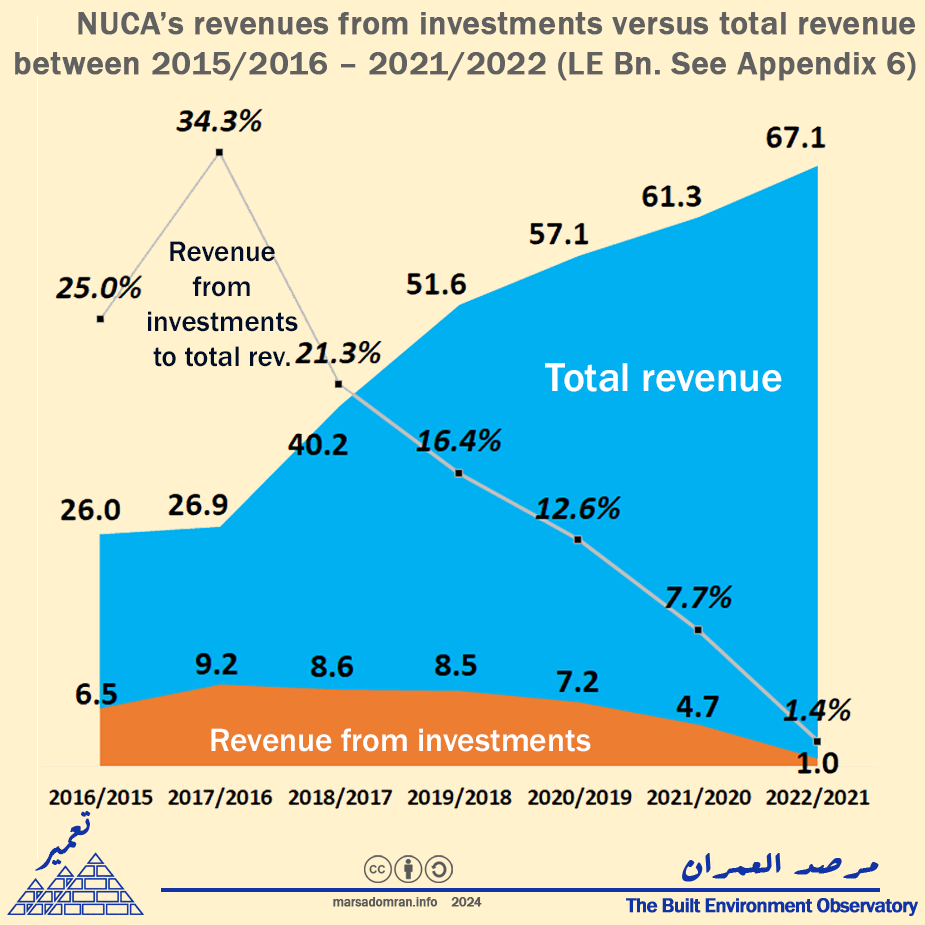
Taking another look at NUCA’s financial statements, we can see that revenue from investments – which include dividends from these five real estate companies, represented an average of 14% of its total revenue over the six years between 2015/2016 and 2021/2022 (Figure 10). These investment revenues accounted for total of LE 45.6 Bn over that period, which was significantly more than the LE 24.5 in surplus NUCA paid out to the Treasury over that time. This means that in addition to NUCA’s core activities, most of its dividends from its secondary activities are regularly diverted to its own investments rather than being paid out to the government.
Figure 10: NUCA’s revenues from investments versus total revenue between 2015/2016 – 2021/2022 (LE Bn. See Appendix 6).
Recent efforts to improve Treasury capture
There have been recent efforts to address some of the ‘transmission losses’ of SOE profits to the Treasury, however, they have only focused on companies and not economic agencies, or, are still to be implemented.
Restructuring the boards of directors
From 1991, the MoF was only present at the annual general meetings (AGM) of the holding companies, where representation of the shareholders – the government, was only through the minister overseeing the holding company.[19] According to the MoF, representation at the AGM led to weak oversight of holding company finances where the companies retained profits and built reserves outside of the limits stated by the law, something the MoF saw as “depriving the Treasury from its share of the profits” where they should “positively support the urgent needs of the public budget.”[20]
To address this, the Public Business Sector Law was amended in 2020 assigning a representative of the MoF to all holding company boards, in addition to a raft of changes leading to improvements in financial oversight of the holding companies and their subsidiaries.[21] However, since these amendments were made, the latest closing accounts (FY 2022/2023) show that targets for holding companies were missed by 11%, resulting in a similar rate of regression over the previous year’s dividends.[22] While this regression may be partially explained by the economic crisis that Egypt is going through, detailed financial accounts of the holding companies and their subsidiaries have not been made public since FY 2020/2021, preventing an analysis of how much of their profits were transferred to the Treasury.
Annulling tax exemptions
In 2023, a law annulling tax exemptions of all SOEs was passed.[23] The law did not only include companies, but economic agencies as well such as NUCA. However, since these agencies follow different accounting standards, and have not been subject to taxation before – with standalone exceptions for petroleum and the Suez Canal authorities, these new conditions will in all probability lead to a change in accounting practices that should reveal actual profits for the economic agencies in order to apply corporate tax.
Reinforcing publication of information on SOEs
In May 2023, the Supreme Council for Investment passed a decision to setup an SOE unit within the Cabinet to gather information on SOEs as part of a restructuring scheme that would see them privatised, or reassigned, in addition to improving governance and transparency.[24] The State Ownership Policy Review, completed in August 2023, also stipulated the application of unified financial accounting for all state-owned agencies and companies, reviewing all dividend policies, and the publication of an annual joint Ministry of Finance and Ministry of Public Business Sector report on SOE dividend policies.[25] However, at the time of publication, the SOE Unit nor the MoF had yet published any reports, while no restructuring efforts have been shown.
Public Government Budget
The Unified Public Budget Law was amended in early 2024 to include the budgets of economic agencies within the scope of the State General Budget, to show most public spending.[26] However, with the recent publication of next year’s state general budget 2024/2025, the first budget to be prepared under the new amendments, the new section given to the Government Public Budget did not succeed in showing the full extent of the financial relationships between the economic agencies and the public budget.[27] For example, there was no mention of the financial dealings mentioned before in this study between the SHMFF, a public service agency within the State General Budget, and NUCA, an economic entity. The Government Public Budget also did not include any holding company SOEs, such as the HCCD, or any other companies the government is a shareholder in.
Conclusion & Recommendations
Real estate SOEs have a clear mandate to invest in a profitable, non-strategic and non-social business of developing property. Since they are non-strategic, their main purpose is to generate income for the Treasury, their ultimate shareholder, in order to bolster its social spending on the residents’ needs. However, by hoarding the majority of these profits, the real estate SOEs activities have a net negative effect on Egyptians, where their luxury housing erodes housing affordability, and excludes the vast majority of residents as they cater to rich households and non-Egyptians. Since previous efforts to mix social business with profitable business have failed, these SOEs need to at least meaningfully contribute to social welfare programs of the state.
Based on these premises, the relationship between real estate SOEs and the state should be realigned, according to a long-term plan that sees the state divest from profitable real estate as a non-strategic sector as per the State Ownership Policy,[28] and focus on the social aspects of it: city development, infrastructure development, and social housing. In addition to incentivising middle-income housing through housing cooperatives and self-building. What follows are recommendations for short-term implementation.
Restructuring economic agencies
To implement the tax-exemption law that affects or non-social or national security activities, all economic agencies should divide their activities into subsidiaries based on definitions set out by the Ministry of Finance into: social activity subsidiaries (sub-agency – gehaz), and business activity subsidiaries (companies), where these entities will be subject to different modes of taxation.
In the case of NUCA, its activities can be restructured into holding companies or transferred to other agencies in order to ensure profits are taxed, and dividends are paid to the Treasury as follows:
- Focus on city development: This is the core mandate of NUCA and can continue as a custodian of public urban land, managing its development in partnership with local government, as a master developer for the general public. Under the new tax exemption law, its finances would be restructured to show profits and be taxed accordingly, and a proper portion of dividends paid to the Treasury.
- Isolating land co-development: A Land Development Holding Company should be established for land co-developments with the private sector, as well as with other public sector entities (such as the Administrative Capital for Urban Development), as they are non-social and NUCA receives cash as well as in-kind property to sell. The land development company could remain owned by NUCA.
- Separating real estate development: All profitable real estate projects (Sakan Masr, Dar Masr, luxury housing projects such as Janna, Capital Residence and others) should come under a company that is taxed and its dividends transfered to the Treasury. A good candidate after restructuring would be the Holding Company for Construction and Development (HCCD), under the Ministry of Public Business Sector.
- Separating real estate investments: NUCA shares in real estate developer subsidiaries (Saudi Egyptian Developers, Housing and Development Bank and their joint subsidiaries: City Edge Developments and Hyde Park Developments) should be transferred to the HCCD.
- Separating social/cooperative housing development: Implementation should be transferred to the Social Housing and Mortgage Finance Fund (SHMFF), a public services agency, where NUCA would assign it serviced land for free to build housing on as per a social-urban masterplan for each new city that designates a minimum area for social housing.
One off ‘windfall’ taxation of state-owned companies
As with the so-called ‘private funds’ – sanadiq khassa, affiliated to various agencies and not subject to the State General Budget, all holding companies and their subsidiaries that are 100% government owned, should have a one-off ‘windfall tax’ levied on their accounts if they are shown to have retained profits or accumulated reserves outside of those prescribed by law. Reassessment should happen on a regular basis to ensure their conformity, or become subject to a second windfall tax.
Advanced transparency and public monitoring
All SOEs should be subject to transparency and public disclosure standards similar to those of listed companies where key activities and reports are disclosed on a quarterly or yearly basis on a dedicated digital portal:
- Quarterly financial accounts
- Key events
- Accountability State Authority reports of these SOEs
Acknowledgements
Lead researcher: Yahia Shawkat
Infographs: Dina El-Mazzahi
Appendices
Appendix 1: Public revenue from dividends and surpluses of SOEs according to final accounts of the State General Budget FY 2015/2016 – 2022/2023 (LE).
| Fiscal year | 2015/2016 | 2016/2017 | 2017/2018 | 2018/2019 | 2019/2020 | 2020/2021 | 2021/2022 | 2022/2023 | Total 15/16-22/23 | ||
| Dividends from shareholding (In private, and public sectors) | 3,433,000,000 | 5,230,000,000 | 6,867,000,000 | 5,408,000,000 | 8,631,000,000 | 11,185,000,000 | 12,336,000,000 | 8,467,900,000 | 26,136,000,000 | ||
| HCCD Dividends | 81,272,748 | 86,700,000 | 39,700,000 | 28,100,000 | 70,334,000 | NA | NA | NA | 224,834,000 | ||
| HCCD Dividends:total dividends | 2.4% | 1.7% | 0.6% | 0.5% | 0.8% | NA | NA | NA | 0.9% | ||
| Suez Canal Authority | 14,755,000,000 | 27,742,348,000 | 20,590,493,000 | 18,015,228,000 | 28,624,863,000 | 32,674,734,000 | 24,501,752,000 | 14,722,352,000 | 166,871,770,000 | 59.7% | |
| Port Authorities | NA | 4,039,000,000 | 5,683,000,000 | 3,797,000,000 | 4,508,000,000 | 3,560,000,000 | 6,113,899,000 | 4,900,000,000 | 32,600,899,000 | 11.7% | |
| NUCA | 4,958,024,789 | 4,785,196,000 | 0 | 0 | 4,770,142,000 | 5,172,598,000 | 4,823,125,000 | 5,370,066,000 | 24,921,127,000 | 8.9% | |
| Petroleum | 7,820,000,000 | 738,179,000 | 2,487,793,000 | 1,101,914,000 | 1,176,889,000 | 3,543,389,000 | 10,335,224,000 | 1,467,906,000 | 20,851,294,000 | 7.5% | |
| Telecom | NA | 1,265,257,000 | 2,019,428,000 | 1,994,571,000 | 2,147,036,000 | 2,842,317,000 | 3,512,970,000 | 3,973,376,000 | 17,754,955,000 | 6.4% | |
| Rest (13 agencies) | 7,820,000,000 | 291,322,000 | 1,223,360,000 | 1,162,944,000 | 2,227,427,000 | 2,776,151,000 | 3,606,079,000 | 5,075,665,000 | 16,362,948,000 | 5.9% | |
| Total Economic Agencies | 35,353,024,789 | 38,861,302,000 | 32,004,074,000 | 26,071,657,000 | 43,454,357,000 | 50,569,189,000 | 52,893,049,000 | 35,509,365,000 | 279,362,993,000 | 100.0% | |
| Total dividends (EAs and Companies) | 38,786,024,789 | 44,091,302,000 | 38,871,074,000 | 31,479,657,000 | 52,085,357,000 | 61,754,189,000 | 65,229,049,000 | 43,977,265,000 | 376,273,917,789 | ||
| Total real estate dividends (HCCD + NUCA) | 5,039,297,537 | 4,871,896,000 | 39,700,000 | 28,100,000 | 4,840,476,000 | 5,172,598,000 | 4,823,125,000 | 5,370,066,000 | 30,185,258,537 | ||
| Real estate dividends:total | 13.0% | 11.0% | 0.1% | 0.1% | 9.3% | 8.4% | 7.4% | 12.2% | 8.0% | ||
| Sources | |||||||||||
| Company Dividends | Budget Statement FY 2019/20 p122 | Budget Statement FY 2022/2023 p138 | Budget Statement FY 2024/2025 p145 | ||||||||
| Economic Agency surpluses | Budget Statement FY 2019/20 p122 | Budget Statistical Statement FY 2020/2021 p14 | Budget Statistical Statement FY 2022/2023 p16 | Budget Statistical Statement FY 2023/2024 p14 | Budget Statistical Statement FY 2024/2025 p14 | ||||||
| HCCD Sources | See Appendices 3 & 5 | ||||||||||
Appendix 2: Comparison between the profits of NUCA and the HCCD and the dividends/surpluses paid out by them to the Treasury according to final accounts of FY 2016/2017 – 2021/2022 (LE Million).
| Fiscal Year |
2016/ 2017 | 2017/ 2018 | 2018/2019 | 2019/2020 | 2020/2021 | 2021/2022 | Total 16/17-21/22 | ||
| Actual profits | NUCA* | 4,785 | 3,126 | 8,115 | 4,770 | 5,173 | 4,823 | 30,792 | |
| HCCD | 681 | 725 | 652 | 881 | 1,229 | 1,604 | 5,772 | ||
| Total | 5,466 | 3,851 | 8,767 | 5,651 | 6,402 | 6,427 | 36,564 | ||
| Surpluses/ dividends to Treasury | NUCA | 4,785 | 0 | 0 | 4,770 | 5,173 | 0 | 14,728 | 48% |
| HCCD | 87 | 40 | 28 | 70 | 119 | 155 | 499 | 9% | |
| Total | 4,872 | 40 | 28 | 4,840 | 5,292 | 155 | 15,227 | 42% | |
| Sources | Ministry of Finance, financial statements of economic bodies in: | 30/6/2017 | 30/6/2019 | 30/6/2021 | 30/6/2022 | ||||
| *Actual profits inferred from exception to use ‘losses’ line item to fund Ministry of Housing projects as per NUCA budget laws: | 177/2017 | 133/2018 | |||||||
| HCCD Profits | Ministry of Finance, Income statements for Economic Units for FY 2015/2016 – 2018/2019 | Ministry of Finance, Income statements for Economic Units for FY 2019/2020 | Business Sector Information Center, HCCD Income Statement at 30/06/2022 | ||||||
| HCCD Surplus | Ministry of Finance, Summary of relationship between companies and the MoF for FY 2015/2016 – 2018/2019 | Projected based on actual average dividend percentages for FY 2011/2012 – 2019/2020 | |||||||
Appendix 3: Comparison between the net profits of the HCCD and the dividends paid out it to the Treasury, and the dividends paid out by subsidiaries to HCCD according to final accounts of FY 2017/2018 – 2021/2022 (LE Million).
| Fiscal Year | 2017/2018 | 2018/2019 | 2019/2020 | 2020/2021 | Total 4 years |
| Net profit after tax | 725 | 652 | 881 | 1,229 | 3,487 |
| Dividends from subsidiaries | 352 | 204 | 548 | 484 | 1,588 |
| Dividends to Treasury | 40 | 28 | 70 | 119 | 257 |
| Dividends:Total Profits | 5.5% | 4.3% | 8.0% | 9.7% | 7.4% |
| Sources: Profits | Ministry of Finance, Income statements for Economic Units for FY 2015/2016 – 2018/2019 | Ministry of Finance, Income statements for Economic Units for FY 2019/2020 | Business Sector Information Center, HCCD Income Statement at 30/06/2022 | ||
| Sources: Dividends to Treasury | Ministry of Finance, Summary of relationship between companies and the MoF for FY 2015/2016 – 2018/2019 | Projected based on actual average dividend percentages for FY 2011/2012 – 2019/2020 | |||
| Dividends from subsidiaries | See Appendix 4 | ||||
Appendix 4: Dividends paid out to HCCD by its real estate subsidiaries according to final accounts of FY 2017/2018 – 2021/2022 (LE).
| Fiscal Year | 2017/2018 | 2018/2019 | 2019/2020 | 2020/2021 | Total 4 Yrs | |
| 2017 | 2018 | 2019 | 2020 | |||
| Net profits | 1,657,868,186 | 2,056,577,648 | 2,077,371,614 | 2,041,591,539 | 5,858,131,987 | |
| Madinet Nasr Housing & Development | 933,053,186 | 1,110,376,648 | 1,000,995,614 | 988,393,539 | 4,032,818,987 | |
| Heliopolis Housing & Development | 265,347,000 | 376,390,000 | 365,557,000 | 180,152,000 | 1,187,446,000 | |
| Maadi Development & Construction | 240,706,000 | 242,160,000 | 375,021,000 | 385,000,000 | ||
| Al-Nasr Housing & Development | 117,728,000 | 120,203,000 | 200,211,000 | 294,248,000 | ||
| Al-Shams Housing & Development | 101,034,000 | 207,448,000 | 135,587,000 | 193,798,000 | 637,867,000 | |
| Shareholder Dividends | 605,450,871 | 250,315,483 | 1,195,343,989 | 1,090,196,492 | 2,349,193,062 | |
| Madinet Nasr Housing & Development | 202,899,611 | 0 | 648,000,000 | 648,000,000 | 1,498,899,611 | |
| Heliopolis Housing & Development | 222,514,200 | 44,502,839 | 280,367,892 | 133,508,520 | 680,893,451 | |
| Maadi Development & Construction* | 96,526,481 | 97,109,555 | 150,388,679 | 154,390,398 | ||
| Al-Nasr Housing & Development* | 47,210,579 | 48,203,088 | 80,287,418 | 117,997,574 | ||
| Al-Shams Housing & Development | 36,300,000 | 60,500,000 | 36,300,000 | 36,300,000 | 169,400,000 | |
| Dividends: Net Profits | 60% | 20% | 52% | 46% | 40% | |
| Madinet Nasr Housing & Development | 22% | 0% | 65% | 66% | 37% | |
| Heliopolis Housing & Development | 84% | 12% | 77% | 74% | 57% | |
| Maadi Development & Construction | NA | NA | NA | NA | NA | |
| Al-Nasr Housing & Development | NA | NA | NA | NA | NA | |
| Al-Shams Housing & Development | 36% | 29% | 27% | 19% | 27% | |
| Dividends to HCCD (Shareholding) | 351,543,581 | 204,413,090 | 548,001,423 | 483,605,932 | 1,587,564,026 | |
| Madinet Nasr Housing & Development (15.1%) | 30,869,767 | 0 | 98,588,700 | 98,588,700 | 228,047,167 | |
| Heliopolis Housing & Development (73%) | 160,768,735 | 32,153,746 | 202,568,606 | 96,461,241 | 491,952,327 | |
| Maadi Development & Construction (100%)* | 96,526,481 | 97,109,555 | 150,388,679 | 154,390,398 | 498,415,113 | |
| Al-Nasr Housing & Development (100%)* | 47,210,579 | 48,203,088 | 80,287,418 | 117,997,574 | 293,698,659 | |
| Al-Shams Housing & Development (44%) | 16,168,020 | 26,946,700 | 16,168,020 | 16,168,020 | 75,450,760 | |
| Sources | ||||||
| Madinet Nasr Housing & Development | AGM Minutes 3/4/2019 | AGM Minutes 13/4/2021 | ||||
| Heliopolis Housing & Development | AGM Minutes 10/11/2018 | AGM Minutes 30/6/2020 | AGM Minutes 18/11/2021 | |||
| Maadi Development & Construction | Ministry of Finance, Income statements for Economic Units for FY 2015/2016 – 2018/2019 | Business Sector Information Center, Maadi Co. Income Statement at 30/6/2021 | ||||
| Al-Nasr Housing & Development | Business Sector Information Center, Al-Nasr Co. Income Statement at 30/6/2021 | |||||
| Al-Shams Housing & Development | AGM Minutes 23/4/2018 | AGM Minutes 23/4/2019 | AGM Minutes 22/4/2020 | AGM Minutes 9/5/2021 | ||
| *Due to lack of data, dividends estimated based on average paid out by the three other companies over four years **AGM: Annual General Meeting |
||||||
Appendix 5: Detailed profit distribution for HCCD according to final accounts of FY 2011/2012 – 2015/2016 (LE).
| Fiscal Year | 2011/2012 | 2012/2013 | 2013/2014 | 2014/2015 | 2015/2016 | Total 5 years | |
| Net profit after tax | 374,195,544 | 379,032,644 | 335,169,870 | 394,804,875 | 688,862,768 | 2,172,065,701 | |
| Legal reserves 5% | 18,708,449 | 18,940,095 | 16,756,111 | 19,740,244 | 34,438,382 | 108,583,281 | |
| Statutory reserves 20% | 74,833,796 | 75,760,380 | 67,024,444 | 78,960,976 | 137,753,528 | 434,333,124 | |
| Other reserves | 218,295,081 | 221,502,688 | 190,409,422 | 24,219,296 | 43,377,254 | 697,803,741 | |
| Forwarded reserves | 26558 | 230750 | 47,650 | 0 | 0 | 304,958 | |
| Total reserves | 311,863,884 | 316,433,913 | 274,237,627 | 122,920,516 | 215,569,164 | 1,241,025,104 | |
| Distributable profits | 62,331,660 | 62,598,731 | 60,932,243 | 271,884,359 | 473,293,604 | 931,040,597 | |
| Shareholder dividends | 40,673,956 | 40,752,556 | 40,728,556 | 64,728,556 | 81,272,748 | 268,156,372 | |
| Employee share | 10,168,489 | 10,188,139 | 10,182,139 | 16,182,139 | 13,230,447 | 59,951,353 | |
| Board of Directors | 11,489,215 | 11,658,036 | 10,021,548 | 3,000,000 | 3,300,000 | 39,468,799 | |
| Total distributions | 62,331,660 | 62,598,731 | 60,932,243 | 83,910,695 | 97,803,195 | 367,576,524 | |
| Retained profits | 0 | 0 | 0 | 187,973,664 | 375,490,409 | 563,464,073 | |
| Fiscal Year | 2011/2012 | 2012/2013 | 2013/2014 | 2014/2015 | 2015/2016 | Average 5 years | |
| Legal reserve 5% | 5.0% | 5.0% | 5.0% | 5.0% | 5.0% | 5.0% | |
| Statutory reserve 20% | 20.0% | 20.0% | 20.0% | 20.0% | 20.0% | 20.0% | |
| Other reserves | 58.3% | 58.4% | 56.8% | 6.1% | 6.3% | 32.1% | |
| Total reserves | 83.3% | 83.5% | 81.8% | 31.1% | 31.3% | 57.1% | |
| Distributable profits | 16.7% | 16.5% | 18.2% | 68.9% | 68.7% | 42.9% | |
| Shareholder dividends | 10.9% | 10.8% | 12.2% | 16.4% | 11.8% | 12.3% | |
| Employee share | 2.7% | 2.7% | 3.0% | 4.1% | 3.4% | 2.8% | |
| Board of Directors | 3.1% | 3.1% | 3.0% | 0.8% | 0.8% | 1.8% | |
| Total distributions | 16.7% | 16.5% | 18.2% | 21.3% | 14.2% | 16.9% | |
| Retained profits | 0.0% | 0.0% | 0.0% | 47.6% | 54.5% | 25.9% | |
| Retained profits + reserves | 83.3% | 83.5% | 81.8% | 78.7% | 85.8% | 82.6% | |
| Sources: Ministry of Finance, HCCD final accounts, profit distribution list at: | 30/6/2013 | 30/6/2015 | 30/6/2016 | ||||
Appendix 6: NUCA total revenues, revenues from investments, and surplus paid out to the Treasury according to final accounts of FY 2015/2016 – 2022/2023 (LE Billion).
| Fiscal Year | 2016 /2015 | 2017 /2016 | 2018 /2017 | 2019 /2018 | 2020 /2019 | 2021 /2020 | 2022 /2021 | 2023 /2022 | Total |
| Total Revenue | 26.0 | 26.9 | 40.2 | 51.6 | 57.1 | 61.3 | 67.1 | 108.9 | 439.0 |
| Investments Revenue | 6.5 | 9.2 | 8.6 | 8.5 | 7.2 | 4.7 | 1.0 | NA | 45.6 |
| Government Surplus |
5.0 | 4.8 | 0.0 | 0.0 | 4.8 | 5.2 | 4.8 | 5.4 | 29.9 |
| Surplus: Revenue % | 19% | 18% | 0% | 0% | 8.4% | 8.4% | 7.2% | 4.9% | 6.8% |
| Sources: NUCA Final accounts | MoF, Income statements for economic agencies at 30/6/2017 | MoF, Income statements for economic agencies at 30/6/2019 | MoF, Income statements for economic agencies at 30/6/2022 | Law 66/2023 NUCA Final Accounts FY 2021/2022 | MoF, Budget Statistical Statement FY 2024/2025 (At 97% of Building & construction sector) | ||||
Notes and sources
[1] Even though 17 real estate SOEs were analysed for revenue in Taamir Part 1, we were only able to isolate 14 of them due to available data that can show profit flow. Of the 14, four were directly related to the Treasury, and of the four, two were much larger than the other two, holding interests in ten other SOEs.
[2] Public Sector Business Companies Law 203/1991 (Ch. 5), and its bylaws (Arts. 35-43).
[3] All financial data in this study adhere to the original bylaws. In 2021 these bylaws were amended omitting set percentages for dividends paid out to employees or the BoD. See: Amended bylaws as per Prime Ministerial Decree 948/2021.
[4] Although HCCD income statements are available for later dates, these were the only ones that showed how profits were distributed.
[5] “The Financial Results and the analysis of the Financial Statements and the Closing Accounts of the Economic Units for FY 2019/2020.” . Ministry of Finance, 2021. p28.
[6] “The Financial Results and the analysis of the Financial Statements and the Closing Accounts of the Economic Units for FY 2019/2020.” Ministry of Finance, 2021. p17.
[7] Unified Public Finance Law 6/2022. Art. 47, and: New Urban Communities Law 49/1979
[8] Statistical Statement for Economic Agencies for the State General Budget for FY 2023/2024. Ministry of Finance, 2023. p47-48.
[9] Law 133/2018 Enacting the Budget of the New Urban Communities Authority for FY 2018/19, and: New Urban
Communities Authority Board Decree 183 of 11 October 2023.
[10] Yasmine Fawaz, “Details of Ministry of Housing Discussions with Parliament Planning Committee over new budget” (Arabic). Al-Mal, May 31, 2022.
[11] The most recent SHMFF budget shows LE 39.9 Bn in revenue, in addition to LE 32 Bn for ‘buying assets’ (the housing units), as well as LE 10.2 Bn in subsidies (that go towards buying the unts). See: SHMFF Budget for FY 2023/2024.
[12] “Government approves that SHMFF incurs maximum 10%of cost overruns for Housing All Egyptians” (Arabic). Al-Mal, August 20, 2023.
[13] Social Housing Law 93/2018. Art 15.
[14] See for example: Invest-Gate, ‘Two Protocols Signed to Develop El Mawardy, Maspero Triangle’, Invest-Gate, 9 July 2018.
[15] “Joint Report on the Fiscal Performance of State-owned Companies”. Ministry of Finance. December, 2018. p626.
[16] Presidential Decree 57/2016.
[17] “Consolidated Financial Report for FY 2023”, Housing and Development Bank. p58.
[18] “Consolidated Financial Report for FY 2023”, Housing and Development Bank. p49, and: “Hyde Park and City Edge models of partnership”., Al-Mal. 28 March, 2018.
[19] Public Business Sector Law 203/1991, Art. 3.
[20] “The Financial Results and the analysis of the Financial Statements and the Closing Accounts of the Economic
Units for FY 2019/2020.” (Arabic). Ministry of Finance, 2021. p103.
[21] Law 185/2020, amending the Public Business Sector Law.
[22] The Closing Accounts of FY 2022/2023, Ministry of Finance. Revenue from shares.
[23] Law 159/2023 Annulling Tax Exemptions of State-Owned Enterprises in Investment and Economic Activities.
[24] “The Decrees approved by the Supreme Council for Investment Held under the Chairmanship of President El-Sisi on May 16, 2023.” Ministry of Investment, May 16, 2023.
[25] “First Review of the State Ownership Policy.” Cabinet. August 2023. p24.
[26] Law 18/2024, Amending the Unified Public Budget Law.
[27] “Financial Statement for the State General Budget in FY 2024/2025.” Ministry of Finance. April 19, 2024. And: Statistical Statement for Economic Entities in FY 2024/2025.” Ministry of Finance. April 17, 2024.
[28] “State Ownership Policy.” Cabinet. December 2022. p22.