
- Published on 13 March 2025
In the fourth annual issue of Who Build Egypt’s Housing, we analyse housing construction statistics up to the most recent year for which data is available, 2022/2023. This is the only analysis that shows the activities of all three main sectors that build housing in Egypt: The informal private sector, the formal private sector and the public sector, combining CAPMAS data on the two formal sectors with the Ministry of Electricity’s data on the number of annual household subscriptions.
For the first time, the report is divided into three distinct parts: The first gives an overview of the housing sector as a whole, analysing data at the one-year, medium-term (five years) and long-term (16 years) levels. The second part focuses on the public sector, both social and investment (for-profit) housing. In the third part, the report analyses construction in New Cities versus the existing cities and villages, in the short and long term (up to ten years), as well as more detailed views of the public sector, social housing and formal private sector.

Contents
Part One: Overview of the Housing Sector
Part two: Public Sector Housing
Part Three: Housing in New Cities versus Existing Cities
Executive Summary
Housing Overview Production Boost
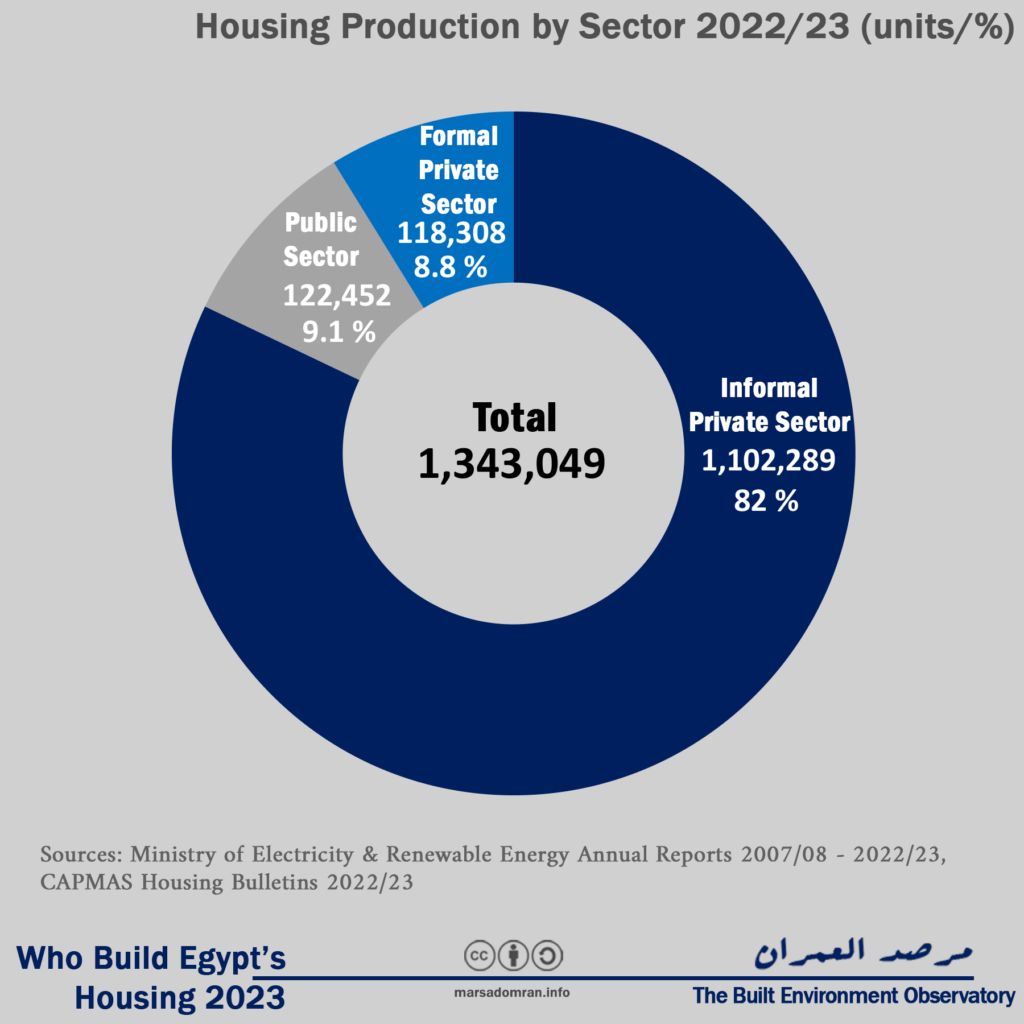
– Around 1.3 million housing units were built in Egypt in 2022/2023, a 21 % jump on the previous year, and the highest number of new homes in the last five years.
– The informal private sector accounted for the lion’s share of production, or 82 % of total units. The public sector came in second place, with 122,452 units or 9.1 % of the total housing stock, while the formal private sector came in third with 118,308 units, or only 8.8 %.
– The rebound in production was mostly the result of a recovery in the informal private sector, which jumped 27 % over the previous year. The formal private sector rose only marginally (3 %), with the public sector seeing a slight decline of 6 %.
– Despite this decline, public sector production remained higher than that of the formal private sector for the second consecutive year, indicating that the government has become the leading producer of formal housing units.
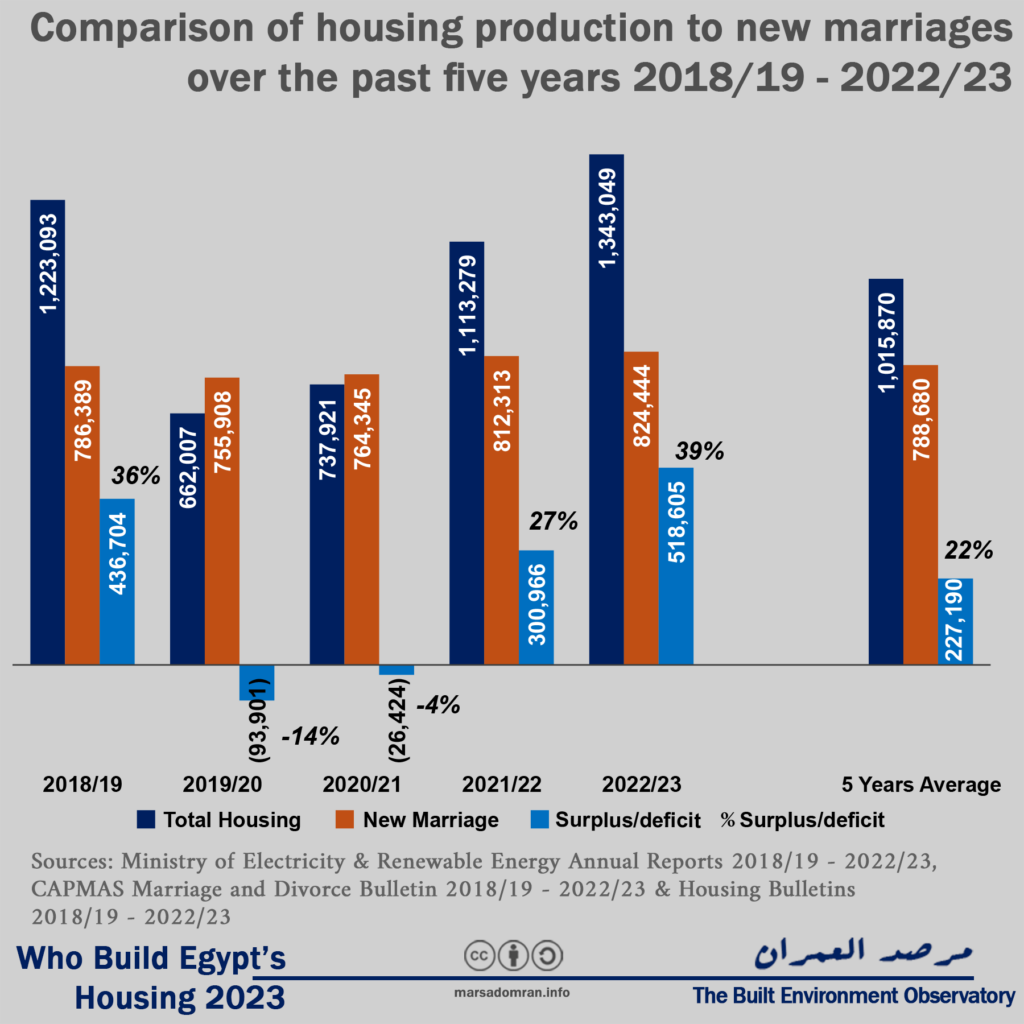
– Housing production exceeded the number of new marriages in three of the past five years, with an average of 22 % more units than marriages, or about 227,000 surplus units per year.
– Overall, the statistics indicate how poor and low-income people are increasingly turning to informal housing to fulfil their housing needs, in light of rapidly rising prices of formal, private and public sector housing.
Public sector: Rising for-profit, falling social housing
– Over the past ten years, several state-owned enterprises (SOEs) working in housing and real estate have produced 950,000 housing units, at an average of 95,000 units per year.
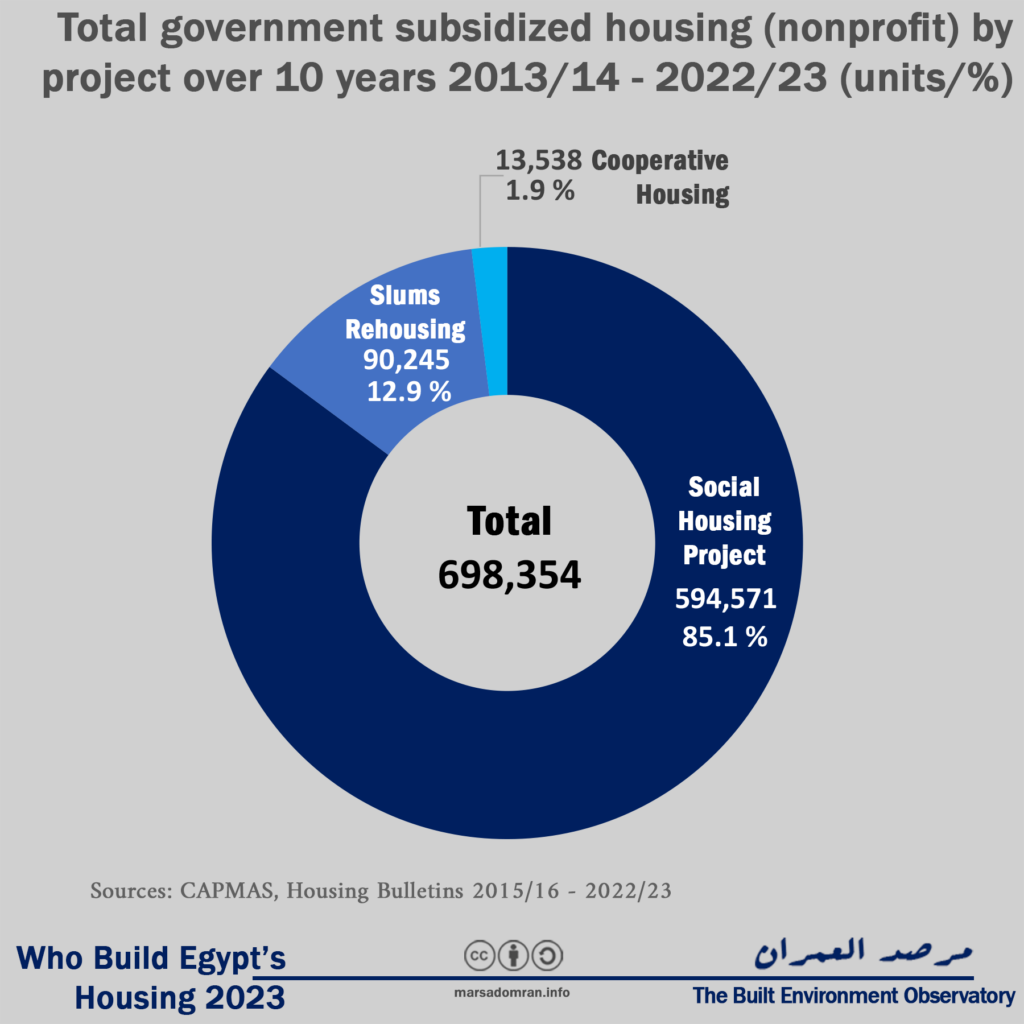
– Non-profit or subsidised housing units (social housing, slum-clearance rehousing, and cooperative housing) represented 73% of government housing production over the last ten years, at 698,354 units, or an average of 70,000 units per year.
– The social housing project known as ‘Housing for all Egyptians’ accounted for 85 % of subsidised housing or 594,571 units over ten years.
– In contrast, for-profit units comprised 27% of government production over the last ten years, or 252,947 units, two-thirds of which were built by the New Urban Communities Authority (NUCA).
– The analysis shows an unprecedented expansion of the government-built for-profit housing over the last decade, rising from 4% of production in 2013/14 to 58% in 2022/23, where production of for-profit housing surpassed that of subsidized housing for the first time in history.
– This may be indicative of a future trend where SOEs expand their activity in the real estate sector.
Comparing production in existing urban centres with New Cities
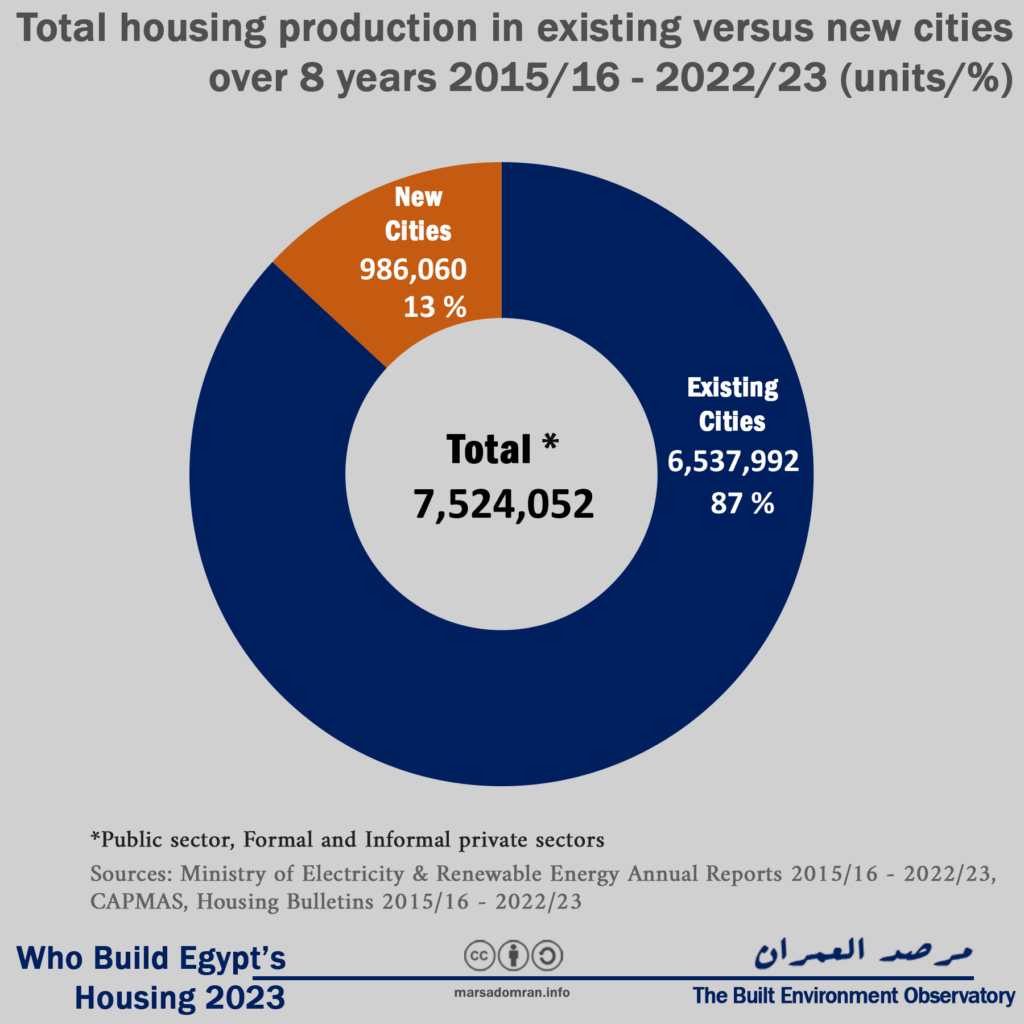
– Over the past eight years, housing production in existing cities and villages accounted for 87% of production, or 6.5 million units. On the other hand, only 13 % of housing units were built in New Cities over that timeframe, or nearly one million units. This is not surprising given that the informal private sector, the largest producer of housing, builds the majority of its units in villages and existing cities.
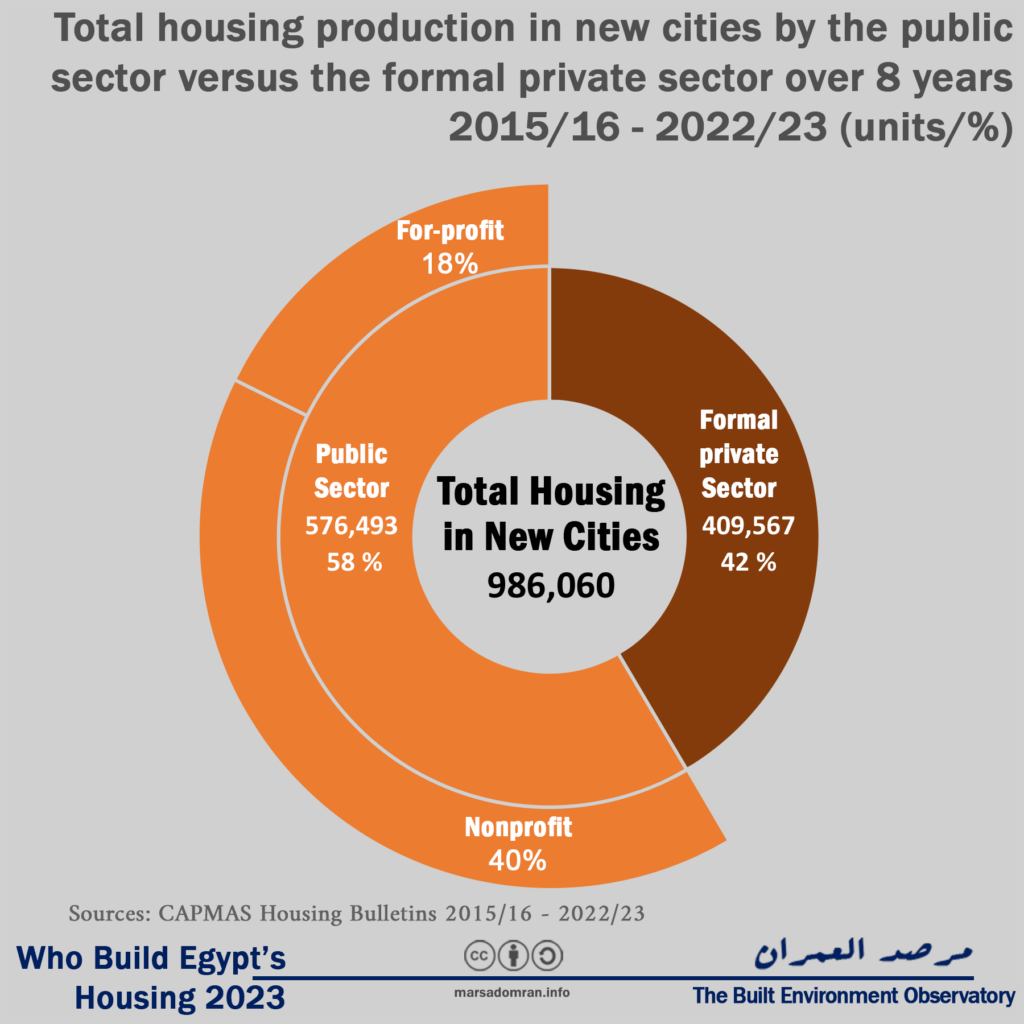
– The government was the largest producing of housing in New Cities over the past eight years, building 576,493 of units there (58%), compared to 409,567 units built by for the formal private sector, or 42%.
– Overall, 40% of housing built in New Cities was social housing, while the rest was for-profit housing.
– This is a reflection of how the government has favoured building 78% of all its social housing in New Cities over the past eight years, over building in exiting cities and villages, as land there is state-owned desert, that is cheaper than land in existing cities.
– The formal private sector of both companies and individuals, on the other hand, built 68% of its production, or 889,554 units, in existing cities over the last eight years.
– However, this trend could be changing, where on an annual basis, formal private sector construction in New Cities surpassed that in existing cities for the first time in history last year (2022/2023), with 95,822 units, accounting for 81 % of total production during the year.
– This drastic change could be attributed to the government’s imposition of exceptional zoning requirements in 2021, which significantly curtailed formal private construction in existing cities.
Part One: Overview of the Housing Sector
More than one million housing units built… for the second consecutive year
Around 1.3 million housing units were built in Egypt in 2022/2023 (Figure 1, Appendix 1). Three main producers were involved in construction: The informal private sector is by far the largest producer, having built 1,102,289 units, comprising a staggering 82 % of the total. These homes were built by individuals or contractors without obtaining a building permit, mostly on their own agricultural land, and to a lesser extent within existing cities, as well as on squatted desert land. The public sector came in second place, with 122,452 units built, accounting for 9.1 % of total production during the year. State-owned enterprises (SOEs) built subsidised housing, as well as a growing range of for-profit housing and real estate projects. The smallest housing producer was the formal private sector, which produced 118,308 units, accounting for only 8.8 % of total housing production. The formal private sector is defined as officially licensed construction, from developers of all sizes, and a near-absence of individuals.
Figure 1: Housing production by sector in 2022/23 (Units/%)
Construction boom… Informal only
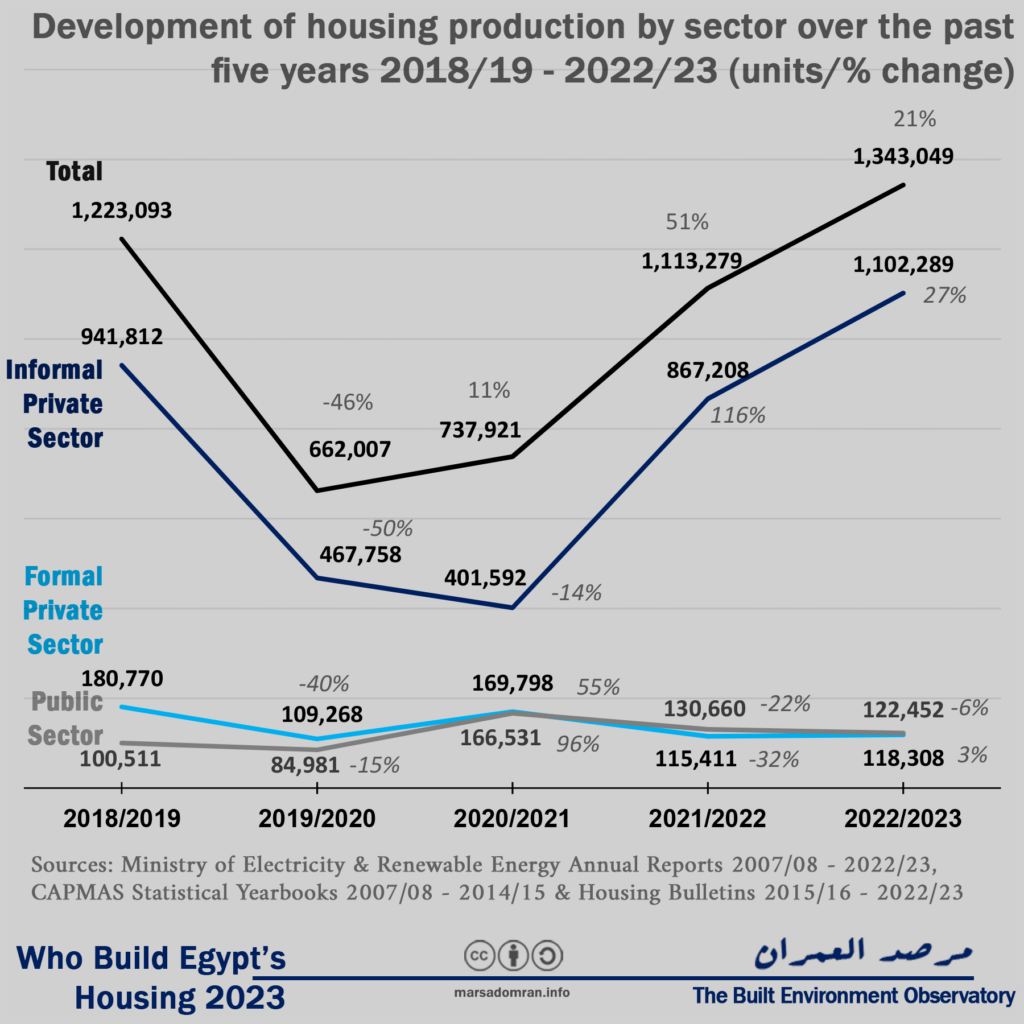
In 2022/2023, total housing production jumped by an average of 21 % compared to the previous year, the highest rate in the last five years (Figure 2). However, this jump was mainly due to informal private sector activity, which continued to increase its output, rising by 27 % compared to the previous year. This could mean that the government has resorted to tacitly allowing informal construction after widespread crackdowns over the past two years,[1] especially with the passage of the Construction Violations Reconciliation Law and the cancellation of the building ban imposed during the COVID-19 pandemic. [2] However, it should be emphasised that these figures do not necessarily reflect actual housing production during that particular period, as they rely on electricity subscription statistics, but they may represent informal housing built in previous years that was only allowed official electricity subscriptions in a given year (See App. 1 Methodology).
On the other hand, formal housing production rose slightly, with the formal private sector advancing by 3%, after falling by about a third in the previous year. The public sector, on the other hand, saw a slight decline of 6 %, continuing a downward trend that began the year before last. Despite the decline, public sector output remained higher than the formal private sector for the second consecutive year.
Figure 2: Development of housing production by sector over the past five years 2018/19 – 2022/23 (Units/% change)
Housing production outpaced marriages in the medium term
Housing production has outpaced new marriages, the only index for demand, in three of the last five years, with an average of 22% more units than marriages, or about 227,000 surplus units per year (Figure 3, Appendix 9). [3] In 2022/23, 1.3 million units were produced against 824,000 new marriages, leading to a simple quantitative surplus production of over half a million units. In 2019/20 and 2020/21 there were small deficits of 14 % and 4 % on the number of marriages. In general, the annual number of marriages is not a direct indicator of housing need in the year of marriage as the search process to buy or build takes several years prior to the event. Also, a number of marriages rely on already ready housing (closed housing) or are renting. Therefore, the marriage index is only an indirect indicator used for the lack of a more accurate one.
Figure 3: Comparison of housing production to new marriages over the past five years 2018/19 – 2022/23
Long-term declining trend of formal sectors
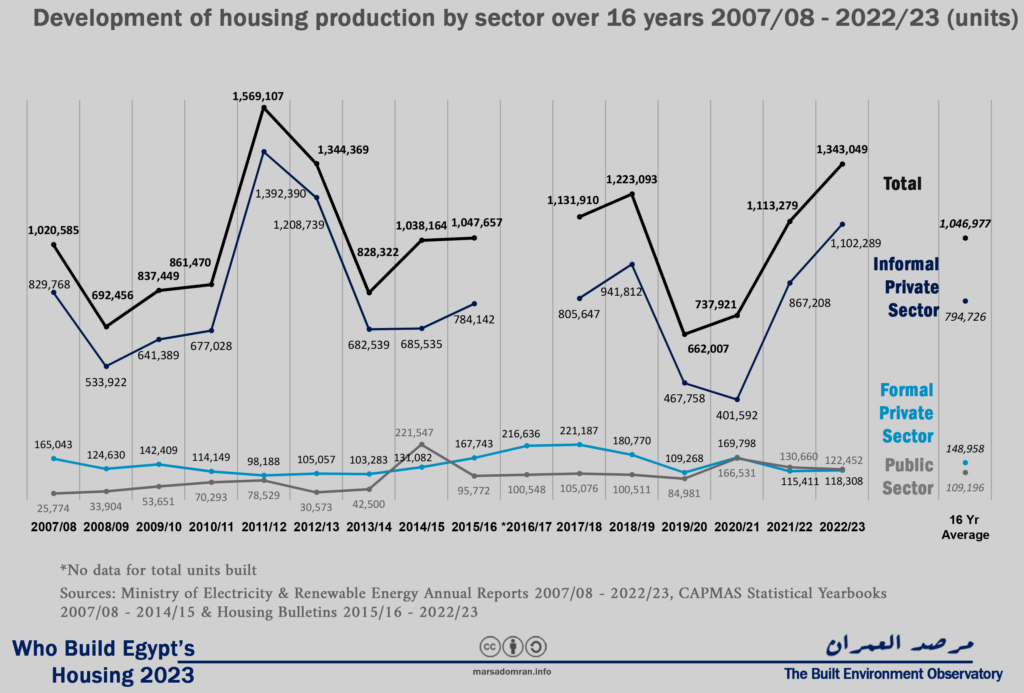
Looking at long-term data covering 16 years of statistics, we can observe two major developments in 2022/23. The first is that the informal private sector has resumed its long-term position, producing slightly above its eleven-year average of one million units per year (Figure 4, Appendix 3; for analyses of past trends, see previous editions of Who Build Egypt’s Housing).
On the other hand, for only the third time in sixteen years, the formal private sector produced fewer units than the public sector, [4] meaning that the government has become the second largest housing producer in Egypt, and the leading producer of formal housing units.
In terms of unit numbers, with a total of 118,308 units, the formal private sector produced homes at a rate about one-fifth lower than its 16-year average of 150,000 units per year, continuing a downward trend after peaking at 221,000 units in 2017/18, six years ago, a worrying development. In contrast, the public sector’s output of 122,452 units was 12 % higher than its 16-year average, albeit slightly lower than last year, and its fourth highest output in more than a decade and a half, suggesting that the sector is holding steady around these figures.
Figure 4: Development of housing production by sector over 16 years 2007/08 – 2022/23 (Units)
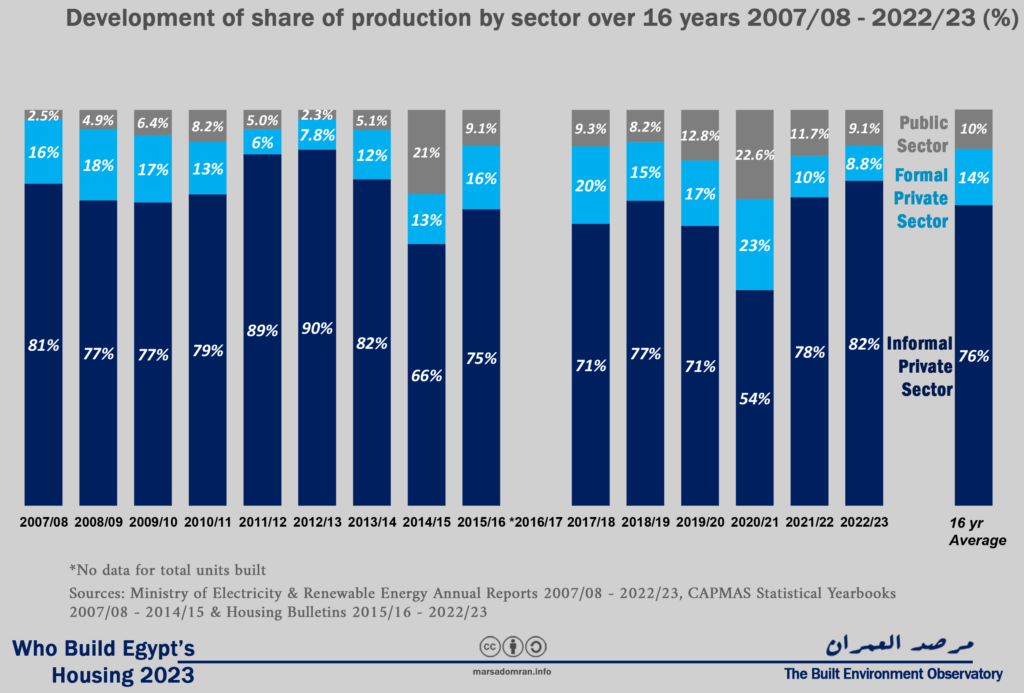
In terms of production share, informal private sector production rose again above its eleven-year average of 76 % to reach 82 %, its highest share since 2012/13 (Figure 5). The public sector came in a distant second, accounting for 9.1 % of housing production, slightly below its eleven-year average of 10 %. In third place was the formal private sector with just 8.8 % of housing production, a third less than the eleven-year average and the lowest level in ten years.
Figure 5: Development of share of production by sector over 16 years 2007/08 – 2022/23 (%)
Part two: Public Sector Housing
Significant rise in for-profit housing
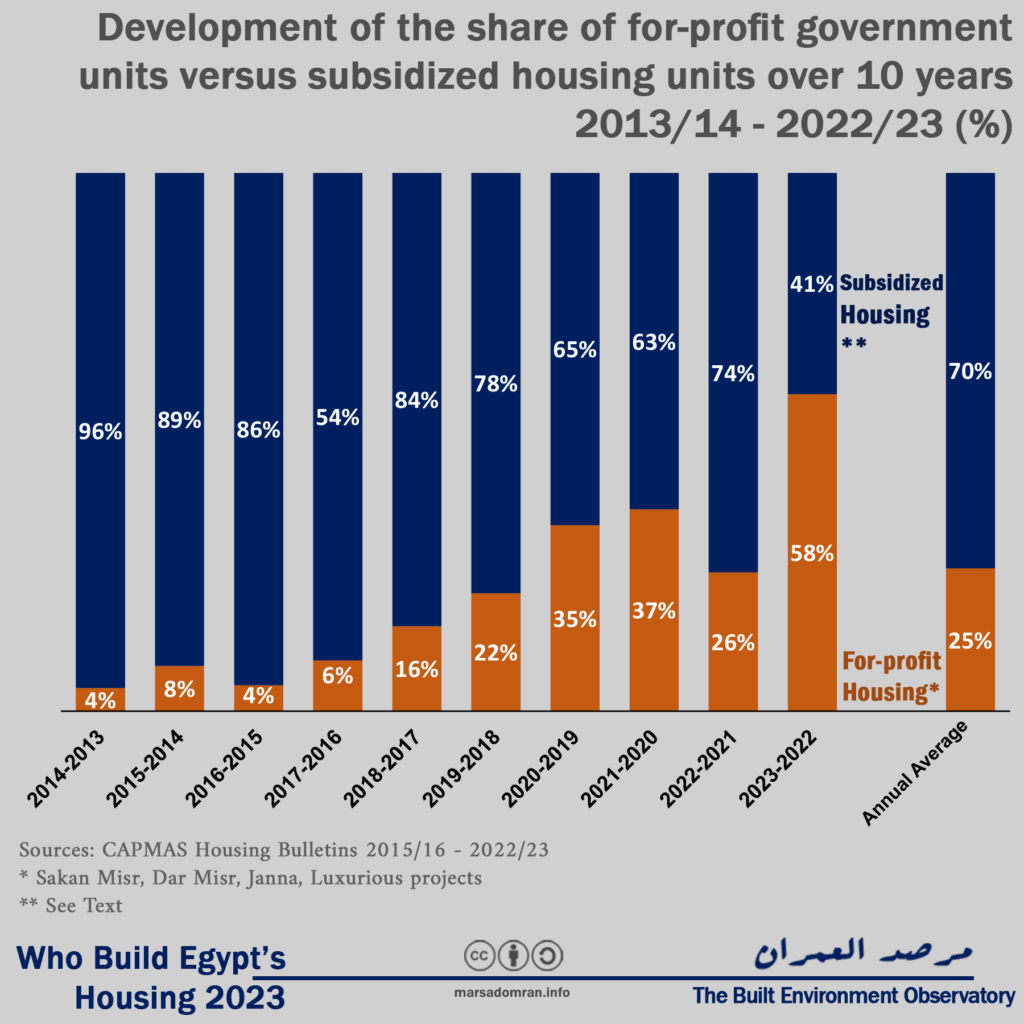
Over the past ten years, there has been a gradual rise in the construction of for-profit housing by state-owned enterprises (SOEs), such as Sakan Misr, Jannah, Dar Misr and luxury housing projects, as opposed to non-profit or subsidized housing such as the Social Housing Project/ Housing for All Egyptians, cooperative housing and slum-clearance rehousing. Nine years ago, the share of subsidized housing dominated public sector production at 96 %, compared to only 4 % for for-profit housing (Figure 6, Appendix 4). As SOEs, led by the New Urban Communities Authority (NUCA), expanded in for-profit housing projects, this type of housing gradually increased until it overtook subsidized housing, accounting for 58 % of total public sector output in the last year 2022/23. Although it has fluctuated slightly over the last ten years, for-profit housing has accounted for an average of 25 % of the government’s housing production during that time, indicating that it looks to remain the government’s main product alongside subsidized housing.
Figure 6: Development of the share of for-profit government units versus subsidized housing units over 10 years 2013/14 – 2022/23 (%)
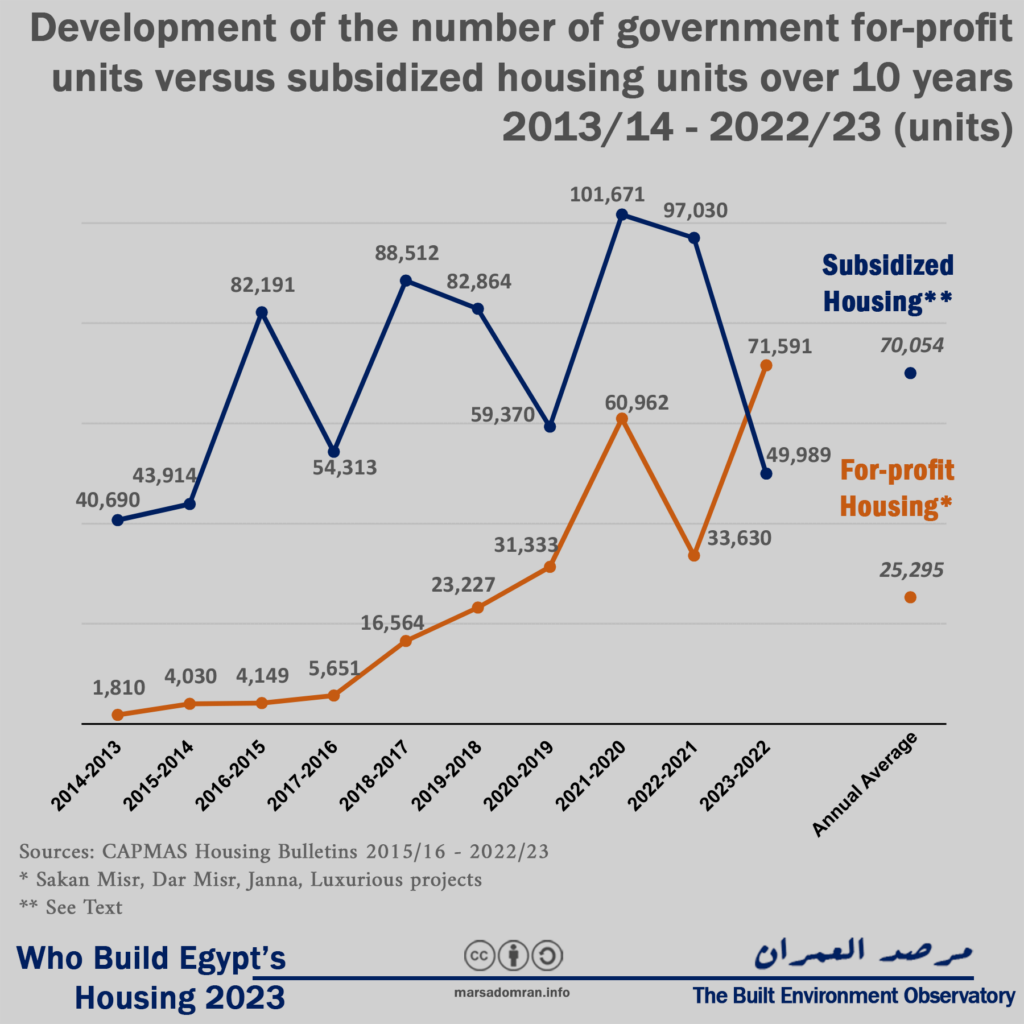
Looking at the number of units produced, the production of subsidized housing of all types fluctuated in an upward direction over the past ten years, from roughly 40,000 units in 2013/2014 to a peak of 101,000 units in 2020/2021, starting a downward trend over the past two years dropping to 50,000 units in 2022/2023, or 40% below its average for the decade (Figure 7, Appendix 4).
In contrast, SOE for-profit housing was just under 2,000 units in 2013/2014, gradually increasing until 2015-2016, before rapidly rising until it peaked in 2022/2023 at 71,000 units, surpassing for the first time in history the government’s production of subsidized housing, achieving a decade-long average of about 25,000 units per year.
Figure 7: Development of the number of government for-profit units versus subsidized housing units over 10 years 2013/14 – 2022/23 (units)
For-profit public sector projects
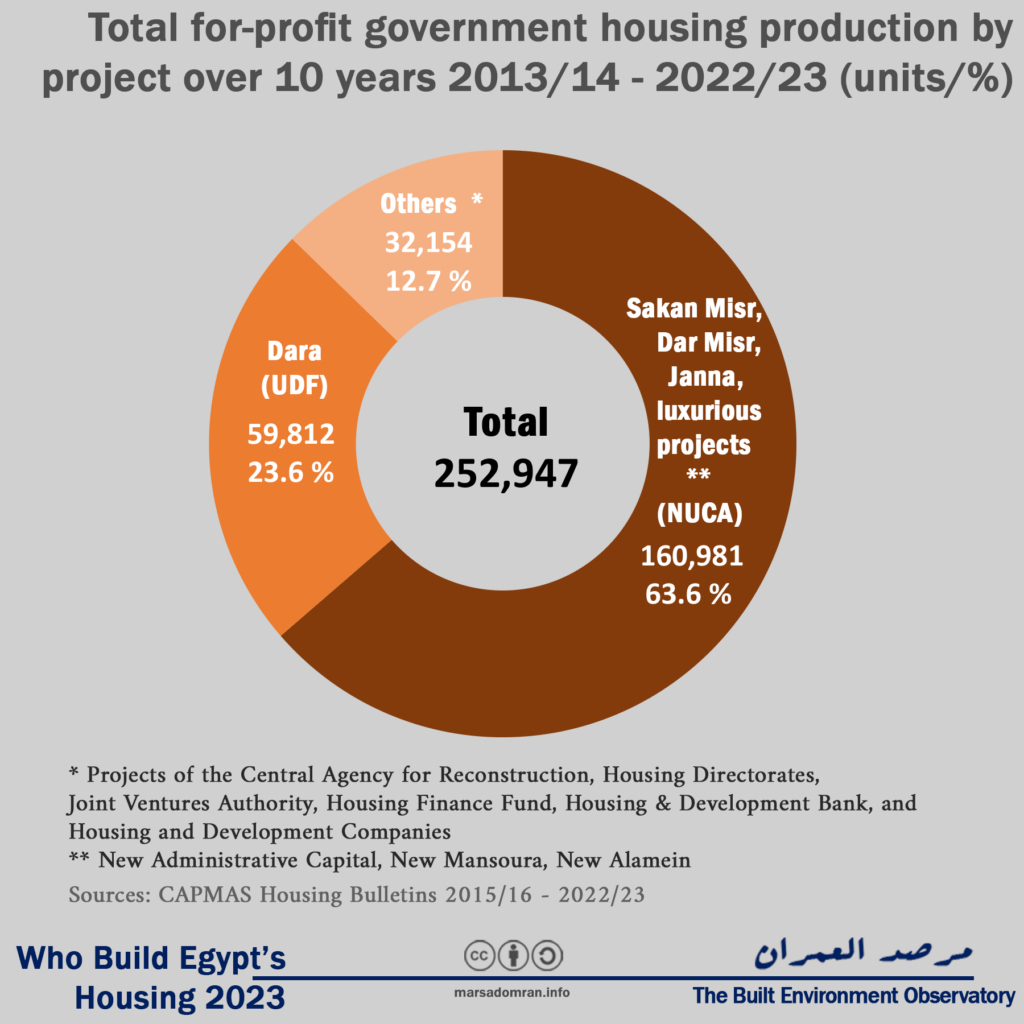
Housing SOEs produced a quarter of a million for-profit housing units over the past ten years (Figure 8, Appendix 5). The Ministry of Housing’s NUCA, accounted for the lion’s share of units, or two-thirds of production, with projects such as Sakan Misr, Dar Misr and Jannah, as well as luxury housing projects in the New Administrative Capital, New Alamein, New Mansoura and other cities, targeting middle- and upper-middle-income buyers. [5] The Urban Development Fund (UDF) ranked second in the production of for-profit housing with an average of 23 % of the units produced over the past ten years, or 60,000 units. This is despite that the UDF was recently established in 2021, by restructuring the Informal Settlements Development Fund (ISDF) from a public service agency that only builds slum-clearance rehousing, to an economic SOE that builds for-profit housing and sells it on the market, led by the Dara project that was built as part of the project to develop governorate capitals in some 13 governorates.
In addition to these two SOEs, are several, relatively smaller agencies that build for-profit housing ranging from mid-range to luxury: the housing and construction companies affiliated with the Holding Company for Construction and Development, including Maadi Housing and Development, Nasr Housing and Development, among others, the Joint Ventures Authority, and the Housing Finance Fund, which are affiliated with the Ministry of Housing, the Housing and Development Bank, which is listed on the stock exchange but controlled by the Ministry of Housing, and to a much lesser extent, the Ministry of Housing’s Central Agency for Construction, and the Governorate Housing Directorates (For more on them see our Taamir Series). These smaller SOEs accounted for only 13 % of the government’s for-profit production over the past ten years, or 32,000 units.
Figure 8: Total for-profit government housing production by project over 10 years 2013/14 – 2022/23 (units)
Public Sector subsidized/non-profit housing
Total production of non-profit or subsidized government housing over the last ten years has reached about 700,000 units (Figure 9, see Appendix 6), at an average of 70,000 units per year. These include three main projects led by the Social Housing Project/Housing for All Egyptians, which accounted for 85 % of the subsidised housing, or 594,000 units. While the project is managed by the Ministry of Housing’s Social Housing and Mortgage Finance Fund (SHMFF), but NUCA, the Central Construction Agency, and the governorate housing directorates implement the units and then sell them to the fund, so these entities appear in the official statistics rather than the fund.
The slum-clearance rehousing comes in second place in non-profit housing production, with a 13 % share of production, or 90,000 units over the past ten years. The majority of these units were built by the ISDF in several governorates, including the Asmarat housing estate in Cairo, Bashayer al-Khair in Alexandria, and Zirzara in Port Said. After the fund was restructured in 2021 as the Urban Development Fund (UDF), focus shifted to for-profit housing (see previous paragraph), in addition to minor rehousing projects that were either started under the ISDF and completed under the UDF, or completely new ones.
In third place is cooperative housing with a share of less than 2% or 13,000 units built over the last ten years. Cooperative housing sometimes benefits from government subsidies on land prices and cooperative loans. The General Authority for Building and Housing Cooperatives builds a portion of it and manages cooperative housing associations, which in turn build cooperative housing under conditions governed by law, but their role has declined significantly over the last two decades. [6]
Figure 9: Total government subsidized housing by project over 10 years 2013/14 – 2022/23 (units/%)
Part Three: Housing in New Cities versus Existing Cities
This section analyses housing production statistics between existing cities and villages and New Cities.[7] It also analyses two of the three sectors that produce housing. The first is the formal private sector, and the second is the public sector through the social housing project, since the rest of its projects are mainly built in New Cities. As for the informal private sector, since the majority of its units are built in existing villages and cities, and statistics cannot show the number of informal units in New Cities (rooftop and basement construction), we could not analyse it in this section.
Of the 7.5 million units built by all sectors over the past eight years, [8] housing production in existing urban areas (towns and villages) accounted for 87 % of production, or 6.5 million units (Figure 10, see Appendix 6). In New Cities, only 13 % of the units were built there, or close to one million units. This is not surprising, as New Cities are home to only 1.7 % of the population and the informal private sector builds the majority of its units mainly in existing towns and villages.
Figure 10: Total housing production in existing versus new cities over 8 years 2015/16 – 2022/23 (units/%)
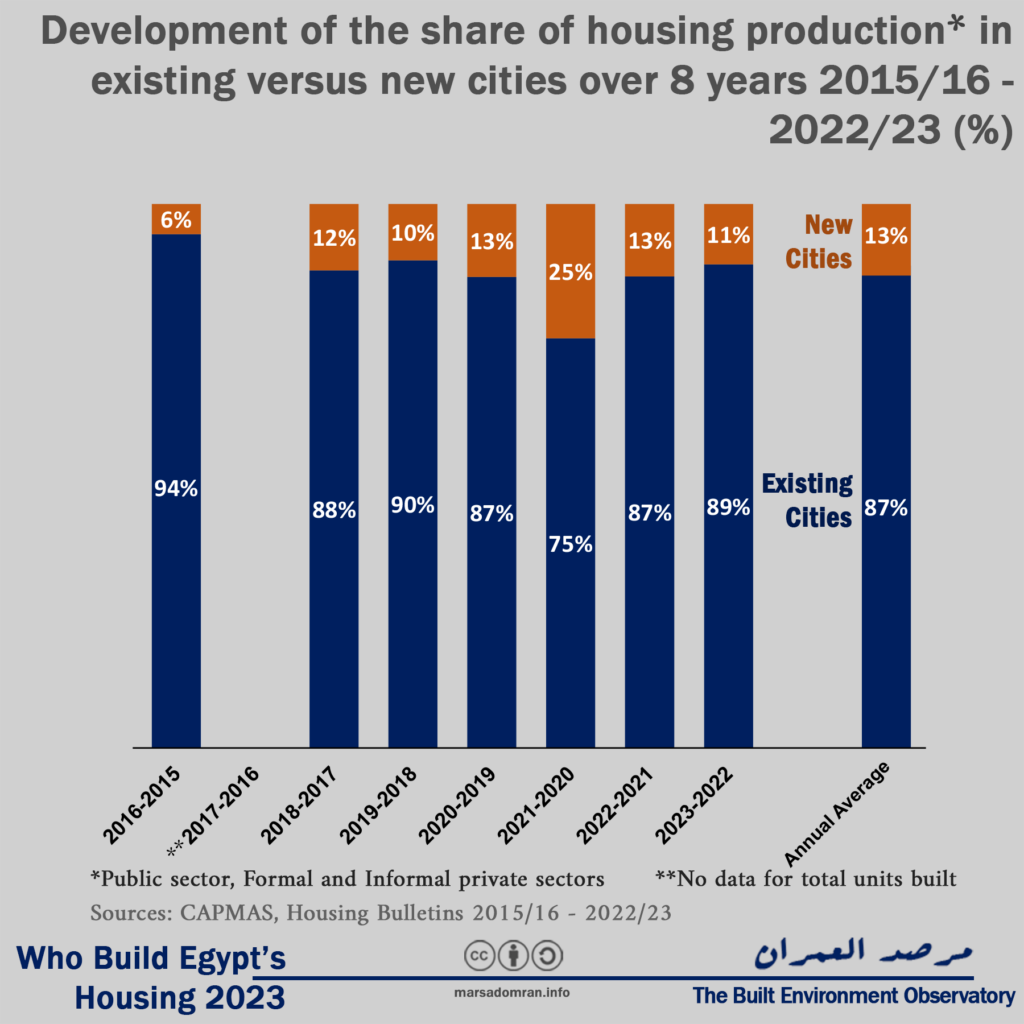
In terms of the evolution of the distribution of housing production between New Cities and existing urban areas during the past period, production in New Cities increased gradually but significantly between 2015/16 until it peaked in 2020/21 with a 25% share of production (Figure 11, Appendix 6), a year in which the effects of the decisions to stop construction in existing urban areas and the massive campaigns to demolish informal construction during the Corona pandemic became apparent. After that, the production of units in existing urban areas started to rise again, reaching 89 % last year, compared to 11 % in New Cities.
Figure 11: Development of the share of housing production in existing versus New Cities over 8 years 2015/16 – 2022/23 (%)
Comparing the Public and Private Sectors in New Cities
Of the nearly one million units built in New Cities over the past eight years, 576,000, or 58 %, were built by the public sector, compared to the formal private sector, which built 409,000 units, or 42 % (Figure 12, Appendix 8). Social housing units accounted for 70% of the public sector’s production in New Cities, or 40% of the total units produced there over the past eight years, compared to 30% for for-profit units, or 18% of total production there.
Figure 12: Total housing production in New Cities by the public sector versus the formal private sector over 8 years 2015/16 – 2022/23 (units/%)
Social Housing in New Cities versus Existing Cities
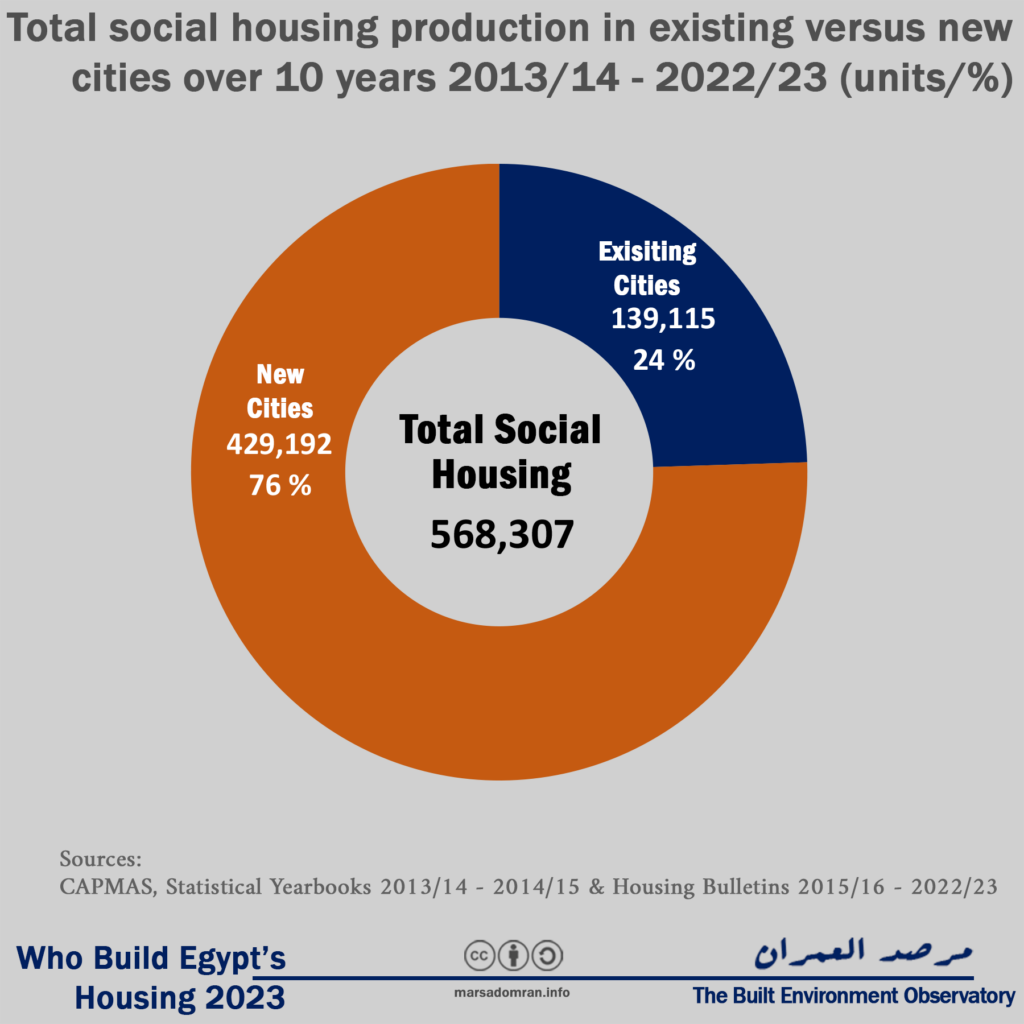
Out of 568,000 units built for the Social Housing Project (SHP) over the past ten years, 76% were built in New Cities by NUCA, representing some 429,000 units (Figure 13, Appendix 6). The share of existing urban areas was 24 %, or 139,000 units, built by the Central Agency for Construction and the housing directorates of the governorates.
Figure 13: Total Social Housing Project (SHP) production in existing versus New Cities over 10 years 2013/14 – 2022/23 (units/%)
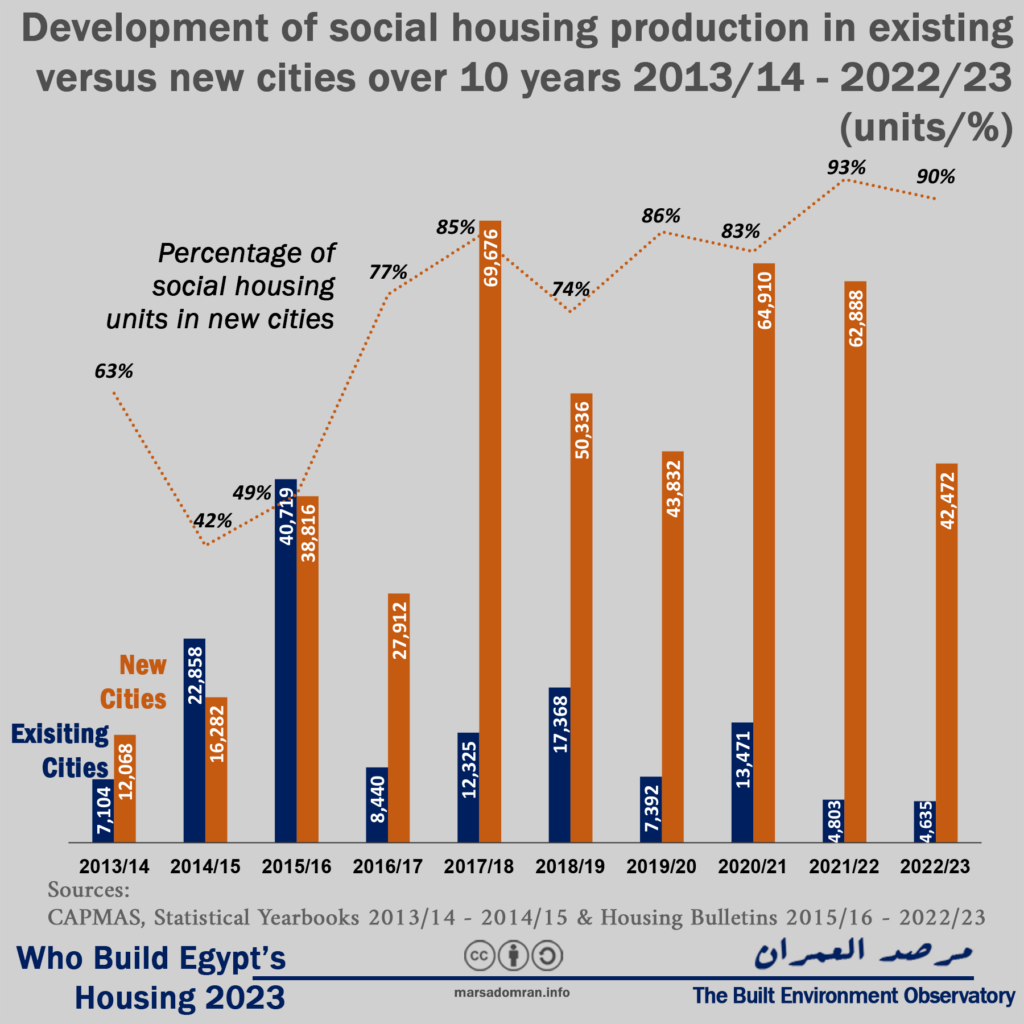
We can also observe how the distribution of SHP units between existing cities and New Cities evolved over the past ten years, with existing cities taking the lead up until 2015/2016, where they peaked at 40,000 units (Figure 14, Appendix 7). Since then, annual production in existing cities heavily declined, reaching a low of 4,635 units in 2022/23, while SHP units in New Cities grew and stayed high peaking at 70,000 units mid-decade, before slowly declining to 42,000 units last year, which was still 90 % of total annual production.
SHP dominance in New Cities can be explained by two factors. The first is the greater and easier availability of vacant land in New Cities, which are usually built on desert land on the margins of the Nile Valley and its delta, compared to the limited space in existing cities, especially state-owned land, as well as the complexity of the expropriation process and the importance of preserving agricultural land. The second reason could be NUCA’s strong financial resources compared to the two other government agencies. However, with the concentration of poor and low-income people in existing urban areas, and the locations of SHP units in very remote areas, reduce its ability to meet the needs of these households.
Figure 14: Development of Social Housing Project (SHP) production in existing versus New Cities over 10 years 2013/14 – 2022/23 (units/%)
Formal private sector in New Cities versus Existing Cities
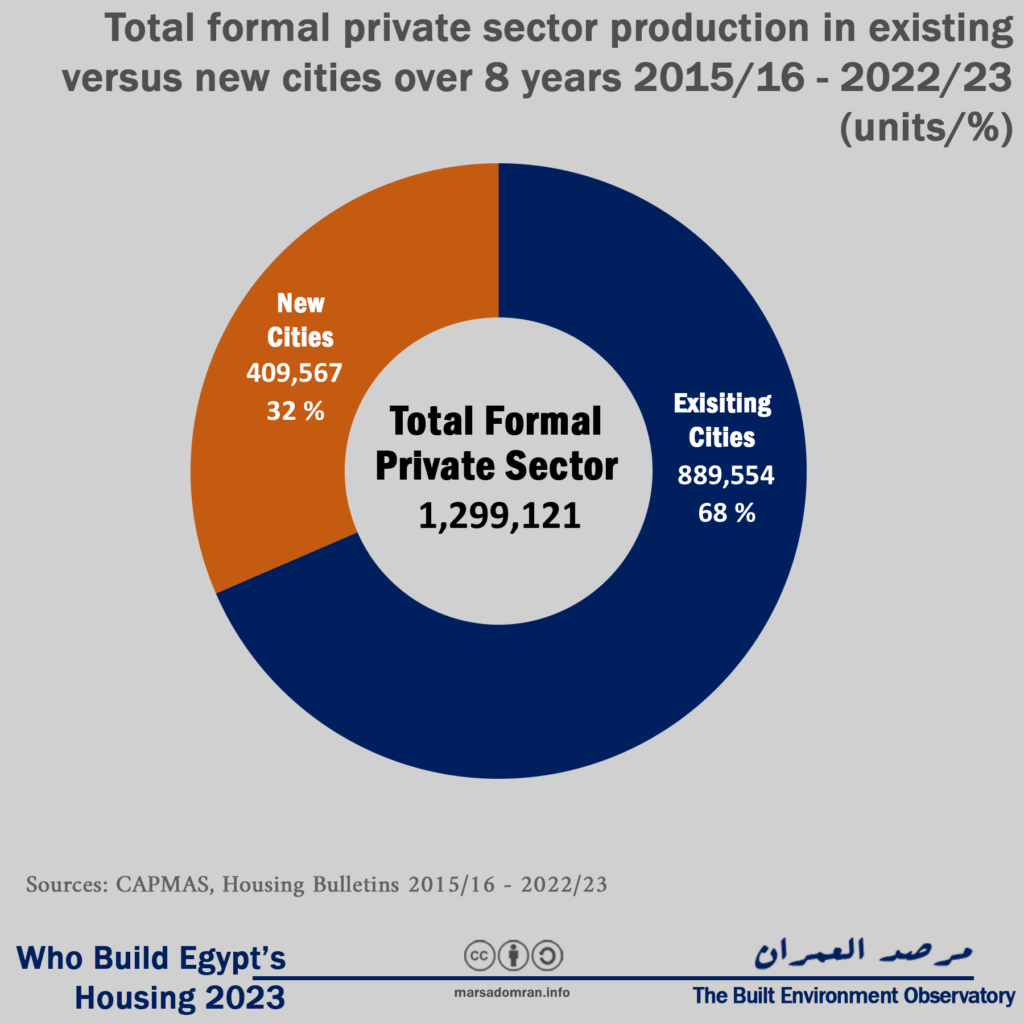
Of the 1.3 million housing units built by the formal private sector over the past eight years, 68 % were built in existing cities, or 900,000 units (Figure 15, Appendix 8). In contrast, 409,000 units were built in New Cities, accounting for a third of the total.
Figure 15: Total formal private sector production in existing versus New Cities over 8 years 2015/16 – 2022/23 (units/%)
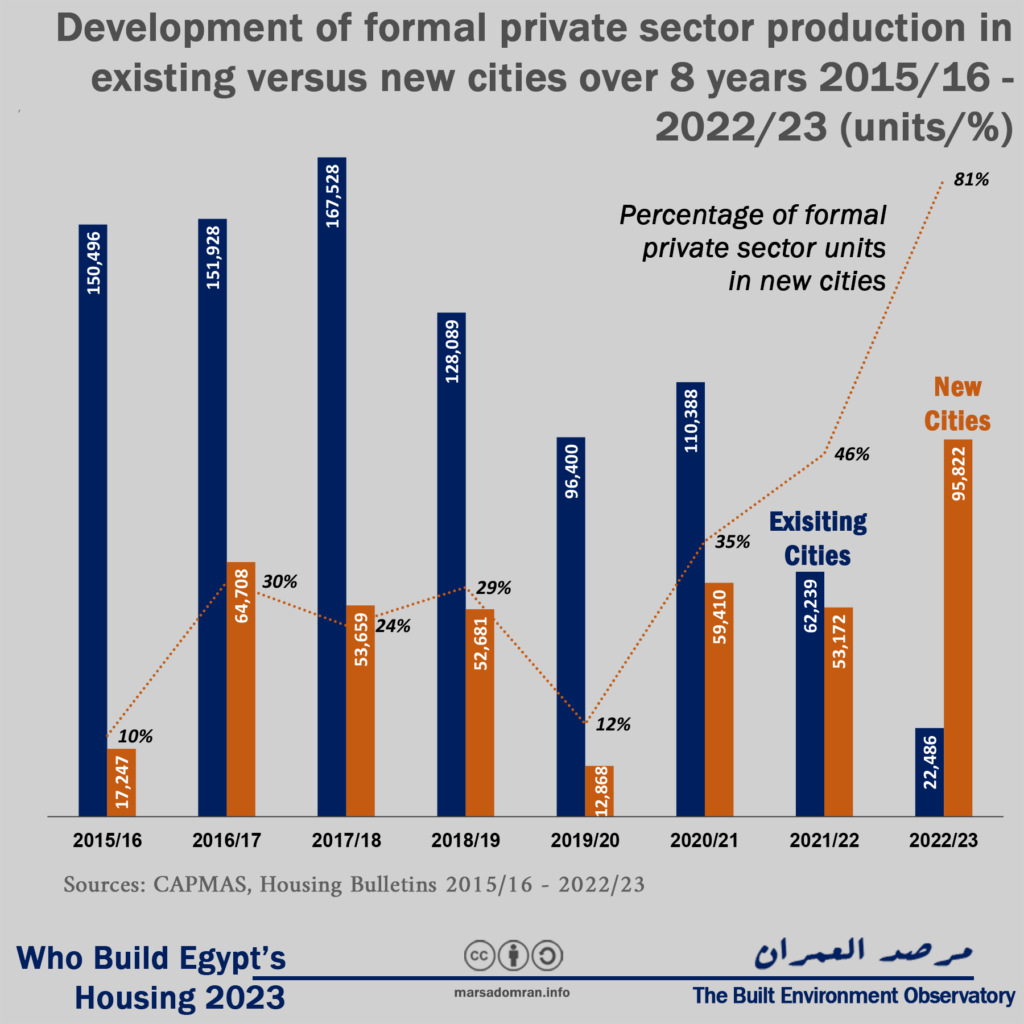
Using annual data, we can see how that existing cities were the dominant location for the formal private sector during seven of the eight years covered by the data, with a downward trend since 2017/18 when production in existing cities peaked at 167,000 units or 74% of production, reaching its lowest rate in existing cities this year at 22,000 units representing 19% of production (Figure 16, Appendix 8). On the other hand, formal private sector construction rates in New Cities remained almost stable during the same period in the range of 50,000 units per year, before dropping significantly in 2019/20, only to rise again since then to reach its peak in the current year at 95,000 units or 81% of production. This is a watershed, where it is the first time since planning of New Cities started in 1977, that the formal private sector built more units in New Cities that in did in existing cities.
This drastic and sudden change could be attributed to the government’s imposition of exceptional zoning regulations in 2021, [9] which led to the curtailment of formal construction in existing cities due to the complexity and delay in obtaining building permits, in addition to the reluctance of a number of landowners to build under these requirements, which greatly reduced allowable built up area (of the land as well as number of floors), reducing the feasibility of their construction projects.[10] It is noteworthy that these exceptional regulations were cancelled at the end of 2024, and the impact of this cancellation may appear later.
Figure 16: Development of formal private sector production in existing versus New Cities over 8 years 2015/16 – 2022/23 (units/%)
Conclusion
Officials reiterate that Egypt needs to build more housing units every year to keep up with the country’s population growth, and many property developers assert that property is a safe haven for people’s savings based on this pivotal need for housing. All these views are based on data from the formal market, i.e. what is built by the formal private sector, whose units have building permits, and the public sector, both which accounted for only one quarter of production over that last decade and a half. The major producer, and one not seen by promoters of housing construction has been the informal private sector which has provided 75% of housing over that time, form modest rural houses, to multi-story buildings. With its phenomenal production, the need to build so much housing each year is far less acute.
From a simple quantitative dimension alone, the study found a surplus of production of 22%, when compared to new marriages, over the last five years, or about 227,000 units per year, leading to Egypt’s well-known high vacancy rates.[11] As late housing activist Milad Hanna put it in the 1980s, “dwellings without dwellers, and dwellers without dwellings.”[12] Of course, the majority of residents aspire to live in adequate and formal housing. However, the data showed how the government’s efforts to regulate existing urban areas and curb informal construction, also curtailed formal construction by the private sector in existing urban areas, which are home to 98 % of Egypt’s population. The government’s focus on producing for-profit housing over the past ten years also came at the expense of social housing, reducing the chances of poor and low-income people finding formal housing.
The decision to abolish exceptional zoning regulations will certainly help the formal private sector expand construction to a wider segment of the population. Were the government to retreat from for-profit housing, it would have a chance to expand its social housing construction. More importantly, mechanisms are need to put the huge stock of closed and surplus units on the market, which will contribute to lowering the prices of units both for purchase and rent, reduce carbon emissions from the residential construction sector, which accounts for 32% of total emissions, and with it reduce climate change that threatens millions of Egyptians, as explained in the ‘National Strategy for Green Urbanism’ launched last November.[13]
Appendices
Appendix 1: Methodology
Formal Private Sector and Public Sector
Housing statistics for the formal private sector and the public sector are collected on an annual basis by the government’s Central Agency for Public Mobilization and Statistics, collecting unit numbers from building permits issued by the local councils and the New Urban Communities Authority (responsible for new satellite cities), as well as housing built by state-owned enterprises (SOEs) from the ministry of housing. This information is collected on an annual (financial year) basis and has been published in a dedicated report from 2015,[14] while prior to that it was part of a larger statistical report published since the 1960s.[15]
Informal Private Sector
To date, there is no regularly collected data on the informal private sector. The Ministry of Housing’s Organisation of Technical Oversight on Buildings (OTOB), has stated that there are almost three million informal buildings in Egypt constructed since the year 2000.[16] But this does not tell us how many units are in them, which could be millions as each building would have between three to four units, while it is not disaggregated by year. The information is also based on police reports of building violations, which may include more than one violation per building, or ones that have been corrected or demolished, and therefore not informal anymore.
Thus, only methods based on inference from other data are the only ones available to estimate housing production by the informal sector. The residual method has been used to calculate production every ten years, by isolating the net newly added housing units between each census, and subtracting formally produced units based on the aforementioned data.[17] While somewhat accurate, it is only available every ten years.
Another method that we first used for the Built Environment Deprivation Index’s Secure Tenure indicator, is based on using the Ministry of Electricity and Renewable Energy’s annual reports which state the total number of residential subscribers.[18] By deducting the annual increase in subscribers, we are able to infer the net annual additions of new homes, which is much higher than the number of formally produced housing stated in the CAPMAS reports. Therefore, by subtracting the formally enumerated housing units from this total, the remaining figure is an estimate of informally built units.
Limitations
For the formal private sector, the data is based on building permits representing possible construction starts and not actual construction. Different projects would be completed in different timelines, where the fastest would be completed in one to two years, and others may take more time to complete. In other cases, construction might not start at all. Therefore, this is only an estimate, and of possible future provision, and not actual production during the year.
For the informal private sector, the data is based on the addition of metered subscribers. Informally built units usually have a mumarsa (stolen electricity connection),[19] which is not metered, and do not show in the data as individual subscribers. Since the 1990s, the government has allowed the state-owned electricity companies to accept informal housing in batches, where owners apply. In the latest batch, between July 2020 and July 2021 when the ministry finally stopped taking in new applications, owners applied for 2.1 million units to change over from mumarsa to coded meters.[20] Between then and May 2022, 980,000 meters were connected,[21] a little less than half the applicants, where a large number are still to be connected, while others may be denied a connection if they fail to demonstrate certain criteria. While this data is a representation of actual units, it is not a reflection of annual production as connections happen for units constructed some years prior.
Appendix 2: Housing production figures by sector 2006/2007 – 2022/2023 (Units)
| Informal Private Sector | Formal Private Sector | Public Sector | Total | Year |
| NA | 142,482 | 16,567 | NA | 2006/07 |
| 829,768 | 165,043 | 25,774 | 1,020,585 | 2007/08 |
| 533,922 | 124,630 | 33,904 | 692,456 | 2008/09 |
| 641,389 | 142,409 | 53,651 | 837,449 | 2009/10 |
| 677,028 | 114,149 | 70,293 | 861,470 | 2010/11 |
| 1,392,390 | 98,188 | 78,529 | 1,569,107 | 2011/12 |
| 1,208,739 | 105,057 | 30,573 | 1,344,369 | 2012/13 |
| 682,539 | 103,283 | 42,500 | 828,322 | 2013/14 |
| 685,535 | 131,082 | 221,547 | 1,038,164 | 2014/15 |
| 784,142 | 167,743 | 95,772 | 1,047,657 | 2015/16 |
| NA | 216,636 | 100,548 | NA | 2016/17* |
| 805,647 | 221,187 | 105,076 | 1,131,910 | 2017/18 |
| 941,812 | 180,770 | 100,511 | 1,223,093 | 2018/19 |
| 467,758 | 109,268 | 84,981 | 662,007 | 2019/20 |
| 401,592 | 169,798 | 166,531 | 737,921 | 2020/21 |
| 867,208 | 115,411 | 130,660 | 1,113,279 | 2021/22 |
| 1,102,289 | 118,308 | 122,452 | 1,343,049 | 2022/23 |
| 794,726 | 148,958 | 109,196 | 1,046,977 | 10 Year Average |
| *Data was not available to accurately calculate total production Sources: See Appendix 1: Methodology |
||||
Appendix 3: Public sector housing production by type 2013/14 – 2022/23
|
Year |
For-Profit
Housing* |
Non-profit Housing** | Total |
| Total | 185,254 | 650,555 | 835,809 |
| 2013-2014 | 1,810 | 40,690 | 42,500 |
| 2014-2015 | 4,030 | 43,914 | 47,944 |
| 2015-2016 | 4,149 | 82,191 | 86,340 |
| 2016-2017 | 5,651 | 54,313 | 59,964 |
| 2017-2018 | 16,564 | 88,512 | 105,076 |
| 2018-2019 | 23,227 | 82,864 | 106,091 |
| 2019-2020 | 31,333 | 59,370 | 90,703 |
| 2020-2021 | 64,860 | 101,671 | 166,531 |
| 2021-2022 | 33,630 | 97,030 | 130,660 |
* For-profit housing: New Urban Communities Authority (Sakan Misr, Dar Misr, Janna, New Administrative Capital, New Alamein, New Mansoura), Urban Development fund (Dara), HCCD Housing and Development Companies, Executive Agency of Joint Projects, Housing and Development Bank, Housing Finance Fund.
* Nonprofit/subsidized housing: Central Agency for Construction, Governorate housing directorates, and New Urban Communities Authority (Social Housing Project/Housing for All Egyptians), General Authority for Building and Housing Cooperatives (Cooperative housing), Urban Development Fund/Informal Settlements Development Fund (Slum-clearance rehousing).
Sources: Central Agency for Public Mobilization and Statistics, “Statistical Yearbook – Housing”, 2013 – 2015, and: “Bulletin of Housing in Egypt”, 2015/2016 – 2022/2023
Appendix 4: Public Sector For-Profit Housing by Agency and Project 20213/2014 – 2022/2023
| Year | Total | NUCA* | UDF** | Others*** |
| Total | 252,947 | 160,981 | 59,812 | 32,154 |
| 2013-2014 | 1,810 | – | – | 1,810 |
| 2014-2015 | 4,030 | – | – | 4,030 |
| 2015-2016 | 4,149 | – | – | 4,149 |
| 2016-2017 | 5,651 | 1,800 | – | 3,851 |
| 2017-2018 | 16,564 | 13,590 | – | 2,974 |
| 2018-2019 | 23,227 | 22,122 | – | 1,105 |
| 2019-2020 | 31,333 | 28,978 | – | 2,355 |
| 2020-2021 | 60,962 | 53,669 | – | 7,293 |
| 2021-2022 | 33,630 | 31,710 | – | 1,920 |
| 2022-2023 | 71,591 | 9,112 | 59,812 | 2,667 |
* Sakan Misr, Dar Misr, Janna, New Administrative Capital, New Alamein, New Mansoura
** Dara Housing and others
*** HCCD Housing and Development Companies, Executive Agency of Joint Projects, Housing and Development Bank, Housing Finance Fund.
Sources: Central Agency for Public Mobilization and Statistics, Statistical Yearbook – Housing”, 2013 – 2015, and: “Bulletin of Housing in Egypt”, 2015/2016 – 2022/2023
Appendix 5: Public Sector Nonprofit/ Subsidized Housing by Project and Agency 2013/2014 – 2022/2023
| Year | Total | Cooperative Housing* | Slum-clearance Rehousing** | Social Housing Project/ Housing for All Egyptians*** |
| Total | 698,354 | 13,538 | 90,245 | 594,571 |
| 2013-2014 | 40,690 | 1,433 | – | 39,257 |
| 2014-2015 | 43,914 | 809 | – | 43,105 |
| 2015-2016 | 81,339 | 976 | – | 80,363 |
| 2016-2017 | 54,313 | 382 | 17,363 | 36,568 |
| 2017-2018 | 88,512 | 1,154 | 5,357 | 82,001 |
| 2018-2019 | 82,696 | 2,088 | 12,904 | 67,704 |
| 2019-2020 | 58,200 | 2,768 | 4,208 | 51,224 |
| 2020-2021 | 101,671 | 2,988 | 20,302 | 78,381 |
| 2021-2022 | 97,030 | 124 | 28,903 | 68,003 |
| 2022-2023 | 49,989 | 816 | 1,208 | 47,965 |
* General Authority for Building and Housing Cooperatives
** Urban Development Fund/Informal Settlements Development Fund
*** New Urban Communities Authority, Central Agency for Construction, Governorate housing directorates
Sources: Central Agency for Public Mobilization and Statistics, Statistical Yearbook – Housing”, 2013 – 2015, and: “Bulletin of Housing in Egypt”, 2015/2016 – 2022/2023
Appendix 6: Total Housing Built in New Cities versus Existing Cities and Villages 2015/2016 – 2022/2023
| Year | Total | Existing Cities | New Cities |
| Total Units | 7,524,052 | 6,537,992 | 986,060 |
| 2015-2016 | 1,037,309 | 979,418 | 57,891 |
| 2016-2017 | 275,928 | 181,126 | 94,802 |
| 2017-2018 | 1,130,320 | 992,241 | 138,079 |
| 2018-2019 | 1,228,220 | 1,100,825 | 127,395 |
| 2019-2020 | 666,704 | 577,088 | 89,616 |
| 2020-2021 | 732,800 | 551,823 | 180,977 |
| 2021-2022 | 1,112,204 | 963,998 | 148,206 |
| 2022-2023 | 1,340,567 | 1,191,473 | 149,094 |
Note: The formal private sector was calculated according to the CAPMAS Housing Bulletin data, while the total informal private sector was considered all as existing cities and villages due to its common activity there and the lack of detailed data. The public sector has been calculated by the most common area of operation by agency due to the lack of data as follows:
- New Cities: New Urban Communities Authority, General Authority for Building and Housing Cooperatives
- Existing cities and villages: Urban Development Fund, Central Agency for Construction, Governorate Housing Directorates, Joint Ventures Authority, Housing Finance Fund, Housing & Development Bank, and HCCD Housing and Development Companies.
Sources: Central Agency for Public Mobilization and Statistics, Statistical Yearbook – Housing”, 2013 – 2015, and: “Bulletin of Housing in Egypt”, 2015/2016 – 2022/2023
Appendix 7: Social Housing Project/ Housing for All Egyptians in New Cities versus Existing Cities and Villages 2013/2014 – 2022/2023
| Year | Total | Existing Cities* | New Cities** | % New Cities |
| Total | 568,307 | 139,115 | 429,192 | 76% |
| 2013-2014 | 19,172 | 7,104 | 12,068 | 63% |
| 2014-2015 | 39,140 | 22,858 | 16,282 | 42% |
| 2015-2016 | 79,535 | 40,719 | 38,816 | 49% |
| 2016-2017 | 36,352 | 8,440 | 27,912 | 77% |
| 2017-2018 | 82,001 | 12,325 | 69,676 | 85% |
| 2018-2019 | 67,704 | 17,368 | 50,336 | 74% |
| 2019-2020 | 51,224 | 7,392 | 43,832 | 86% |
| 2020-2021 | 78,381 | 13,471 | 64,910 | 83% |
| 2021-2022 | 67,691 | 4,803 | 62,888 | 93% |
| 2022-2023 | 47,107 | 4,635 | 42,472 | 90% |
* Central Agency for Construction, Governorate Housing Directorates
** New Urban Communities Authority
Sources: Central Agency for Public Mobilization and Statistics, “Bulletin of Housing in Egypt”, 2015/2016 – 2022/2023
Appendix 8: Formal Private Sector Production in New Cities versus Existing Cities 20215/2016 – 2022/2023
| Year | Total | Existing Cities | New Cities | % New Cities |
| Total | 1,299,121 | 889,554 | 409,567 | 32% |
| 2015-2016 | 167,743 | 150,496 | 17,247 | 10% |
| 2016-2017 | 216,636 | 151,928 | 64,708 | 30% |
| 2017-2018 | 221,187 | 167,528 | 53,659 | 24% |
| 2018-2019 | 180,770 | 128,089 | 52,681 | 29% |
| 2019-2020 | 109,268 | 96,400 | 12,868 | 12% |
| 2020-2021 | 169,798 | 110,388 | 59,410 | 35% |
| 2021-2022 | 115,411 | 62,239 | 53,172 | 46% |
| 2022-2023 | 118,308 | 22,486 | 95,822 | 81% |
Sources: Central Agency for Public Mobilization and Statistics, “Bulletin of Housing in Egypt”, 2015/2016 – 2022/2023
Appendix 9: Total Housing Production versus New Marriages 2018/2019 – 2022/2023
| Year | New Housing | New Marriages | Surplus (Deficit) | Surplus/ Deficit % |
| 2018/19 | 1,223,093 | 786,389 | 436,704 | 36% |
| 2019/20 | 662,007 | 755,908 | (93,901) | -14% |
| 2020/21 | 737,921 | 764,345 | (26,424) | -4% |
| 2021/22 | 1,113,279 | 812,313 | 300,966 | 27% |
| 2022/23 | 1,343,049 | 824,444 | 518,605 | 39% |
| 5 Year Average | 1,015,870 | 788,680 | 227,190 | 22% |
Sources: Appendix 2, and: CAPMAS Annual Bulletin of Marriage and Divorce Statistics, 2018/2019 – 2022/2023
Acknowledgements
Lead researcher: Yahia Shawkat
Assistant researcher: Dina El-Mazzahi
To cite this report, please use:
Shawkat, Yahia, and Dina Elmazzahi. Who Build Egypt’s Housing 2023. The Built Environment Observatory, 13 March 2025. https://marsadomran.info/en/2025/03/3815/ DOI: 10.13140/RG.2.2.22990.57921
Notes and Sources
[1] Ahram Online
‘Egypt’s Sisi Says Will Deploy Army to Remove Illegal Buildings Built on Agricultural Land If Problem Persists – Politics – Egypt’, 29 August 2020.
[2] Built Environment Observatory,” New Zoning and Building Regulations, and Construction Freeze –Development Brief “,29 April 2021.
[3] ‘Number of new marriages’ rather than “total number of marriages” is used because the total figure includes remarriages and is therefore not an indicator of new demand for housing.
[4] Apart from this year, the only year in which the government produced more housing than the formal private sector was 2014/2015. However, this seems exceptional given the large number of units produced in that year compared to previous and subsequent years, as well as being the highest number ever in 15 years, and four times the ten-year average, warranting the need for further investigation.
[5] NUCA wholly or partially owns real estate companies such as City Edge, Saudi Egyptian Developers, and Hyde Park Developments, but the statistics do not appear to include their production.
[6] For more on co-operative housing see:
Salma Khamis, “Tracing Cooperative Housing in Egypt,” 2022, https://depositonce.tu-berlin.de/handle/11303/17258.
Karim S. Noureldin, Ahmed O. El-Kholei, and Ibrahim Sedky Rezkalla, “Housing Cooperatives in Egypt: Challenges, Constraints, and Solutions,” Journal of Housing and the Built Environment 39, no. 4 (December 1, 2024): 1965–86, https://doi.org/10.1007/s10901-024-10137-2.
[7] New Cities are administered by NUCA almost entirely separately form local administration (municipalities), and are thus capitalised. For more, see our Mapping New Cities in Egypt 2024
[8] Data separating new cities from existing cities has only been available since 2015/2016, so the comparison is based on eight years, not ten like the rest of the data.
[9] Built Environment Observatory,” New Zoning and Building Regulations, and Construction Freeze –Development Brief “,29 April 2021.
[10] Shorouk News, ”A breakthrough is coming in the construction sector with the reinstatement of the old law and the suspension of the new requirements (Arabic)”, September 27, 2024.
[11] Egyptian Streets, “Egypt’s Vacant Housing Units 12.8 Million: CAPMAS | Egyptian Streets,” Egyptian Streets (blog), October 3, 2017, https://egyptianstreets.com/2017/10/03/egypts-vacant-housing-units-12-8-million-capmas/.
[12] Milad Hanna, al-Iskan wal-masyada: al-mushkila wal-hall (Cairo: Al-Mustaqbal al-‘Arabi, 1988).
[13] “National Framework Strategy for Green Urbanism and Building in Egypt | WUF,” World Urban Forum 12, October 31, 2024, https://wuf.unhabitat.org/event/wuf12/national-framework-strategy-green-urbanism-and-building-egypt.
[14] Central Agency for Public Mobilization and Statistics, “Bulletin of Housing in Egypt”, 2015/2016 – 2021/2022
[15] “Statistical Yearbook – Housing”, 2008 – 2015.
[16] Al-Akhbar, ‘Housing inspection: 2 Million and 900 Thousand illegal properties in Egypt (Arabic)’, 26 February 2018.
[17] See for example: Yahia Shawkat, Egypt’s Housing Crisis: The Shaping of Urban Space (Cairo: American University in Cairo Press, 2020); David Sims, Understanding Cairo: The Logic of a City Out of Control (Cairo: American University in Cairo Press, 2010); Stephen K. Mayo, Harry Garnett, and Mohamed Ramez, ‘Informal Housing in Egypt’ (Cambridge Mass.: Abt Associates, Dames and Moore, GOBHR, USAID, January 1982).
[18] Ministry of Electricity and Energy, ‘Egypt Electricity Holding Company Annual Report’ 2006/2007 through 2020/2021, and 2021/2022. Subscribers labelled as ‘Residential’, in addition to a weighted portion of ‘Closed/postponed’ and ‘Zero Reading’ because of their significant numbers. These statistics represent all formal electricity subscribers whether through formal contracts, or semi-formal ‘coded meters’. They do not include unmetered connections or mumarsa, as they are bundled together in ‘Others’, which may include many non-residential users.
[19] Owners of homes built without a permit cannot initially apply formal electricity connections. They must first ‘steal’ power through informal connections to the grid and then report it to the police and electricity company authorities who then record the infringement and issue a penalty based on the size of the units and its use that is paid on a monthly or bimonthly basis. Failure to pay may result in a heavier fine or jail. Owners with such agreements have been allowed to change to so-called ‘coded meters’ since 2011 if they demonstrate certain criteria, a legal connection paying standard electricity rates, though without a fully formalized contract so as not to prove tenure. For more see: Shawkat, Egypt’s Housing Crisis: The Shaping of Urban Space, chap. 2.
[20] ‘Coded Electricity Meters: Grace Period Officially Ends on Saturday and Last Chance to Apply (Arabic)’, Amwal al-Ghad, 29 July 2021.
[21] ‘980,000 Meters Connected So Far for Violators (Arabic)’, Al-Youm al-Sabe’, 28 May 2022.