- Published on 15 May 2017
The Built Environment Budget 2016/2017, is The Built Environment Observatory’s second annual report analysing public spending on the built environment sectors in Egypt (Click here to read last year’s BE Budget 15/16). BE Budget 16/17 continues to shed light on spatial justice in Egypt by analysing public investment in Egypt’s 27 governorates, according to the six sectors that constitute the Egyptian built environment: housing, urban development, drinking water, sanitation, electricity, and transportation. As our work expands to include inflation-adjusted comparisons with last year, as well as comparisons between spending and needs based on our Built Environment Deprivation Indicator (BEDI), the BE Budget 16/17 comes in two parts, each of which investigates one of the dimensions of the BE Budget in-depth and concludes with a number of findings and recommendations.
Part I: An Overview of Spatial Justice outlines public expenditure by official agencies administered by both central ministries and local administration (governorates). These include both service agencies as well as state owned enterprises (SOEs). Part I also analyses the administrative-geographical scope of the expenditure; between regional projects, and local projects which have a specific impact range within the boundaries of a single governorate. The report goes on to analyse spatial justice for local projects between Egypt’s regions as well as governorates. It has a particular focus on Egypt’s dual local administration systems; the mainstream local municipalities, where more than 98% of Egyptians live, and the so-called New Cities where around 2% of Egyptians live under the administration of the New Urban Communities Authority (NUCA), a SOE affiliated with the Ministry of Housing.
In Part II: Spatial Justice by Sector, public expenditure is analysed by the six sectors that were chosen to represent the built environment; housing, urban development, drinking water, sanitation, electricity, and transportation. Total and per capita public expenditure are analysed for each sector in by region, governorate, and administrative scope (the existing built environment, New Cities, and regional projects).
Introduction
Part I: An Overview of Spatial Justice provides an overview of public spending on the built environment in Egypt by official agencies, and analyses spatial justice between regions and governorates for FY 2016/2017, as well as inflation-adjusted changes on the previous FY 2015/2016. Section 1 presents the executive summary and conclusions, followed by recommendations for a just budget in Section 2, for those that want to get a quick overview.
Sections 3 and 4 present the overview of expenditure by official agencies, where Section 3 focuses on the relevant ministries, the local administration (the governorates), and their affiliates, including both service agencies and SOEs. Section 4 looks at expenditure according to the administrative-geographical scope of the agencies, dividing their projects into three main scopes of impact. Regional projects that cross provincial borders, such as electricity generation and transmission, railroads, and trans-regional highways. Projects in the existing cities and villages (termed the Existing BE), which have a specific impact within the boundaries of a single governorate – such as housing, drinking water and sanitation, local electricity networks, roads, local transportation, and urban development. And projects in New Cities, which follow the same sectors as the Existing BE, but are administratively independent.
Section 5 analyses spatial justice between regions, and each of the 27 governorates. The sections especially address the peculiar Egyptian dual local administration system separating traditional local municipalities that manage more than 200 cities and 4000 villages where more than 98% of Egyptians live, and NUCA, the SOE run by the Ministry of Housing which builds and manages about 30 New Cities in 20 governorates, where about 2% of Egyptians live (For more on this and other definitions, please see Methodology). This Section also focuses on the analysis of spatial justice in the Existing BE, as well as New Cities.
1 Executive Summary and Conclusions
For the second year in a row, and despite a considerable increase in expenditure over last year, the same conclusions about the BE Budget persist. The administrative contrast in spending between the Existing BE and New Cities, the lack of spatial justice in spending among regions and governorates, and the difficulty in collecting and analysing information on public spending in the built environment.
1.1 Persistence of pattern of spatial injustice at regional and governorate levels despite increase in spending
Total planned spending in the built environment increased by 62% on last year, from EGP 98.9 Bn to EGP 159.8 Bn in real terms (LE 187.4 Bn in nominal prices). However, the pattern of disparities between the different regions of Egypt very much continues. The spending-to-population ratios (SPR) in Greater Cairo, Suez Canal and the Frontier regions remain much higher than parity (equity/parity is 1.0, over-spending is more than 1.1 and deprivation is less than 0.9), where the SPR was 8 times the population in the Frontier region (Fig. 1) (For more see: Methodology, 6.3 Quantifying Spatial Justice). In contrast, the rates of spending to population in the regions of the Delta, Upper Egypt and Alexandria remain less than the level of parity by about half.
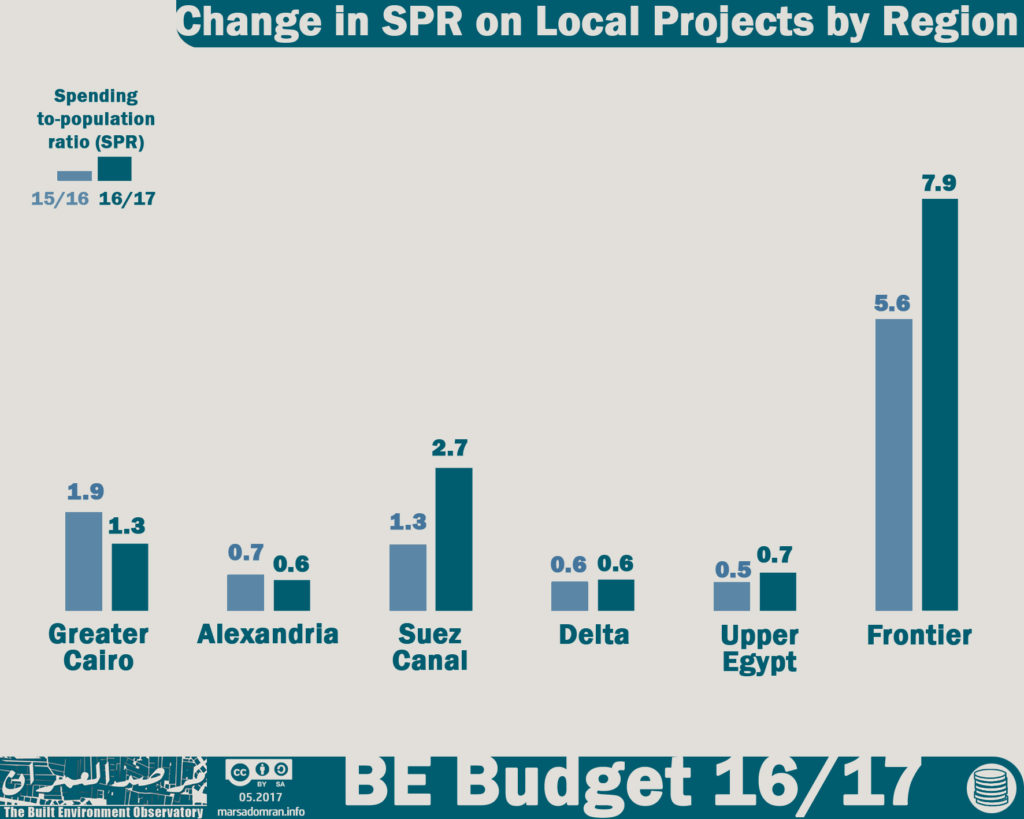
Fig. 1: Change in SPR on Local Projects by Region
1.2 Stark contrast between public spending and needs furthers inequity
When the shares of each of the six regions from public expenditure were compared to their shares of people living in deprived conditions , large disparities between spending and needs were revealed (Fig. 2) (For more see: Methodology, 6.3 Quantifying Spatial Justice). In the regions of the Delta and Upper Egypt, the spending-to-deprived population ratio (SPDR) was almost half parity (Equity/parity is 1.0, over-spending is more than 1.1 and deprivation is less than 0.9), showing a continuum of deprivation that ignores their needs. Alexandria was the only region where spending was near par with needs (1.1). Spending was higher than par in Greater Cairo (1.8), and over three times parity in the Suez Canal region (3.2), evidence of their political importance. However, spending rates relative to needs were extremely high in the Frontier region reaching 15.9 times par.
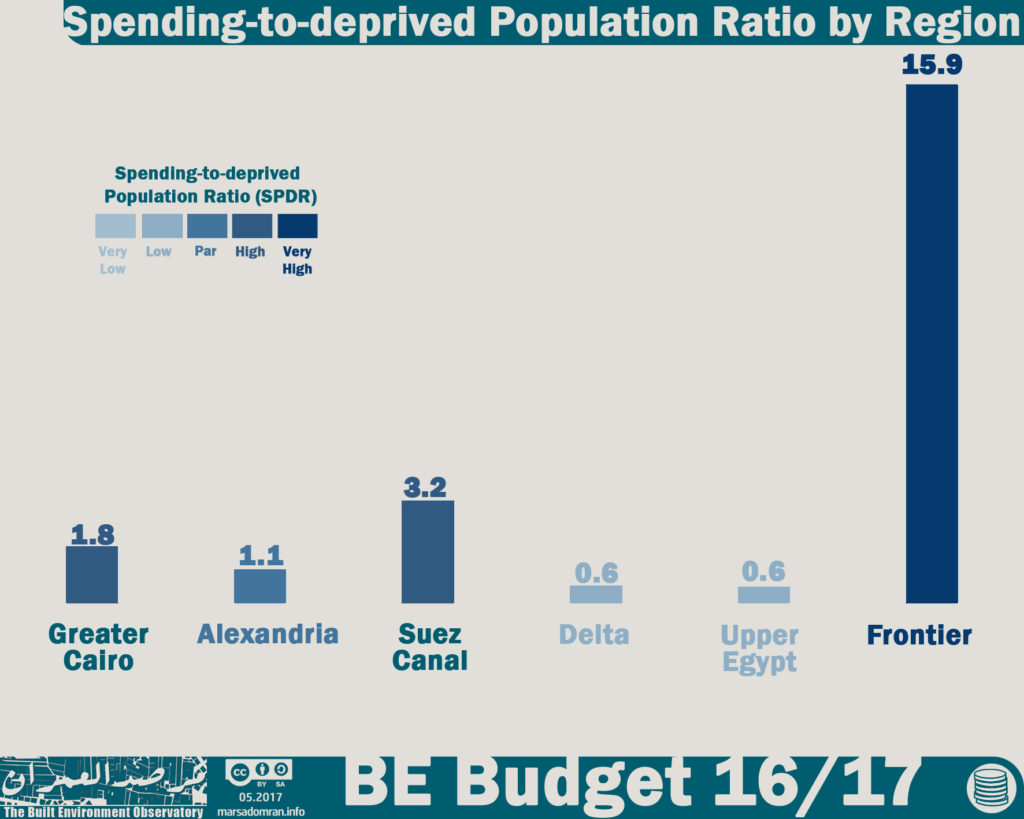
Fig. 2: Spending-to-deprived Population Ratio (SPDR) by Region
1.3 Continued spatial inequality between New Cities and Existing BE
The ratio of spending on the Existing BE and New Cities improved a little over the past year, where the share of spending on local projects in the Existing BE grew from 48% to 66%, and for New Cities dropped form 52% to 34%. However, it remains far from equitable where only 66% of public spending goes to 98% of the population, while the remaining third goes to the 2% of the population that lives in the New Cities (Fig. 3).
In addition, public expenditure on New Cities in five governorates, including the three governorates of Greater Cairo (Cairo, Giza and Qalubia), was greater than spending on the Existing BE in those governorates. This is evidence of the political drive favouring New Cities over the existing cities and villages in these governorates, despite the lack of accessibility to New Cities.[1]
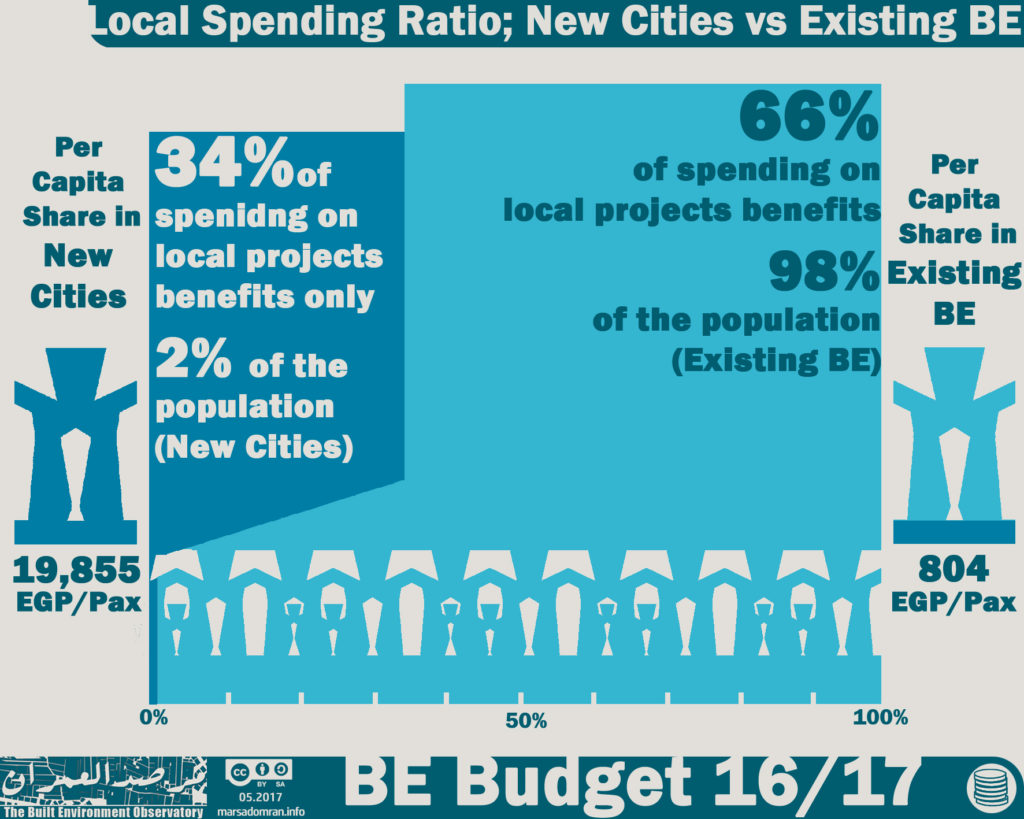
Fig. 3: Local Spending Ratio: New Cities versus the Existing BE
2 Recommendations
With the reproduction of spatial inequity for the second consecutive year, the recommendations remain the same: Implementing needs-based and participatory economic and social plans, restructuring of the built environment management structure and agencies to ensure spatial justice between regions, governorates, as well as the Existing BE and the New Cities, ensuring transparency and improving access to budget documents.
A) Developing needs-based plans that ensure spatial justice
•Establishment of committees with the mandate of setting the social and economic plans at the level of each local municipality (village/district, markaz/city, governorate), which are made up of Local Popular Councils (LPCs), Local Executive Councils (LEPs), civil society institutions and representatives of the National Institute of Planning (NIP). The committees should carry out a range of participatory activities with residents to develop the plans.
•At the beginning of the FY, the committees will work on developing visions for their local economic and social plans for the coming FY, which should be based on local needs and proposals according to participatory criteria for each local municipality. These visions are to be collected at the governorate level within three months in order to develop the governorate plan. In another three months, the governorate plans are to be set and raised to the national level. On the latter level, the plans are studied and harmonized within three months. Semi-final national and governorate plans are then published for public discussion and review three months before the start of the next FY.
•With regard to the needs and proposals that could not be achieved in the economic and social plan of the short (fiscal) year, the NIP shall put in place medium (five year) and long-term (10 year) plans to ensure their achievement within a specified period of time. The national strategy shall also be updated on the basis of these plans and following up on their performance.
•The NIP continues to publish data on plans (planned budget, monthly expenditure follow-up, final accounts, etc.) in a way that is accessible to citizens and local committees to follow up on the plans’ performance (For more on this see Part III of the BE Budget 16/17).
B) Elimination of the administrative and fiscal duality of New Cities the Existing BE
•Develop a short-, medium- and long-term plans for the restructuring of the New Urban Communities Authority in to a number of provincial and local authorities to balance local public expenditure on the built environment between needs and real estate investments. (For more on this see Part II of the BE Budget 16/17).
3 Overview: Spending by Agency
Fourteen ministries and 27 governorates spend public money on the built environment (Table 1). Their total investments (Chapter 6 of the budget) in FY 2016/2017 was EGP 187.4 Bn, of which only 16% was financed by the Treasury (Table 1), a significant decrease from 37% in FY 2015/2016. Other sources of public funding included loans, grants and agency revenue, where we see a purely public agency such as the Ministry of Local Development receiving 100% funding from the treasury, to zero for the Egypt Electricity Holding Company (EEHC), which relies on revenue from selling electricity to subscribers, as well as public (government) and commercial loans, the latter form both local banks and international financial institutions.
Table 1: Investment by Ministries, Local Administration and Affiliates, Categorized by Supplier (LE)
| Agency | Treasury | Revenue/ Loans/Grants | TOTAL | |
| Ministry of Housing, Utilities & Urban communities | New Urban Communities Authority (NUCA)* | 0 | 38,921,300,000 | 38,921,300,000 |
| Central Agency for Construction (CAC) | 2,042,200,000 | 0 | 2,042,200,000 | |
| Social Housing Fund (SHF)** | 0 | 49,963,314,000 | 49,963,314,000 | |
| General Authority for Cooperative Construction and Housing | 0 | 51,500,000 | 51,500,000 | |
| Informal Settlements Development Facility (ISDF) | 1,500,000,000 | 0 | 1,500,000,000 | |
| Construction Authority for Potable Water and Wastewater (CAPWW) | 5,482,400,000 | 0 | 5,482,400,000 | |
| National Organisation for Potable Water and Sanitary Drainage (NOPWSD) | 5,742,000,000 | 0 | 5,742,000,000 | |
| Sub-total | 14,766,600,000 | 88,936,114,000 | 103,702,714,000 | |
| Ministry of Transport | General Authority for Roads, Bridges and Land Transport (GARBaLT) | 6,982,000,000 | 0 | 6,982,000,000 |
| National Authority for Tunnels (NAT) | 5,082,258,000 | 0 | 5,082,258,000 | |
| Egyptian National Railways (ENR) | 0 | 5,197,000,000 | 5,197,000,000 | |
| Sub-total | 12,064,258,000 | 5,197,000,000 | 17,261,258,000 | |
| Ministry of Electricity | Electricity SOEs*** | 0 | 6,859,500,000 | 6,859,500,000 |
| Egypt Electricity Holding Company (EEHC) | 0 | 55,505,000,000 | 55,505,000,000 | |
| Sub-total | 0 | 62,364,500,000 | 62,364,500,000 | |
| Local Admin. | Offices of the Governorates | 2,582,806,034 | 577,793,966 | 3,160,600,000 |
| Cairo Transport Authority (CTA) | 0 | 250,000,000 | 250,000,000 | |
| Alexandria Public Transport Authority (APTA) | 0 | 200,000,000 | 200,000,000 | |
| Sub-total | 2,582,806,034 | 1,027,793,966 | 3,610,600,000 | |
| Ministry of Local Development | Office of the ministry | 500,000,000 | 0 | 500,000,000 |
| Total | 29,913,664,034 | 157,525,407,966 | 187,439,072,000 | |
| * Include investments in the New Administrative Capital and the Social Housing Project ** The share of NUCA was omitted to avoid dual counting. The total allocated to the SHF in the state budget is EGP 61,027,000,000 *** No detailed breakdown by agency was provided |
||||
The Ministry of Housing, Utilities and Urban Communities remains the largest investor for the second year in a row, with only slightly more than half of built environment spending (Fig. 4). The Ministry of Electricity remains the second largest investor, where its share rose from one quarter to one third of the budget. The Ministry of Transport came third, with a share of just under 10%, which is half its share from the previous financial year. The same happened with the share of all 27 governorates and the Ministry of Local Development, which fell from just under 4% of the BE Budget last year to about 2% this year.
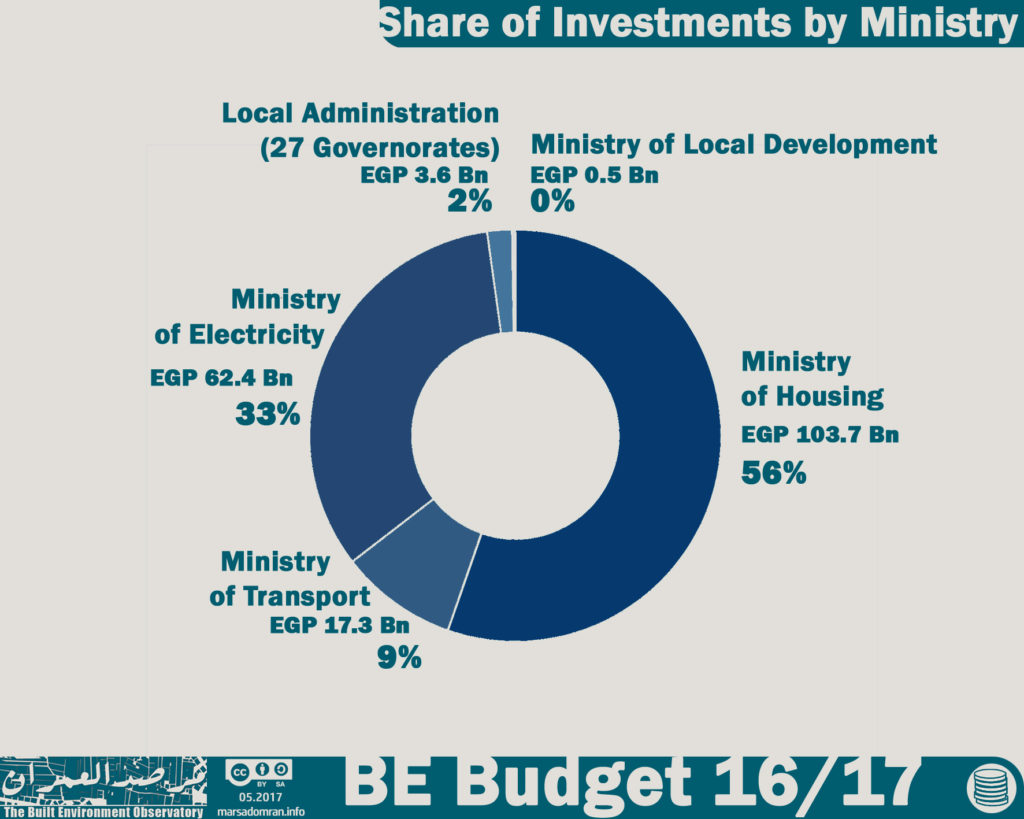
Fig. 4: Share of Investments by Ministry
By agency, the largest investor in the built environment is the Egypt Electricity Holding Company, affiliated with the Ministry of Electricity, with spending equal to a little less than a third of the budget (Table 1). Next in line is the Social Housing Fund (SHF) affiliated with the Ministry of Housing, whose share rose from 11% in the last BE Budget to about a quarter this year. The share of the New Urban Communities Authority (NUCA), which is also affiliated with the Ministry of Housing, dropped from nearly a third of the budget last year (the largest investor in the built environment) to a fifth (third largest investor). It is noteworthy that 11% of its spending was through a subsidiary, the New Administrative Capital Company, where it planned to spend EGP 4.3 Bn equivalent to 2.3% of the entire BE Budget on one project; the New Administrative Capital. At the other end of the scale, the Alexandria Public Transport Authority (APTA) affiliated with the Alexandria Governorate, is the smallest investor in the built environment with a share of only 0.1% of public spending.
Change in Spending on FY 15/16
Public spending on the built environment increased by 90% from last year, using nominal prices (prices not adjusted to inflation). Even after adjusting to inflation on the last FY, spending on the built environment in real terms was up a considerable 62% from last year (Fig. 5).[2] Spending by the Ministry of Electricity saw the largest increase (110%) from last year using real prices, mostly due to the construction of three large power plants. The expenditure of the Ministry of Housing jumped by 72%, where expenditure on the Social Housing Project rose from EGP 11 Bn to EGP 61 Bn at nominal prices. This last increase is exceptional to this FY, given massive one-off revenue from the sale of about 150 thousand housing units this year that were built over the previous few years, down payments for more than a quarter of a million units, and a large EGP 20 Bn loan from local commercial banks. The proposed budget for the upcoming FY 17/18 is EGP 33 Bn,[3] a significant decrease on this year.
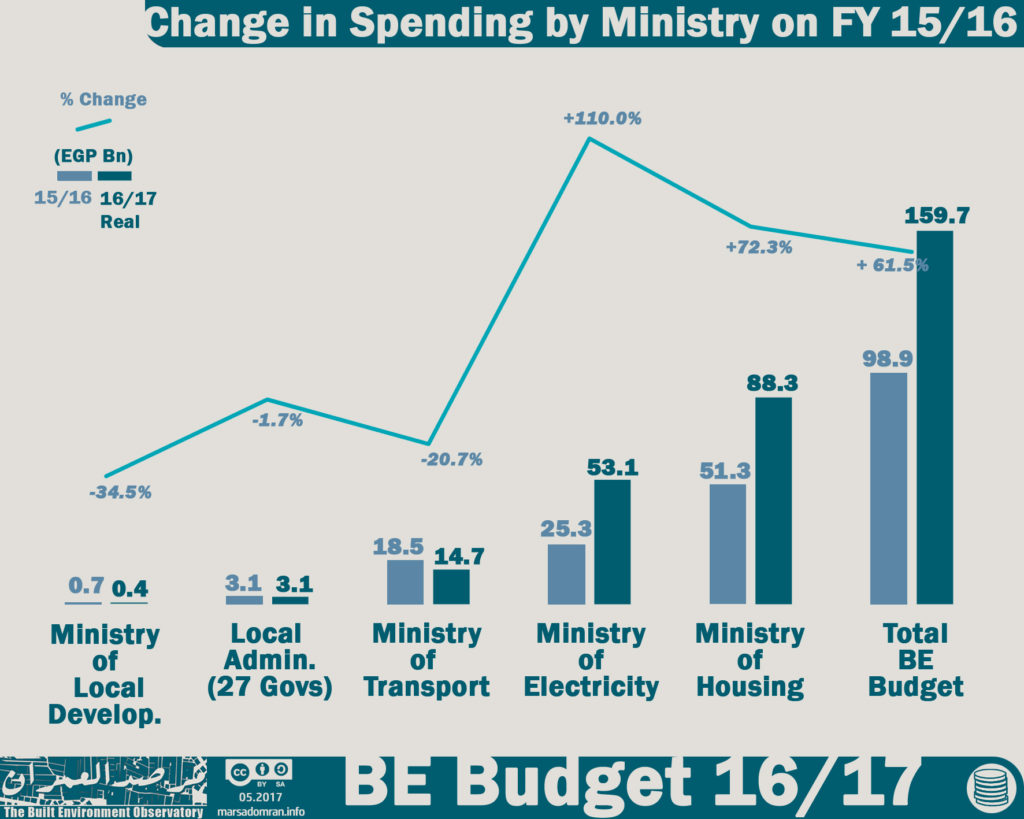
Fig. 5: Change in Spending by Ministry in FY 15/16
Notably, the expenditure of the Local Administration (all 27 governorates), the Ministry of Transport and the Ministry of Local Development dropped by 1.7%, 21% and 35%, respectively, according to real prices. In the end, however, this significant change in expenditure will need to be verified at the end of the FY, since final accounts for built environment agencies tend to show significant under and over-spending compared to planned figures in the approved budgets (See Part III for more on this phenomenon).
Change in Per Capita Investment on FY 15/16
According to nominal prices, per capita public expenditure on the built environment rose from EGP 1098 per person last year to EGP 2035 this year. However, after adjusting for inflation, real per capita income drops to EGP 1733, which is still 58% higher than last year, despite a 2.27% increase in population (Fig6).[4]
The Ministry of Electricity showed the highest increase in real per capita investment by slightly more than double last year (EGP 577 per person). On the other hand, the Ministry of Local Development showed the biggest drop in real per capita investment of 36% on last year.
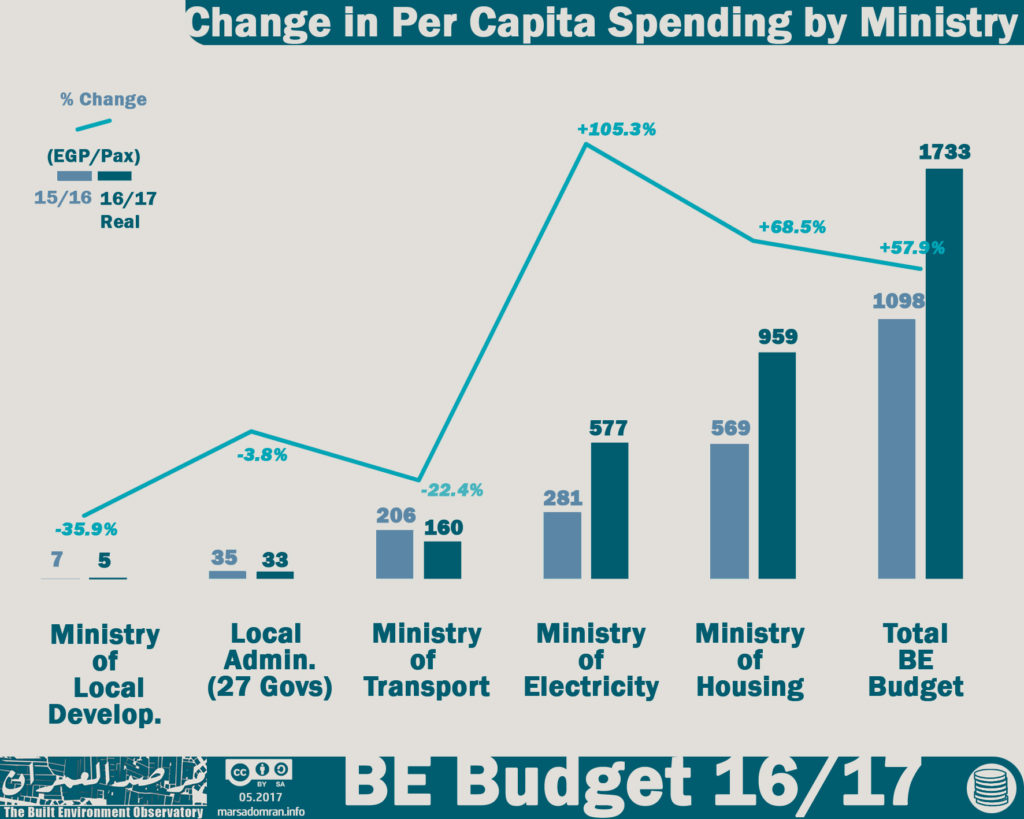
Fig. 6: Change in Per Capita Spending by Ministry
4. Expenditure by Geo-Administrative Domains
The BE Budget has measured the impact of built environment projects according to three geo-administrative domains. The first domain is regional projects, namely power stations and regional networks, railways, and regional highways where their impact crosses governorate boundaries. A total of EGP 74.4 Bn was allocated to these projects.
The second domain is the existing the built environment (Existing BE): the existing cities and villages administered by the mainstream municipalities called local administration. They are home to about 98% of the population, and it is possible to confine the impact of local projects within the borders of one governorate in six sectors; housing, urban development, drinking water, sanitation, local transport, and local electricity networks. Total spending on the Existing BE was EGP 74.3 Bn.
New Cities make up the third domain. They are new town built from scratch on desert sites by NUCA, a Ministry of Housing SOE, which are owned and run by it and are administratively and fiscally independent from local municipal administration. Today they are home to about 2% of the population. Therefore, most of the benefit of projects in the New Cities is confined to its current residents and future residents. Projects in New Cities are divided into the same sectors the Existing BE, where spending totaled EGP 38.9 Bn this year.
Compared to the previous FY, the share of regional projects decreased slightly to 40% from 41% (Fig. 7), while the share of spending on New Cities fell to 21% compared to 30% last year. Conversely, the share of the Existing BE rose to 39% compared to 29% in the previous year, mostly on the back of significant increase of spending on the Social Housing Project.
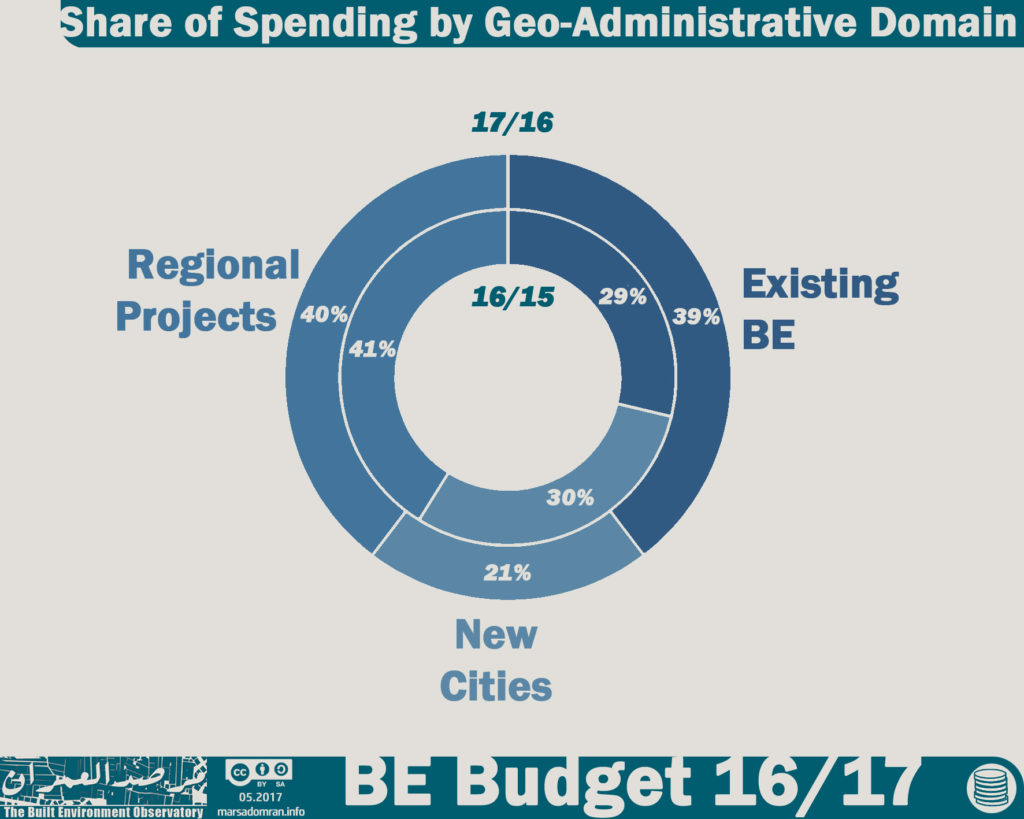
Fig. 7: Share of Spending by Geo-administrative Domain
Change in Total Spending Compared to FY 15/16
Public spending in the three geo-administrative domains increased by an average of two-thirds using real prices compared to the previous FY 2015/2016. Change in spending on the Existing BE was the highest by 123%, mostly due to the exceptional increase on spending on the Social Housing Project (Fig. 8). Spending on regional projects increased by 56% over the previous year in real terms, most of it due to the construction of three giant power plants. On the other hand, expenditure on New Cities increased by 11.3% using real prices, most of which is directed towards real estate investments; subdivision of desert land to sell and for-profit housing projects (Dar Masr housing project and the luxury housing project in the New Administrative Capital).
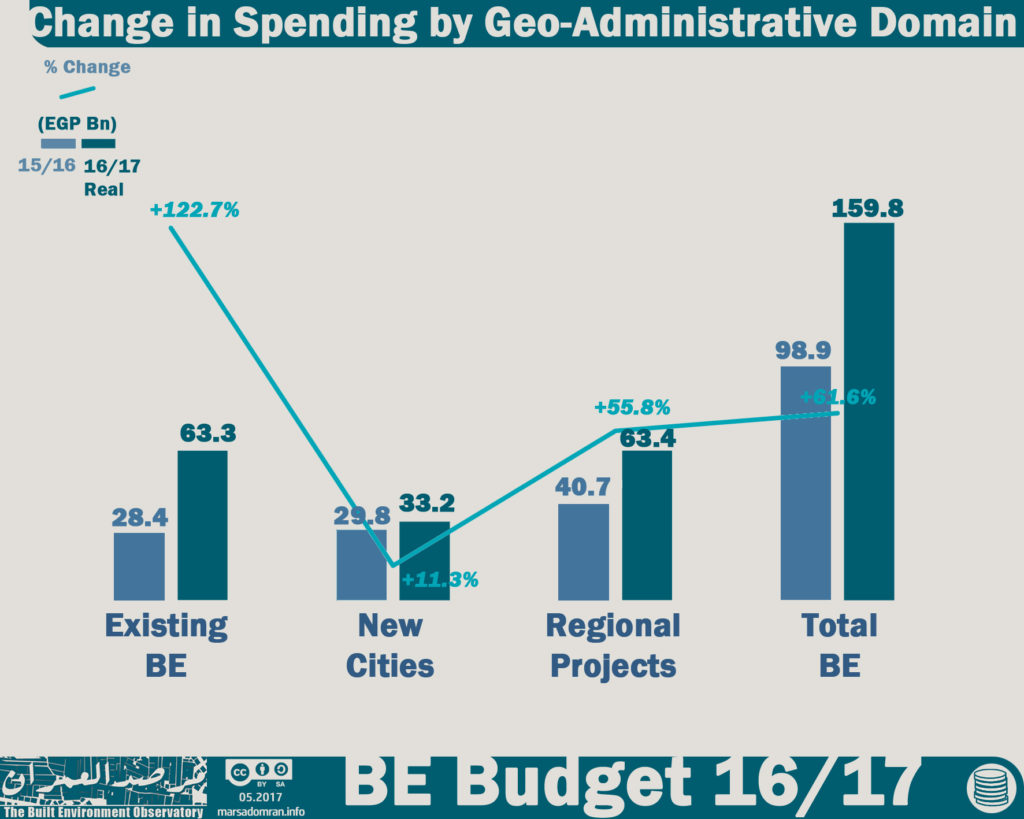
Fig. 8: Change in Spending by Geo-administrative Domain on FY 15/16
Change in Per Capita Spending on FY 15/16
Total per capita expenditure on the built environment rose to EGP 1735 using real prices (EGP 2,036 in nominal prices) compared to last year, an increase of 58% (Figure 9). The per capita expenditure on New Cities remained the highest, at EGP 16,916 per capita using real prices – or about 10 times the national average, an increase of 9% over last year. In comparison, per capita spending in existing towns and villages amounted to EGP 702, which represents an increase of 118% over the previous year. For regional projects, the per capita share increased by about half over the previous year to EGP 688 per capita.
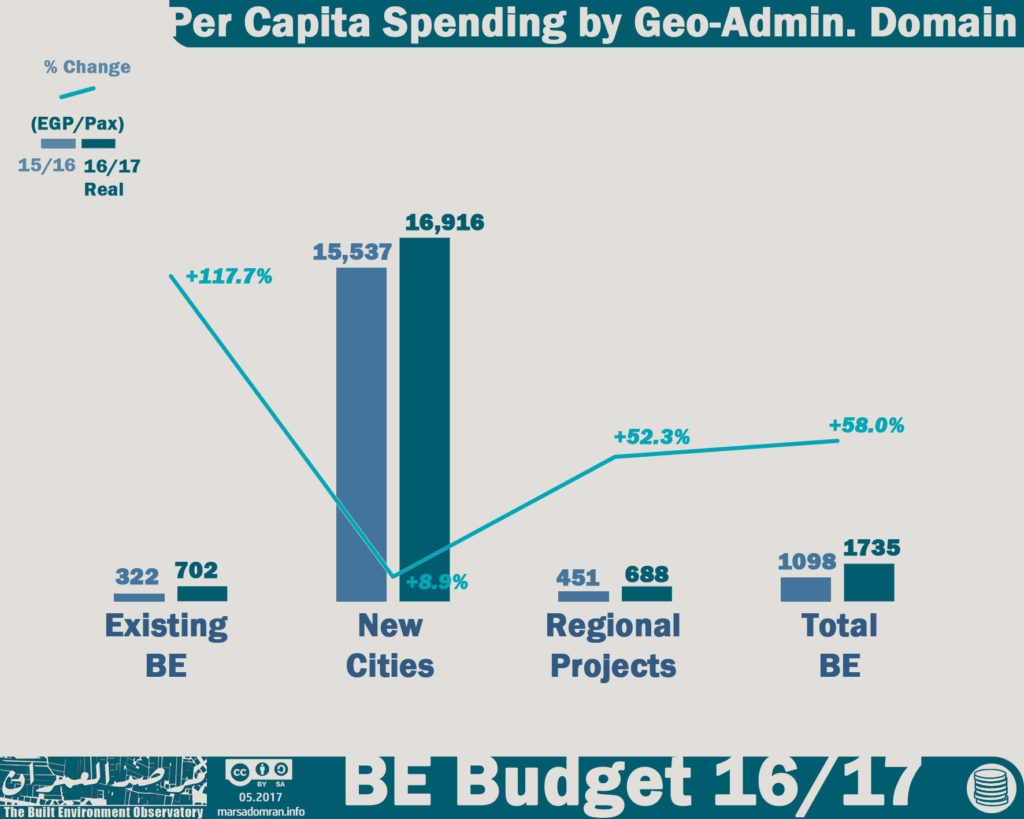
Fig. 9: Change in Per Capita Spending by Geo-administrative Domain on FY 15/16
5 Spatial Justice
5.1 Spatial Justice by Region
The absence of spatial justice between the regions of Egypt continues for the second year in a row, with an even wider disparity. The Greater Cairo region received the lion’s share of investments in spending on local projects (Both the Existing BE and New Cities), equaling 32% of expenditure, despite the fact that only 25% of Egyptians live there (Table 2). The Delta and Upper Egypt regions, on the other hand, received 21% of spending on local projects each. The share of Alexandria was lowest, at 3% of spending, despite being home to 5% of the population.
Table 2: Spending on Local Projects by Geo-Administration and Region (EGP)
| Regions | New Cities | Existing BE | Total Local | |||
| Greater Cairo | 24,492,719,000 | 62.93% | 10,277,579,000 | 14.70% | 34,770,298,000 | 31.95% |
| Alexandria | 584,488,000 | 1.50% | 2,882,850,000 | 4.12% | 3,467,338,000 | 3.19% |
| Suez Canal | 363,564,000 | 0.93% | 7,953,086,000 | 11.38% | 8,316,650,000 | 7.64% |
| Delta | 6,020,519,000 | 15.47% | 17,218,896,000 | 24.63% | 23,239,415,000 | 21.36% |
| Upper Egypt | 4,515,010,000 | 11.60% | 18,774,621,000 | 26.86% | 23,289,631,000 | 21.40% |
| Frontier | 2,945,000,000 | 7.57% | 12,792,800,000 | 18.30% | 15,737,800,000 | 14.46% |
| TOTAL | 38,921,300,000 | 100.00% | 69,899,832,000 | 100.00% | 108,821,132,000 | 100.00% |
Change in Spending to Population Ratio on Local Projects on FY 15/16
The absence of, and the variation in, spatial justice in the distribution of spending on local projects is illustrated by dividing share of expenditure by share of population in each region, where equity/parity is 1.0, over-spending is more than 1.1 and deprivation is less than 0.9 (For more see: Methodology, 6.3 Quantifying Spatial Justice).
The Greater Cairo Region which had the highest share of spending, had a slightly high expenditure to population ratio of 1.3, which is much better than last year when it was 2.0 (Figure 10). The expenditure to population ratio was highest in the Frontier region, reaching a very high 7.9. This was considerably higher than last year’s record of 5.6. The Suez Canal region also so a significant increase on last year, reaching a high 2.7, compared to 1.3 last year, when it was the closest region to parity. The regions of the Delta, Upper Egypt and Alexandria all had deprivation level expenditure to population ratios ranging between 0.6 and 0.7. The situation improved slightly in Upper Egypt (up from 0.5 to 0.7), but worsened in Alexandria (Down from 0.7 to 0.6), and remained the same for the Delta (0.6).
Fig. 10: Change in Spending to Population Ratio on Local Projects by Region on FY 15/16
Change in Spending to Population Ratio in the Existing BE on FY 15/16
When spending on New Cities is subtracted from the total spending on local projects leaving only spending on the Existing BE, the picture of spatial justice in some regions changes dramatically, though remains the same in others, showing the weight and importance of the official policy towards New Cities.
The three regions of the Delta, Upper Egypt and Alexandria that all had deprivation level expenditure to population ratios in total local spending (above), still had ratios lower than parity (0.7, 0.9 and 0.8 respectively) (Fig. 11). This was despite considerably increased spending in real terms this year on the Existing BE which saw their ratios improve on last year (0.2, 0.3 and 0.3 respectively). While the Greater Cairo region had a high ratio on total spending on local projects, it drops to 0.6 when spending on New Cities is omitted, this is still a small improvement on last year (0.5). In contrast, the ratios on the two regions where spending on New Cities is low, jumps in the Suez Canal region to 4.0 and a massive 10.0 in the Frontier region, which remains the region with highest expenditure to population ratios for the second year in a row. These two regions also saw large jumps in their ratios on last year of four times and three and a half times respectively.
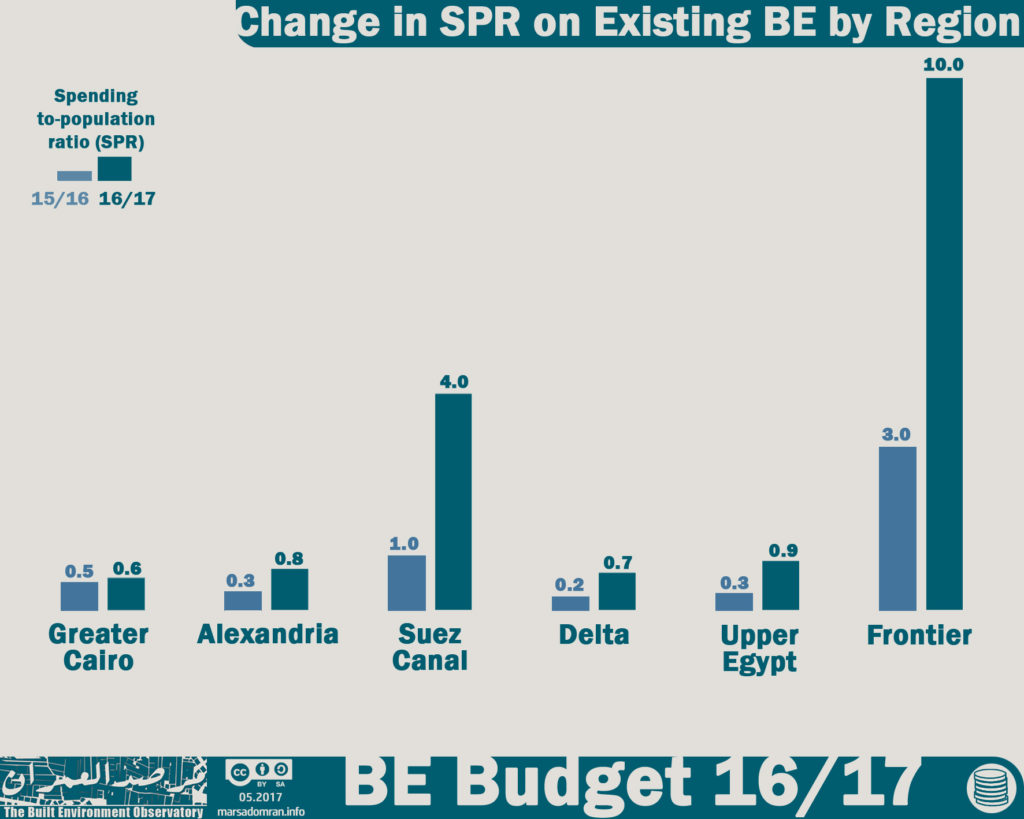
Fig. 11: Change in Spending to Population Ratio on the Existing BE by Region on FY 15/16
Spending to Deprived Population Ratio in the Existing BE
When the shares of each of the six regions from public spending were compared to their shares of only the population living in deprived conditions, large disparities between spending and needs were revealed (For more see: Methodology, 6.3 Quantifying Spatial Justice). In the regions of the Delta and Upper Egypt, the ratio was almost half parity, showing a continuum of deprivation that ignores their needs (Fig. 12). Alexandria was the only region where spending was near par with needs (1.1). Spending was higher than par in Greater Cairo (1.8), and over three times parity in the Suez Canal region (3.2), evidence of their political importance. However, spending rates relative to needs were extremely high in the Frontier region reaching 15.9 times par.
Fig. 12: Spending to Deprived Population Ratio in the Existing BE by Region
Change in Spending to Population Ratio in New Cities on FY 15/16
Focusing on local spending on New Cities shows the importance of the Greater Cairo region, for it alone accounts for two-thirds of investments, although it houses only a quarter of Egypt’s population (Table 2). This high expenditure is driven by a number of investment projects, especially that of the New Administrative Capital and the for-profit “Dar Masr” housing project.
Despite having the highest share of spending, the Greater Cairo region had the second highest spending to population ratio (2.5), which was slightly higher than last year (Fig. 13). The Frontier had the highest spending to population ratio in New Cities of 4.1, an increase on last year’s high of 3.6, mostly on the back of one new city project, New Alamein in Matruh. In contrast spending to population ratios in the other four regions was much lower than parity, ranging between 0.4 in Upper Egypt and the Suez Region, to 0.1 in Alexandria, the lowest ratio this year, and a significant drop from last year’s already low 0.5.
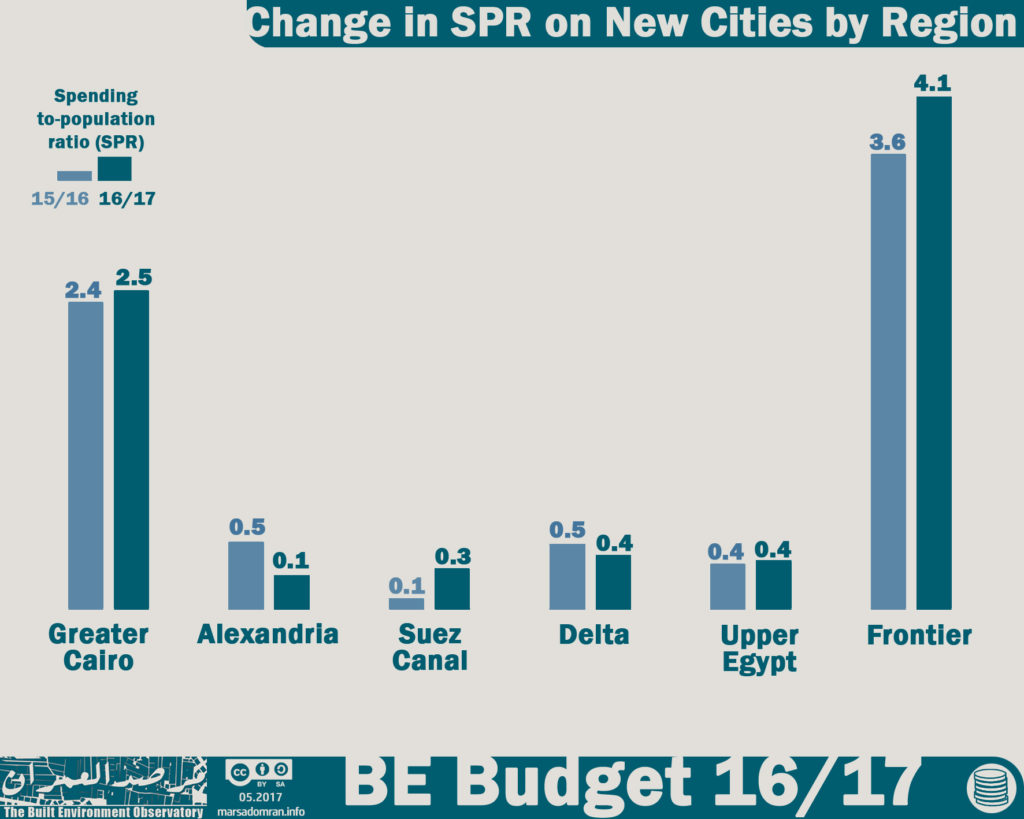
Fig 13: Change in Spending to Population Ratio in New Cities by Region on FY 15/16
5.2 Spatial Justice; New Cities vs the Existing BE
Total expenditure on local projects (Both Existing BE and New Cities) was EGP 113.2 Bn, with an average per capita of EGP 1229 per person. EGP 74.3 Bn was spent on the Existing BE, home to more than 200 cities and 4000 villages, while EGP 38.9 Bn was spent on 31 New Cities. While the contrast of spending on the two geo-administrative domains improved slightly over the past year, the excessive disparity persists, where 66% of spending on local projects serves 98% of the population living in the Existing BE, and 34% of spending serving the 2% who live in the New Cities (Fig. 14). When seen in per capita terms, New City residents have a per capita share 25 times higher than those in the Existing BE (EGP 19,855 versus EGP 804 per person).
Fig. 14: Local Spending Ratio: New Cities versus the Existing BE
Comparison of Governorate-Level Spending between Existing BE and New Cities
While overall spending on the Existing BE was higher than on New Cities, spending on New Cities was higher than that on the Existing BE in five governorates, including the three Greater Cairo Governorates (Cairo, Giza and Qalyubia). This shows both the geographical concentration of spending on New Cities, as well as the official tendency to discriminate in favour of large so-called national projects in New Cities in those governorates, which are not necessarily accessible to middle-income and poor Egyptians (Figure 15). [5]
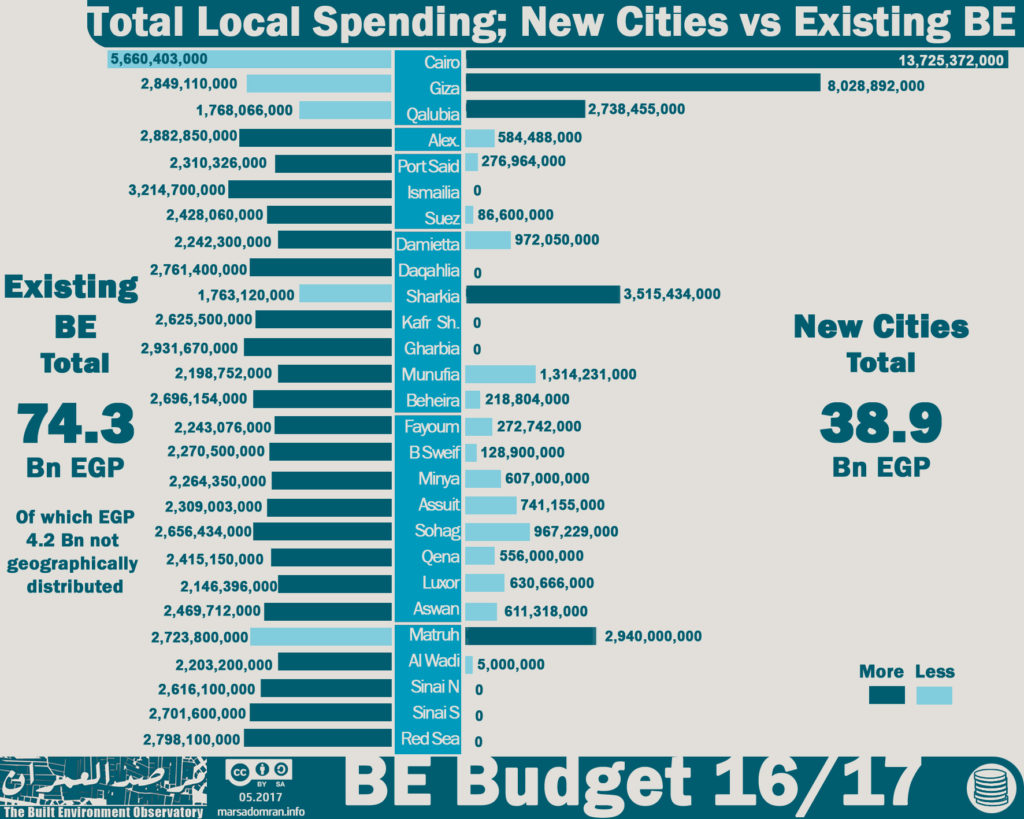
Fig 15: Total Local Spending; New Cities versus the Existing BE
5.3 Spatial Justice by Governorate; The Existing BE
Per Capita spending on the Existing BE by Governorate
The average per capita spending on the Existing BE falls to EGP 807 per person, or nearly two thirds of the national average per capita on local projects (Both the Existing BE and New Cities). Per capita expenditure in all governorates of Greater Cairo (Cairo, Giza and Qalyubia) was lower than EGP 807 per person (Fig. 16). This was also the case in Alexandria and most Upper Egyptian governorates with the exception of Luxor and Aswan, and most Delta governorates with the exception of Damietta. The governorate of Sharkiya in the Delta had the lowest per capita of EGP 260 per person.
On the other hand, per capita spending was almost three times the average in all governorates of the Canal region (between EGP 2700 and EGP 3700), and ten times in the Frontier region, where at EGP 15,655 per person, South Sinai had the highest per capita spending at 19 times the national average.
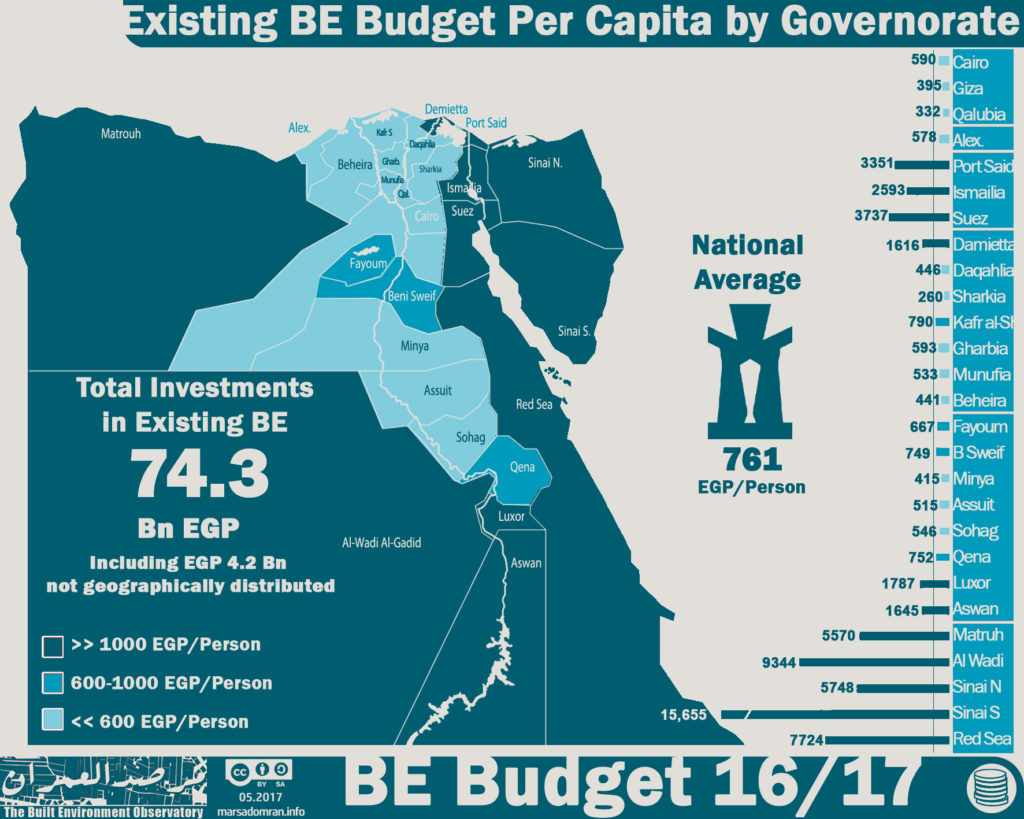
Fig. 16: Existing BE Budget Per Capita by Governorate
It should be noted that these inflated rates of some governorates are mostly due to high spending on the Social Housing Project, with almost identical spending per governorate (For more, see Part II – Housing).
Change in Per Capita Spending on the Existing BE on FY 15/16
After adjusting for inflation, per capita spending on the Existing BE decreases from EGP 807 (nominal) to EGP 687 (real). Even with the population increasing by 2.7% from last year, per capita spending still rose 113% on last year (Table 3). However, despite this massive increase, spatial injustice in the regions of Alexandria, Delta and Upper Egypt persists. Per capita spending in the governorates of these three regions remained significantly lower than the national average for the second year in a row, with the exceptions of Kafr El-Sheikh in the Delta and the governorates of Qena and Beni Sweif in Upper Egypt which witnessed a notable improvement towards the national average. The Delta also remains the region with the lowest per capita spending by governorate, where Sharkiya received EGP 221 per person in investments, compared to EGP 122 per person in Dakahlia last year.
It is also noticeable that per capita spending in Cairo dropped 23% from last year and 10% in Qalyubia, the only two governorates that saw a drop in the per capita investment this year. Thus, the per capita share in all the governorates of Greater Cairo is below the national average (Though remains much higher than average for New Cities. See next section).
On the other hand, the Ismailia governorate had the highest per capita growth rate of 336% from last year, while South Sinai has the highest per capita spending in the Existing BE of EGP 13,338, a considerable increase of 150% over last year.
Table 3: Change in Per Capita Investment in Each Governorate in the Existing BE on FY 15/16 (EGP per person)
| % Change | 16/17 Real | 15/16 | Governorate | Region |
| -23% | 502 | 653 | Cairo | Grater Cairo |
| 75% | 306 | 175 | Giza | |
| -10% | 283 | 313 | Qalubia | |
| 88% | 493 | 262 | Alexandria | Alex. |
| 158% | 2,855 | 1,108 | Port Said | Suez Canal |
| 336% | 2,209 | 507 | Ismailia | |
| 240% | 3,184 | 937 | Suez | |
| 196% | 1,377 | 465 | Damietta | Delta |
| 212% | 380 | 122 | Daqahlia | |
| 54% | 221 | 143 | Sharkia | |
| 196% | 673 | 227 | Kafr al-Sheikh | |
| 195% | 505 | 171 | Gharbia | |
| 66% | 454 | 274 | Munfia | |
| 153% | 376 | 149 | Beheira | |
| 164% | 568 | 215 | Fayoum | Upper Egypt |
| 176% | 638 | 231 | Beni Sweif | |
| 125% | 353 | 157 | Minya | |
| 101% | 439 | 218 | Assiut | |
| 112% | 465 | 220 | Sohag | |
| 234% | 641 | 192 | Qena | |
| 229% | 1,523 | 463 | Luxor | |
| 195% | 1,401 | 475 | Aswan | |
| 119% | 4,310 | 1,968 | Matruh | Frontier |
| 253% | 7,961 | 2,256 | Wadi al-Gadid | |
| 161% | 4,897 | 1,875 | Sinai N | |
| 150% | 13,338 | 5,336 | Sinai S | |
| 203% | 6,581 | 2,173 | Red Sea | |
| 113% | 685 | 322 | Egypt | |
Ratio of Spending to Needs by Governorate
When spending is compared to the number of people living in deprived conditions, further local disparities appear (For more see: Methodology, 6.3 Quantifying Spatial Justice). The spending to the deprived population ratio was close to parity/equity in only two governorates; Qalubia and Alexandria (1.0 and 1.1 respectively) (Fig. 17). The ratio was much lower than parity for most governorates in the regions of the Delta and Upper Egypt, where it was 0.5 or less in Gharbia, Daqahlia and Beheira in the Delta, and Fayoum, Assuit, Sohag, Qena and Minya in Upper Egypt. These eight governorates are thus the most deprived in Egypt.
In contrast to this geographically concentrated deprivation, both Giza and Cairo in the Greater Cairo region had spending to deprived population ratios higher and much higher than parity (1.4 and 2.6 respectively), as did the three governorates that make up the Suez Canal region, Port Said, Ismailia and Suez, ranging between 2.9 and 3.9. The governorates with the highest spending to deprived population ratios were all five of the desert Frontier region, ranging from 9.9 in North Sinai, to an extreme high of 52.5 in South Sinai.[6]
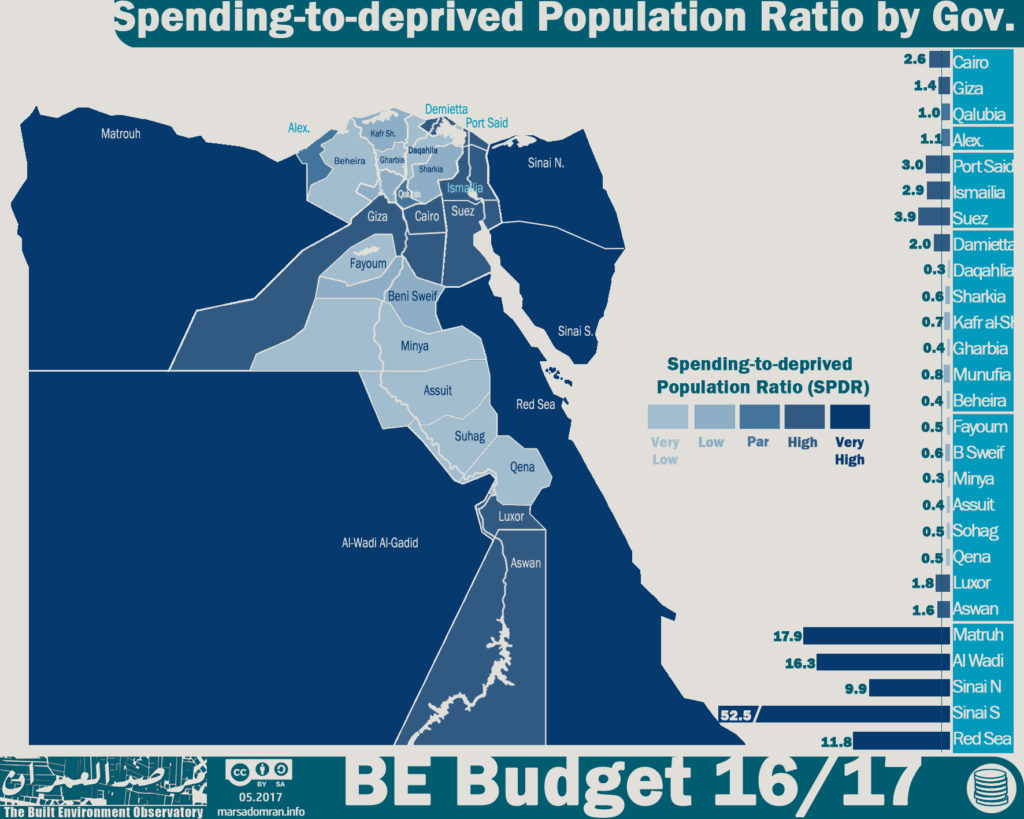
Fig. 17: Spending-to-deprived Population Ratio by Governorarte
5.4 Spatial Justice by Governorate; New Cities
Per Capita Spending on New Cities by Governorate
When the total investments on New Cities is divided by the total population living in them, their per capita spending is an enormous EGP 19,855 per person (nominal), or about 20 times the national average of spending on local projects. Though for the sake of local comparison, as population figures for New cities are estimates, we will be using total population rather than New City population, which shows an average of EGP 422 per person (Fig. 18).
The Greater Cairo region was the only region where the per capita investment in New Cities in all its governorates was higher than the national average, ranging from EGP 514 in Qalubia to 1430 in Cairo, or more than three times the average. Investments in the Delta governorates varied greatly, which in Beheira was only EGP 36 per person, or 10 times less than average, compared to EGP 701 per person Damietta, or 1.7 times the average. With the exception of Luxor, per capita spending in all Upper Egypt governorates was lower or much lower than average, especially in Fayoum, Beni Suef and Minya.
The highest per capita spending was in Matruh, at a phenomenal EGP 6012 per person, all due to investments in New Alamein city, a large in coastal real-estate investment project,[7] with some social housing.
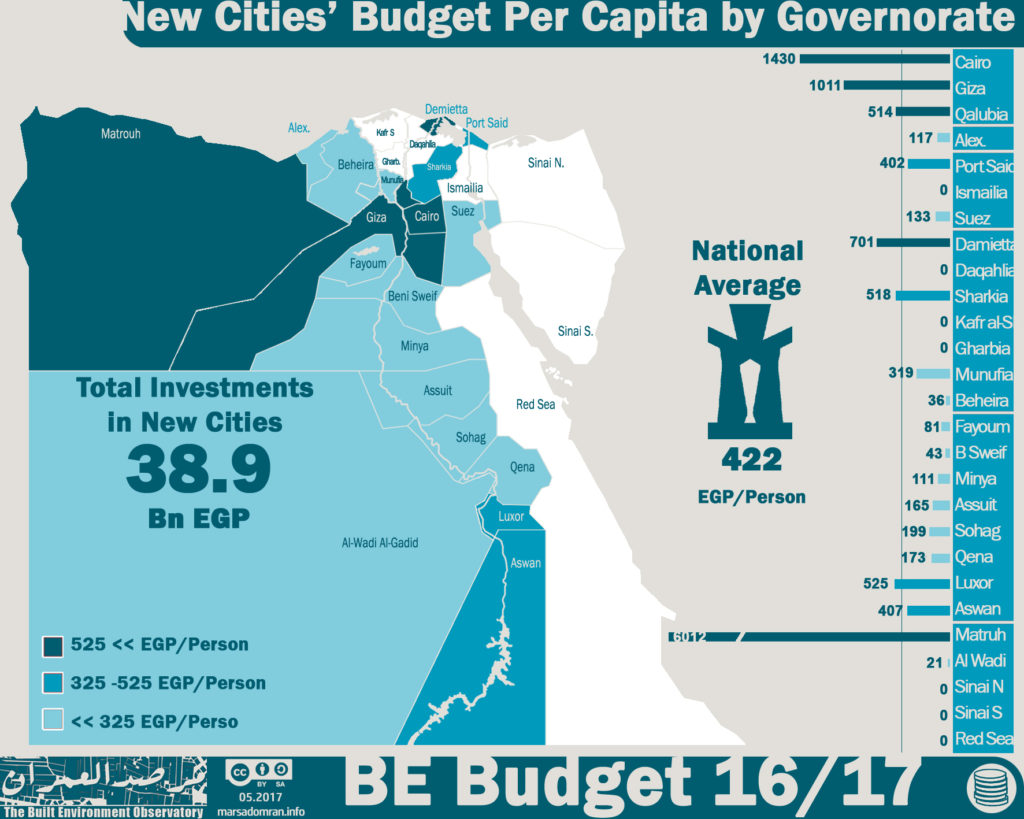
Fig. 18: New Cities’ Budget Per Capita by Governorate
Change in Per Capita Spending on New Cities on FY 15/16
The per capita spending in New Cities drops to EGP 16,916 per person in real terms (From EGP 19,855 per person nominal), that is for New City population only. Overall there is still an 8.2 per cent increase on FY 15/16. When using Egypt’s total population, average per capita spending in real terms is EGP 360 per person (EGP 422 per person nominal), with the same increase over last year (Table 4).
Per capita spending on all the governorates of Greater Cairo was higher than the average, with spending increasing by a massive 54% on last year in real terms. The governorate of Beheira recorded the lowest per capita share for the second consecutive year, at EGP 31, despite a 55% increase over the previous year (The New Valley was lower, though does not yet have a functioning New City). Damietta, on the other hand, had the highest drop in per capita spending on last year (-85%), though still had per capita spending that was higher than the average (EGP 597 per person). Alexandria saw the second highest decline (-79%) to EGP 100 per person, or about a third of the average. The governorate of Matruh had the highest per capita spending on New Cities for the second year running, with an increase of 17% to EGP 5123 per person.
Table 4: Change in Per Capita Investment in Each Governorate in New Cities on FY 15/16 (EGP per person)
| % Change | 16/17 Real | 15/16 | Governorate | Region |
| -19% | 1,218 | 1,445 | Cairo | Grater Cairo |
| 50% | 861 | 431 | Giza | |
| 54% | 438 | 203 | Qalubia | |
| -79% | 100 | 179 | Alexandria | Alex. |
| 98% | 342 | 7 | Port Said | Suez Canal |
| _ | _ | _ | Ismailia | |
| -1% | 114 | 115 | Suez | |
| -85% | 597 | 1,103 | Damietta | Delta |
| _ | _ | _ | Daqahlia | |
| -19% | 441 | 524 | Sharkia | |
| _ | _ | _ | Kafr al-Sheikh | |
| _ | _ | _ | Gharbia | |
| 56% | 271 | 119 | Munfia | |
| 55% | 31 | 14 | Beheira | |
| 74% | 69 | 18 | Fayoum | Upper Egypt |
| -55% | 36 | 56 | Beni Sweif | |
| -1% | 95 | 96 | Minya | |
| -14% | 141 | 160 | Assiut | |
| 33% | 169 | 114 | Sohag | |
| -8% | 148 | 159 | Qena | |
| 39% | 447 | 272 | Luxor | |
| 12% | 347 | 305 | Aswan | |
| 17% | 5,123 | 4,269 | Matruh | Frontier |
| -20% | 18 | 22 | Wadi al-Gadid | |
| _ | _ | _ | Sinai N | |
| _ | _ | _ | Sinai S | |
| _ | _ | _ | Red Sea | |
| 8% | 360 | 331 | Egypt | |
6 Methodology
As with the BE Budget 2015/16, the BE Budget 2016/17 has compiled data and information from several sources to provide its analysis. The report has used publicly available official information only, giving a near accurate estimate of how much money the government allocates to the various built environment related sectors: building housing units; developing residential areas; providing roads and transportation for commuting in neighbourhoods and cities; building water and waste-water stations and networks; as well as providing electricity through power stations and grids.
Therefore, data compiled is consolidated to reflect information through six main sectors: 1) Housing Projects, 2) Urban Development, 3) Water, 4) Waste-water, 5) Transportation and 6) Electricity, with more detail within the sectors in the case of multiple projects. Furthermore, the BE Budget categorises public built environment spending according to both local spending on the sub-national governorate level to analyse spatial equality of public spending, as well as National spending for projects that cross sub-national borders such as National highways, rail-roads and electricity generation and networks. Another administrative distinction is made at the sub-national level particular to Egypt, which has dual local administrative structures. The first is the Existing Built Environment, composed of the mainstream municipalities that manage over 200 cities and 4000 villages and where over 98 percent of Egyptians live. The second are the so-called New Cities, composed of around 31 new urban settlements built in desert locations over the last four decades where 20 active, one is a mega tourist resort, and nine are under construction. Most New Cities have been built as satellites to large existing cities, and all constructed and run by a public corporation, the New Urban Communities Authority (NUCA), chaired by the Minister of Housing, Utilities and Urban Development.
6.1 The Built Environment Sectors
Six sectors were chosen to represent built environment spending based on a number of criteria (Table 4). The sectors had to make up the physical built environment, have a general public benefit, use public funds, and have budget data available at the national or sub-national levels.
Table 4: Built environment sectors by administration and projects
| Sector | Projects | ||
| National | Sub-national | ||
| Existing Built Environment | New Cities | ||
| Roads and Transportation | National Roads and Bridges | Local Roads and Bridges | Local Roads and Bridges |
| Railways | N/A | N/A | |
| N/A | Underground Metro | ||
| Public Buses | |||
| Electricity | Power Stations and Grids | Local Networks | Local Networks |
| Water | N/A | Treatment Stations & Networks | Treatment Stations & Networks |
| Waste-water | N/A | Treatment Stations & Networks | Treatment Stations & Networks |
| Housing | N/A | Social Housing Programme | Social Housing Programme |
| N/A | Middle Income Housing/ Dar Masr | ||
| Cooperative Housing Programme | N/A | ||
| Rural Housing (Desert Villages/Bedouin Housing/ Housing Repair) | N/A | ||
| Urban Development | N/A | Most Needy Villages Project | New Administrative Capital |
| Urban Renewal | |||
| Integrated Urban Development | |||
All projects included in this analysis are intended to provide public benefit. There are exceptions to this rule, which include projects directed at the middle class, such as the Cooperative Housing Program, the Median Housing Program and the luxury housing in the new capital, two profit-generating projects for the New Urban Communities Authority. The two projects also engage in sale of plots of land for profit. These projects were included to highlight the volume of public funds used in non-social projects versus those used in social projects.
General Public Benefit
All projects identified in this analysis must be accessible to the public or provide general public benefit. Some exceptions to this are the Cooperative Housing Programme and the Middle Income Housing Programme (Dar Masr), which sell housing to middle and upper middle income groups and are considered profitable. These have been included to highlight how public finance is used, especially public land. The latter project represents a large proportion of spending by a government agency, NUCA, that is supposed to focus on public projects.
Public Funds
Most of the built environment sectors in Egypt depend on public spending through state affiliated agencies. These are classified into; Government (Ministries and their offices/departments, Service Authorities directly affiliated to ministries and Local Administration offices/departments), and State-Owned-Enterprises (Economic agencies, public sector companies). SOEs are defined as publicly owned corporations through which the government undertakes commercial activities for social and economic projects.
State-Owned-Enterprises’ investments are included in this research as they play a major role in the Built Environment projects in Egypt. Other than having funding from private sources and collecting payments from companies, there is also a relationship between SOE’s and the National Treasury, where funds come in to SOE’s through the National Treasury. Revenues from SOE’s flow to the National Treasury and to quasi-fiscal expenditures as well. SOE’s budgets are independent of the General State Budget but their investments directly serve the Egyptian Economic and Social Development Program.[8]
On the other hand, there are a number of SOEs that use public money for mostly profitable construction and real estate activity, and these have not been included. One example is the Holding Company for Construction and Development and its real estate development subsidiaries, the Maadi, Heliopolis and el-Nasr companies.[9]
And while the private sector through their corporate social responsibility activities, charities, NGOs and donor agencies invest to some degree in the built environment, any of their expenditure that is exclusive to the State Budget and its agencies or that was not part of the agencies covered, is not included in the BE Budget.
Available Data
There are a number of agencies that fit the built environment criteria but that we could not find publicly available data for, and these were also not included. These include;
•The Holding Company for Water and Waste Water. Most public holding companies’ budgets are not published regularly or at all. Only the Egyptian Electricity Holding Company (EEHC) is made available as one bulk figure, published through the Ministry of Planning documents.
•So-called private funds, sanadiq khassa, investing in public housing and urban development projects and affiliated to government agencies such as the Tahya Masr Fund (Presidency) and Governorate Services’ Funds, are excluded, as their budgets are not published.
6.2 Urban Divisions and Regions
Spending has been analysed based on; regional and local projects; two local administration structures particular to Egypt (Existing BE and New Cities); and six geographic regions.
Spatial Spending 1; Regional Projects and Local Projects
Regional projects are those that cross sub-national (governorate) borders and that could not be isolated at the local level such as national highways, rail-roads and electricity generation and grids. Their spending is presented as national totals only. Local projects are those that serve communities within the administrative boundaries of governorates such as local roads and highways, water and waste-water infrastructure, housing, urban development and local electricity networks. Their spending is presented as both a national total as well as per governorate. In some cases, some local projects’ spending within one sector is not dis-aggregated, hence there are differences between the sub-national totals and the grand totals.
Spatial Spending 2; Geographic Regions
There is as yet no regional level administration, even though a provision for such a system has existed since 1977 and outlined seven or eight so-called Economic Regions.[10] In this research, we have identified six socio-geographic regions that better reveal spatial inequality and are different from the Economic Regions. They are:
•The largely urban capital metropolis of Greater Cairo (Cairo, Giza and Qalyubia)
•Egypt’s second largest city/governorate of Alexandria
•The cohesive Suez Canal zone (Port Said, Ismailia and Suez)
•The rural/industrial Delta (Damietta, Daqahlia, Kafr al-Sheikh, Beheira, Munfia, Gahrbia and Sharkia)
•The mostly rural Upper Egypt (Fayoum, Beni Sweif, Minya, Assuit, Sohag, Qena, Luxor and Aswan)
•The sparsely populated desert Frontier (Matruh, Wadi al-Gadid, Red Sea, North Sinai and South Sinai).
Administrative Divisions; Existing Built Environment and New Cities
There is an administrative distinction at the sub-national level particular to Egypt. Within the 27 sub-national governorates, Egypt has a dual local administrative structure. There are mainstream local administrations, or municipalities, that manage over 200 cities and 4000 villages,[11] where over 98 percent of Egyptians live.[12] This we have termed the Existing Built Environment (Existing BE). And then there are the 30 so-called New Cities that have been built and run by the New Urban Communities Authority (NUCA),[13] a public corporation administered at the national level by the Ministry of Housing, Utilities and Urban Development (MoH). These are referred to simply as New Cities.
6.3 Quantifying Spatial Justice
This research uses three methods to quantify spatial justice, in an effort to monitor either overspending or deprivation by between both regions and governorates.
Per Capita Expenditure
This is a simple relative method that relies on dividing expenditure in a certain scope (geographical or administrative), by the population of that scope. This is a highly relative method where it uses average or median figures within one scope as a baseline. It is better suited to comparisons between two scopes, for example between different sectors within the same geographical domains, or between different geographical domains within the same sector. Time trends are also comparable, but by only using real prices adjusted to inflation. Per capita expenditure has only been used relative to total population, excluding weights based on needs or exceptional circumstances.
Spending-to-population Ratio (SPR)
The SPR is a ratio between two percentage shares, and thus is less relative than the Per Capita method. It has a baseline of parity (1.0), which means a matching of the share of each region/governorate from the total budget and their share of the total population. If the ratio drops below 1.0, then there is underspending, which may either imply an already developed region/governorate if ratios were higher in previous years, or deprivation, if ratios have been persistently low. If the ratio is over 1.0, then either regions/governorates are being targeted to improve conditions or have exceptional circumstances (the national capital, extremely low population densities, disaster relief), or if not, then overspending may well be unjustified. In either case overspending must be based on plans with clearly defined timelines and sector targeting and should not generally exceed a ratio of 2.0 to ensure equitable development.
Spending-to-deprived-population Ratio (SPDR)
The SPDR varies from the SPR in that it uses only shares of deprived population according the Built Environment Deprivation Index (BEDI).[14] The SPDR has a baseline of parity (1.0), which means a matching of the share of each region/governorate from the total budget and their share of the total deprived population. If the ratio drops below 1.0, then there is underspending, which directly implies continued deprivation, especially if ratios have been persistently low, as spending is much lower than is needed relative to other regions/governorates. If the ratio is over 1.0, then the regions/governorates are being targeted to improve conditions quickly or have exceptional circumstances such as extremely low population densities requiring more spending on certain sectors such as transport, or disaster relief. If not, overspending may well be unjustified, as it must be based on plans with clearly defined timelines and sector targeting and should not generally exceed a ratio of 2.0 to ensure equitable development.
6.4 Expenditure Data, Sources, Government Agencies’ Information
The BE Budget has focussed only on public investments allocated to built environment projects outlined in the sectors presented in Chapter 6 of the General State Budget and other documents. This means that the rest of the expenditure budget line items are omitted.[15]
Given that the General State Budget is not published in a programs budget format, only planned allocations of Chapter 6, Investments, are relevant to this study. This allocation is concerned with investments directed to construction or developing infrastructure across sectors.
These figures provide a picture of how the government plans to spend public money on economic and social development programs, and do not reveal actual spending or information on accessibility of services.
The project collected this information from four main sources of data, all of which are published on the Internet, with the exception of the Official Gazette documents, as shown below:
A) Ministry of Finance
A1) General State Budget for FY 2016/2017 for the administrative agencies (ministries), local administration and service agencies (10 parts) http://www.mof.gov.eg/Arabic/%D8%B9%D9%86%D8%A7%D9%88%D9%8A%D9%86%20%D8%B1%D8%A6%D9%8A%D8%B3%D9%8A%D9%87/PE/Pages/budget16-17.aspx
A2) Budget of Economic Agencies (SOES) for FY 2016/2017 (published after March 2017) http://www.mof.gov.eg/Arabic/%D8%B9%D9%86%D8%A7%D9%88%D9%8A%D9%86%20%D8%B1%D8%A6%D9%8A%D8%B3%D9%8A%D9%87/Pages/Economic_bodies_budgets.aspx
B) Official Gazette
Budget Laws for economic agencies (SOEs) for FY 2016/2017, laws 20 to 49 for the year 2016, July 2016
C) Ministry of Planning, Monitoring and Administrative Reform
C1) Khittat al-Tanmiyya al-Mustadama lil-‘Am al-Mali 2016/2017, Sustainable Development Plan (formerly the socio-economic plan) for FY 2016/2017, (9 documents, an original edition was published and then replaced with a modified version some weeks later after the launch of a new website)
C2) Dalil al-Muwatin lil-Khitta al-Istithmariyya lil ‘am al mali 2016/2017, Citizen’s Guide to the Investment Plan FY 2016/2017 (The documents of the 27 governorates were posted on the Ministry’s Facebook page with a link to a Google drive between 26 November 2016 and 23 December 2016) https://www.facebook.com/pg/planning.egy/posts/?ref=page_internal
https://drive.google.com/drive/folders/0BybHPIRTQ4bKQm1YZG43ZWJqRlk
C3) Dalil al-Muwatin lil-Khitta al-Istithmariyya lil ‘am al mali 2016/2017, Citizen’s Guide to the Investment Plan FY 2016/2017 ( Only 16 documents for 16 governorates were published on the Ministry’s website sometime after publication on the ministry’s Facebook page) http://mpmar.gov.eg/internal/index/investment-plan
D) New Urban Communities Authority
D1) Khittat al-‘am al-mali 2016/2017, Financial Year Plan 2016/2017 A (Original plan accessed on 28.04.2016) http://newcities.gov.eg/about/maps/images/%D8%AE%D8%B7%D9%87%20%D8%A7%D9%84%D9%87%D9%8A%D8%A6%D9%87%20%D8%A8%D8%A7%D9%84%D8%AA%D8%B7%D9%88%D9%8A%D8%B1%202016-2017%20%20-.pdf
D2) Khittat al-‘am al-mali 2016/2017, Financial Year Plan 2016/2017 B (updated plan accessed 08.12.2016) http://www.newcities.gov.eg/about/maps/default.aspx
D3) Al-Mawqif al-Tanfidthi li Mashrua’ al-‘Asemma al-Idareyya al-Gadida, Progress Report of the New Administrative Capital Project (Slide presentation, accessed 22.02.2017) http://web.archive.org/web/20170222113630/http://newcities.gov.eg/know_cities/NewCapital/default.aspx
Acknowledgements
Reviewed by: Salma Hussein, Economic researcher, and journalist
Translated to English by: Ahmed Saleh
Lead researcher: Yahia Shawkat
Assistant researcher: MennatuAllah Hendawy
Main photograph: Khalifa District, Cairo, 2016. Yahia Shawkat
This work is licensed under a Creative Commons Attribution 4.0 license
Please reference the work as: Shawkat & Hendawy. The Built Environment Budget 2016/2017, Part I: Spatial Justice and Urban Management. The Built Environment Observatory, May 2017.
Notes
[1] New Cities exclude most middle-income households and the poor due to their high property prices, and lack of public services. For more see: Shawkat & Hendawy. Myths and Facts of Urban Planning in Egypt, November 2016 http://marsadomran.info/en/policy_analysis/urban-en/2016/11/501/
[2] The official inflation rate between FY 15/16 and 16/17 is 14.8% using June 2015 as a baseline. According to: CAPMAS. The Monthly Bulletin of Consumer Price Index (CPI), June 2016.
[3] “Raeis Sanduqay al-Tamwi al-‘Aqari wal-Iskan al-Igtimaey; Ziyadat As’ar I’lanat al-Gadida (Hiwar)”, al-Masry al-Youm, 20.03.2017 http://www.almasryalyoum.com/news/details/1105238
[4] CAPMAS. Egypt in Numbers 2016 & 2017. Population on January 1st.
[5] New Cities exclude most middle-income households and the poor due to their high property prices, and lack of public services. For more see: Shawkat & Hendawy. Myths and Facts of Urban Planning in Egypt, November 2016 http://marsadomran.info/en/policy_analysis/urban-en/2016/11/501/
[6] It is important to note however, that extremely high expenditure to population ratios on the governorate level, do not necessarily translate to equitable spending within the governorate as evidenced by a number of studies. See: 10 Tooba. The Built Environment Deprivation Indicator (BEDI), Safe Water, September 2016 http://10tooba.org/bedi/en/safe-water/ &: Tadamun. Investigating Spatial Inequality in Cairo, December 2015 http://www.tadamun.co/2015/12/15/investigating-spatial-inequality-cairo/?lang=en#.WRHZHsYlGHs
[7] Promotional video of New Alamein City, NUCA Youtube Channel 31.01.2016 https://www.youtube.com/watch?v=qTt4BIVUATs
[8] For a simple introduction to general definitions of State-Owned-Enterprises:
Natural Resource Governance Institute, State Participation and State Owned Enterprises, http://www.resourcegovernance.org/sites/default/files/nrgi_State-Participation-and-SOEs.pdf
For a more on Quasi-Fiscal Activities and their relationship to public budgets:
IBP, Guide to Transparency in Public Finances: Looking Beyond the Core Budget,
http://www.internationalbudget.org/wp-content/uploads/Looking-Beyond-the-Budget.pdf
For more general information regarding Egyptian State-Owned-Enterprises:
Budgetary and Human Rights Observatory, الهيئات الاقتصادية المصرية: موازنة خارج الموازنة
http://bahroegy.org/userfiles/pdf/arabic/Esdarat/AwrakSyasat/2700.pdf
[9] For more on the HCCD see http://www.hccd-construction.com/Hccd_main.aspx
[10] For a comprehensive list of Egypt’s Economic Regions see: GOPP. Maps of Economic Regions and their Governorates http://gopp.gov.eg/eg-map/
[11] Egypt Information Portal. Dalil al-Taqsim al-Idari lil-Muhafzat 2012. Mulakhas http://www.eip.gov.eg/DataDirectories/AdministrativeDivision.aspx
[12] For total population, figures for January 1st 2017 were used according to CAPMAS. Egypt in Figures 2017. For the population of New Cities, the proportion of residents as per the CAPMAS 2006 census was used as a base-line (1.1%) and then doubled to account for population growth that is higher than the national average.
[13] For an overview of NUCA’s New Cities see http://www.newcities.gov.eg/english/New_Communities/default.aspx
[14]A national map of quantifiable deprivation in Egypt, using indicators on affordability, tenure security, durability of housing, crowding, drinking water and sanitation. 10 Tooba. The Built Environment Deprivation Indicator (BEDI), September 2016 http://10tooba.org/bedi/en/
[15] Budget line items are arranged as follows; Salaries and Compensation (Ch 1), Purchase of Goods and Services (Ch 2), Interest, Subsidy (Ch 3), Grants and Social Benefits (Ch 4), Other Expenditures (Ch 5), Investments (Ch 6), Acquisition of Financial Assets (Ch 7), Repayment of Loans (Ch 8).