- Published on 17 June 2017
The Built Environment Budget 2016/2017, is The Built Environment Observatory’s second annual report analysing public spending on the built environment sectors in Egypt (Click here to read last year’s BE Budget 15/16). BE Budget 16/17 continues to shed light on spatial justice in Egypt by analysing public investment in Egypt’s 27 governorates, according to the six sectors that constitute the Egyptian built environment: housing, urban development, drinking water, sanitation, electricity, and transportation. As our work expands to include inflation-adjusted comparisons with last year, as well as comparisons between spending and needs based on our Built Environment Deprivation Indicator (BEDI), the BE Budget 16/17 comes in two parts, each of which investigates one of the dimensions of the BE Budget in-depth and concludes with a number of findings and recommendations.
Part I: An Overview of Spatial Justice outlines public expenditure by official agencies administered by both central ministries and local administration (governorates). The report goes on to analyse spatial justice on total spending for local projects between Egypt’s regions as well as governorates. It has a particular focus on Egypt’s dual local administration systems; the mainstream local municipalities, where more than 98% of Egyptians live, and the so-called New Cities where around 2% of Egyptians live.
In Part II: Spatial Justice by Sector, public expenditure is analysed by the six sectors that were chosen to represent the built environment; housing, urban development, drinking water, sanitation, electricity, and transportation. Per capita public expenditure, as well as Spending-to-Deprived Population Ratios (SDPR) are analysed for each sector in by region, governorate, and administrative scope (the Existing Built Environment, and New Cities).
Introduction
Part II of the BE Budget 2016/2017 analysis, Spatial Justice by Sector, gives a detailed account of public spending on the six sectors that were chosen to represent the built environment; housing, urban development, drinking water, sanitation, electricity, and transportation.
The report analyses spatial justice by sector. First on a population-based method through per capita spending by region as well as by each of the 27 governorates. And second, through a needs-based method using a Spending-to-Deprived Population Ratio (SDPR), where spending is compared to deprivation statistics available for four of the six sectors, also by region and governorate.
Spatial Justice by Sector also provides an overview of the sectors, as well as comparisons in real terms with last year’s budget to establish sector-to-sector and sectoral-geographical trends in spending. It analyses sectoral spending between the three Geo-Administrative domains which have clear social impacts; the Existing Built Environment (Existing BE for short, which is the cities and villages where 98% of Egyptians live), the New Cities (an administrative exception where 2% of Egyptians live), and Regional Projects (projects whose impact is not limited to a local scale).
Based on the report’s intention to promote just development, Spatial Justice by Sector concludes with a number of recommendations to ensure the equitable geographical distribution of public spending.
1 Summary and Conclusions
The spatial inequities revealed in Part I of the BE Budget 16/17 report have come out in more sectoral and geographical detail here.
1.1 Big increases in sectoral budgets failed to address spatial inequity
Focusing on the Existing BE, all six sectors witnessed gains in planned spending in real terms ranging from a low of 10% for transport, to an extraordinary high of 276% in housing (Figure 1).[1]
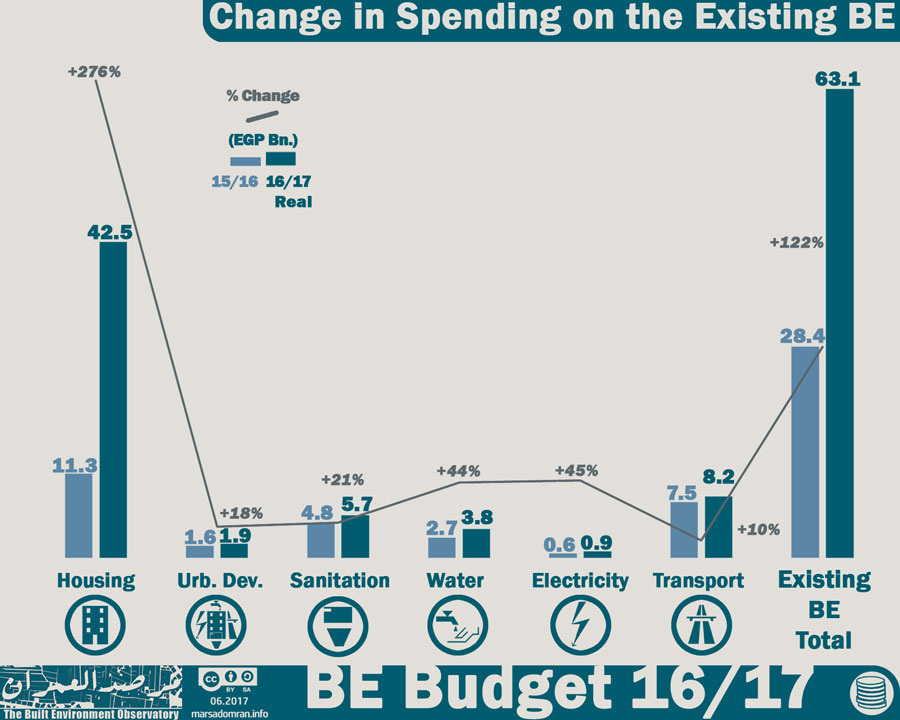
Figure 1: Change in spending on the Existing BE on FY 15/16
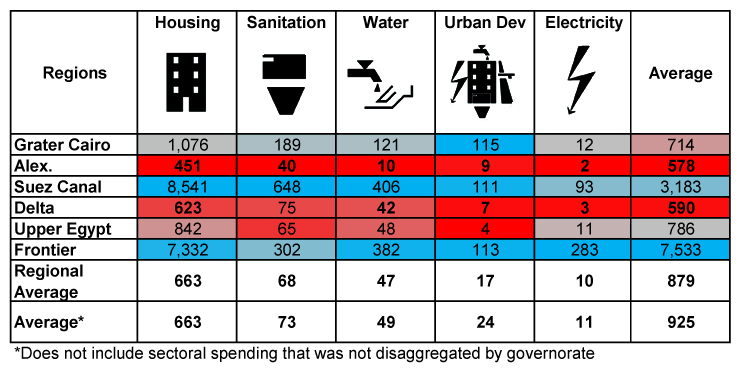
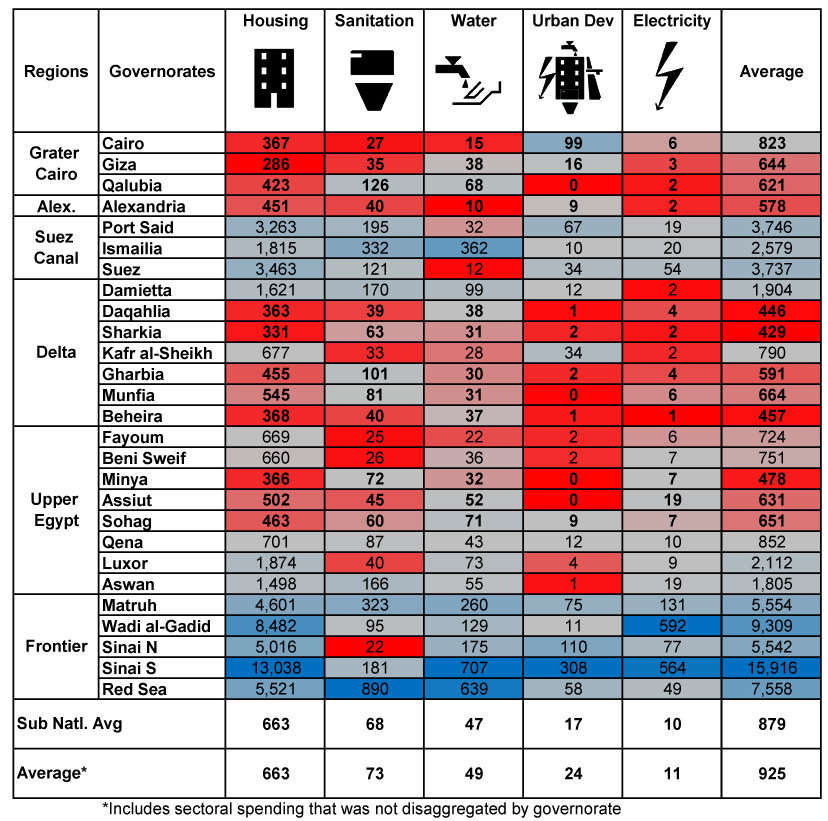
However, these gains failed to even out regional differences in per capita spending, where regions defined as deprived in last year’s report, also came out deprived this year (Table 1). Alexandria had consistently below average, or well below average per capita spending in all five sectors analysed; housing, sanitation, water, urban development, and electricity. The Delta had below average spending in four of the five sectors, with barely above average spending for sanitation. In Upper Egypt, per capita spending was below average in two sectors, sanitation and urban development, and average in the rest.
Table 1: Per capita spending on the Existing BE by Sector and Region (EGP/person)
1.2 Huge increases in public spending not based on sectoral-geographical needs
In all four sectors, the Spending-to-Deprived Population Ratio (SDPR) varied considerably within each sector, ranging from well below par (1.0, portion of spending equal to portion of deprived population, for more see Methodology; SDPR), to very well above par, an ominous sign that spending does not mirror needs (Figure 2).
The more equitable of the sectors in this regard was water, where the SDPR in only one region, Upper Egypt, was below par. However, spending was near par in only one region, and above or well above par in the remaining three. In comparison, spending on housing and urban development was below par in three of the six regions, and above or well above par in the remaining three.
On the regional level, it was shocking to see how Upper Egypt, a region long considered to be deprived, to score consistently below par (1.0) in all four sectors, with a high of 0.8 in housing, and only 0.5 in the three other sectors. The Delta was the second most deprived region, while Greater Cairo and Alexandria, had SDPRs that ranged from below par to above par. The Suez Canal and the Frontier, had generally well above par SDPRs in all four sectors, an indication of unjustified overspending in these two regions.
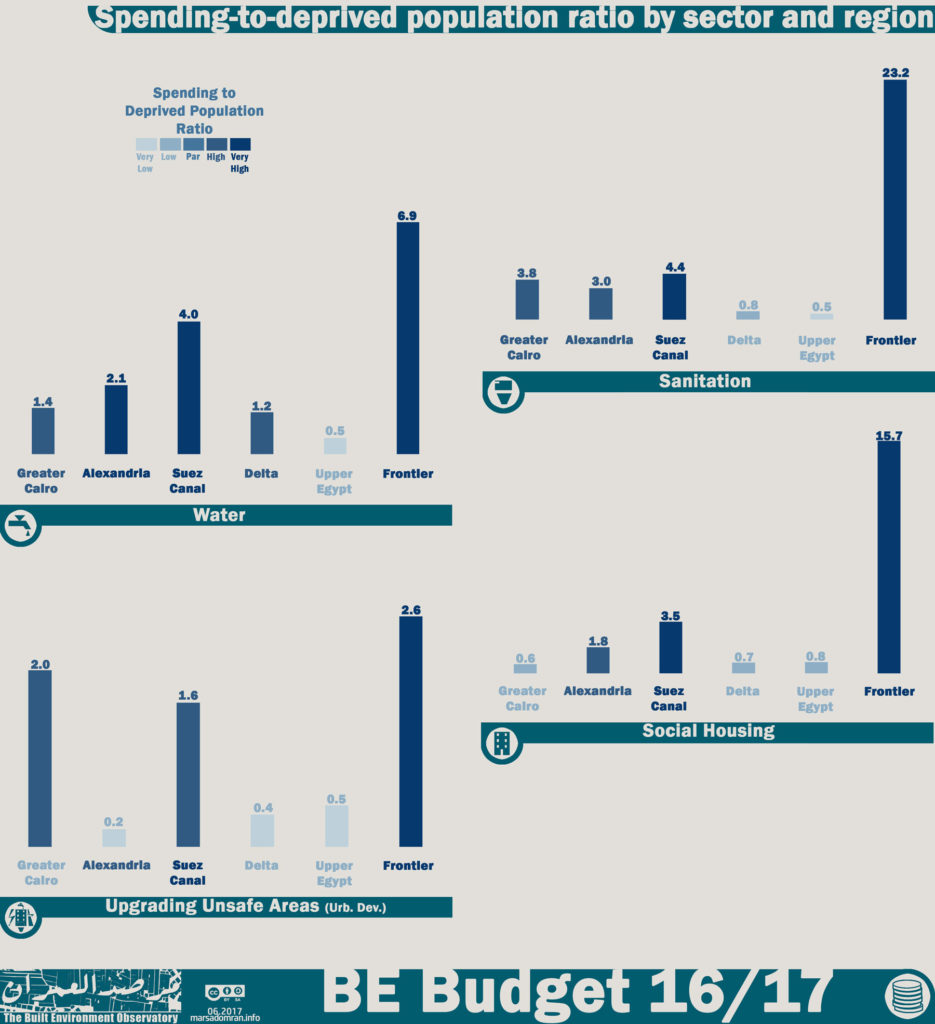
Figure 2: Spending-to-deprived population ratio by sector and region
1.3 Complex web of government agencies hinders equitable development
Twelve agencies affiliated to four central ministries, in addition to two agencies affiliated to governorates, as well as the offices of 27 governorates make for a highly complex, and inefficient administrative body that operates on national, regional and governorate levels through branches and subsidiaries.
The clear and unjustified duality of the Existing BE, the cities and villages where 98% of Egyptians live, and New Cities, where only 2% of Egyptians live, has also produced massive inequity in public spending. Spending on local electricity networks was higher in 14 of the 20 governorates that had New Cities. In water, spending on New Cities was higher or close to equal in seven governorates. Most glaring was the Sharkia governorate where one New City, the 10th of Ramadan, received 2.8 times more spending than the 15 cities and almost 500 villages that make up the Existing BE there. In sanitation, three governorates saw more public spending on sanitation in New Cities than on the cities and villages of the Existing BE, while another three governorates had spending close to equal.
1.4 A significant portion of the budget was unrealistic
Alas, the phenomenal increases in planned spending were too good to be true. Where housing saw the biggest spending increase, becoming the largest BE Budget sector making up 39%, it has also witnessed possibly the biggest drawback in spending. The Ministry of Finance has recently projected that by the end of FY 2016/2017, only 30% of its planned budget would have been spent,[2] thereby reducing the spending gain on last year to only 19%.
Underspending may also prove true for some of the other sectors as the FY 16/17 budget is drawing to a close, and the FY 17/18 budget is being prepared (For more on planned versus actual spending, see BE Budget Part III, forthcoming).
2 Recommendations
Following up on the recommendation for needs-based and participatory economic and social plans in BE Budget Part I, here the recommendations focus on the elimination of the administrative and fiscal duality of New Cities the Existing BE to ensure spatial justice between regions, governorates, as well as the Existing BE and the New Cities.
B-1) Short-term Restructuring
•Merge national-level funding agencies, namely the Social Housing Fund, the Guarantee and Subsidy Fund, and the Informal Settlements Development Facility into a National Urban Development Fund (NUDF), able to spend on all six sectors in the built environment according to needs and governorate-level deficits.
•Transfer one third of revenue from the New Urban Communities Authority (NUCA) to the NUDF to fund its various needs-based projects.
•Merge governorate-level funds (sanadiq khassa) that fund housing and development, into Local Urban Development Funds (LUDFs) and restructure them to fund all six built environment sectors according to needs.
•Merge national-level executive agencies that work on local-level projects, namely the Construction Authority for Potable Water and Wastewater (CAPWW) and the National Organisation for Potable Water and Sanitary Drainage (NOPWSD), into the existing Central Agency for Construction (CAC). This agency would receive funding from the NUDF and implement projects in all six sectors locally through its existing regional branches.
•Transfer all regional highway projects that the CAC has been implementing to the General Authority for Roads, Bridges and Land Transport (GARBaLT) that already is entrusted with regional highways.
•Transfer local inter-county highways and local bridges from GARBaLT to the CAC.
B-2) Medium-term Restructuring
•Transform the regional branches of the CAC into governorate-level Local Agencies for Construction (LACs) with governors and Local Popular Council (LPC) heads on the board, and dissolve the CAC at the national level.
•Transfer NUCA’s local branches, the so-called City Agencies (Aghezat al-Mudun), to the relevant governorates, and dissolve NUCA.
•Transfer revenue from the City Agencies to both the NUDF and the LUDFs at a ratio of 1:2.
•Expand capacity of the LUDFs to manage the local construction agency branches, while expanding participation through empowered LPCs on their boards.
B-3) Long-term Restructuring
•Transfer the executive arm of the City Agencies into the LACs, and the administrative/fiscal arm to local administration (municipalities).
3 Population-based Spatial Justice
In this section of our analysis, we measure spatial justice through per capita expenditure by sector (For more see: Methodology; Per Capita Calculation). First at the regional, and then at the governorate level in the Existing BE only, where the social impact of spending is felt the most. Detailed per capita spending on the governorate level was only available for five of the six sectors chosen to represent the built environment, thus excluding spending on transport. [3] Spending on housing focuses only on the total allocation of the Social Housing Project per governorate,[4] while that for urban development focuses only on the large National Project to Upgrade Unsafe Areas.[5]
3.1 Per Capita Spending by Region
It was a surprise to find near consistent regional spending patterns between the different sectors, where Alexandria had consistently below average, or well below average per capita spending in all five sectors (Transport has not been included because of lack of disaggregated data for a main project), coming last in four of them (Table 2). This was surprising as Alexandria is considered Egypt’s second most important city. It was almost the case with the Delta and Upper Egypt regions, which was not surprising considering these largely rural regions have generally been considered deprived. The Delta had below average spending in four of the five sectors, with barely above average spending for sanitation. In Upper Egypt, per capita spending was below average in two sectors, and average in the rest. Greater Cairo, the Capital’s region, received above average per capita spending across all sectors, and had the highest spending on urban development (mostly slum clearance and rehousing). Per capita spending in the Suez Canal region was well above average in all five sectors, receiving the highest spending on housing, sanitation, and water. The Frontier governorates had the highest overall per capita spending, with well above average spending in all sectors and leading in electricity.
Table 2: Per capita spending on the Existing BE by Sector and Region (EGP/person)
3.2 Change in Per Capita Spending by Region on FY 15/16
Analysing per capita spending by sector, after isolating spending on the largest subsidised housing project, the Social Housing Project (SHP), total per capita spending equated to EGP 602 per person, which is an extraordinary 259% up on last year’s per capita share in real terms (Figure 3). However, as demand for the project has been lower than expected, the Ministry of Finance has recently projected that by the end of FY 2016/2017, only 30% of the planned budget would have been spent,[6] thereby reducing the spending gain on last year to 19%.
Going back to planned spending, despite the extraordinary boost, spatial inequity continued. The four regions that had received below average spending in FY 15/16, Greater Cairo, Alexandria, the Delta and Upper Egypt, still had below average per capita spending in FY 16/17. On the other hand, the two regions with much higher per capita spending in FY 15/16, Suez Canal and the Frontier, not only remained much higher than average in FY 16/17, but also received the largest boosts to spending of 369% and 338% respectively. This has meant that per capita spending on the Frontier region grew from 7.2 times the national average to 8.9 times the national average.
Per capita spending on sanitation stations and networks in the Existing BE saw a modest rise of 18% in real terms, rising to a national average of EGP 62 per person. As with spending on housing, the two regions with well above average spending in FY 15/16, Suez Canal and the Frontier, saw the largest boost of 67% and 44% respectively, while both the Delta and Upper Egypt regions received boosts that were above average (24% and 32% respectively, per capita spending there remained below the national average. On the other hand, per capita spending in Greater Cairo and Alexandria fell by 26% and a considerable 48% respectively, bringing per capita spending there below average in FY 16/17.
Water saw a welcome rise in per capita spending by 40% on last year, climbing from EGP 30 to EGP 42 per person in real terms. It also the thrid sector to experience the same pattern of ini-equitable rise in spending, where per capita spending in the Suez Canal and Frontier regions, remianed well above average, with the former receiving an incredible 250% boost. With near average rises in per cpaita spending in the deprived Delta and Upper Egypt regions, spending there remains slightly below average for the second year running. Spending on the well-served Greater Cairo region rose by 17% but remained below average, however, spenidng in Alexandria dropped by a phenomenal 60% to less than a quarter of the national average.
In the urban development sector, only the National Project to Upgrade Unsafe Areas was analysed, as it was the only significant project to be implemented almost nation-wide, as well as having disaggregated data available. Overall, the project saw a boost of 82% in per capita spending in real terms, to EGP 14 per person. On the regional level, Greater Cairo saw the biggest boost by 360% on last year, raising it from just above average, to 2.7 times the national average per capita. As with the other sectors, the Suez Canal and Frontier regions had per capita spending much higher than average, despite considerable drops in spending on last year by 23% and 68% respectively. Spending in Alexandria remained largely the same, meaning that it dropped from average to below average, while spending on the Delta and Upper Egypt was still well below average, even though the former rose by 262% and the latter dropped by 11%.
Per capita spending on local electricity networks rose by 23% on last year in real terms to EGP 8.3 per person. It was no surprise that spending was above average in the Suez Canal region and well above average in the Frontier region, even though it dropped by 9% in the former, but rose by 100% in the latter. Upper Egypt was the only region with average per capita spending, while it was below average in Greater Cairo and the Delta, and well below average in Alexandria despite an 18% rise.
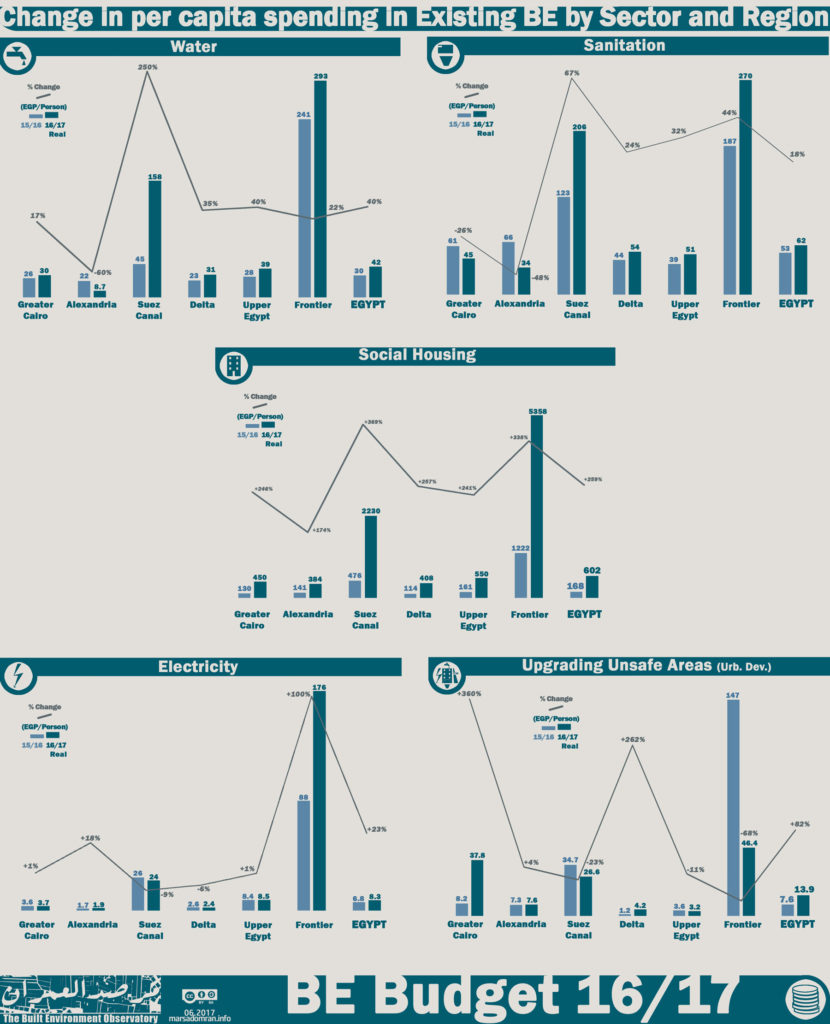
Figure 3: Change in per capita spending in the Existing BE by Sector and Region
3.3 Per Capita Spending by Sector and Governorate
As with the regional analysis, it was a surprise to find patterns of either deprivation or over-spending for the same governorates across different sectors, with either consistently low per capita or consistently high (Table 3). [7] At first glance, this may mean that budgets do not take population numbers into account. However, the clustering of deprived as well as well funded governorates across a region, as well as the persistence of the same spending year on year, says that population numbers, and with it, a basic measure of needs, do not shape the budgets across all analysed sectors.
Sharkia, Daqahlia and Beheira governorates in the Delta had the lowest per capita spending, with mostly well below average spending in all five sectors. Overall, all governorates in the Delta, bar the industrial Damietta, had below average per capita spending.
In Upper Egypt, Fayoum, Beni Sweif and Minya all had below average spending in four of the five sectors, with the latter having the lowest per capita spending in that region. Overall, only two of Upper Egypt’s eight governorates had higher than average per capita spending; the touristic governorates of Luxor and Aswan.
Alexandria, considered the Egypt’s second most important city, had below average spending on all five sectors, with an overall average of two thirds the national average per capita.
All three governorates in the Suez Canal region had well above average spending in four of the five sectors, with Port Said and Suez only receiving below average spending on water, and Ismailia on urban development.
Table 3: Per capita spending on the Existing BE by Sector and Governorate (EGP/person)
By sector, Giza saw the lowest per capita spending on housing, EGP 286, almost one third of the national average, while the highest governorate was South Sinai which received 20 times the national per capita (Figure 4). In sanitation, North Sinai was the lowest funded, at EGP 22 per capita, while the Red Sea received the highest funding at EGP 890 per person, or 13 times the national average.
The contrasts were also very big in the water sector, where at EGP 10 per person, Alexandria received the lowest per capita funding, barely a fifth of the national average of EGP 47 per person. On the other hand, South Sinai received 15 times the national average. In urban development Qalubia, Menufia, Minya and Assuit all received zero funding, while South Sinai led again at 18 times the national average of EGP 17 per person. At EGP 1 per person, Beheira had the lowest per capita spending on local electricity networks, while Wadi al-Gadid received over 500 times that amount.
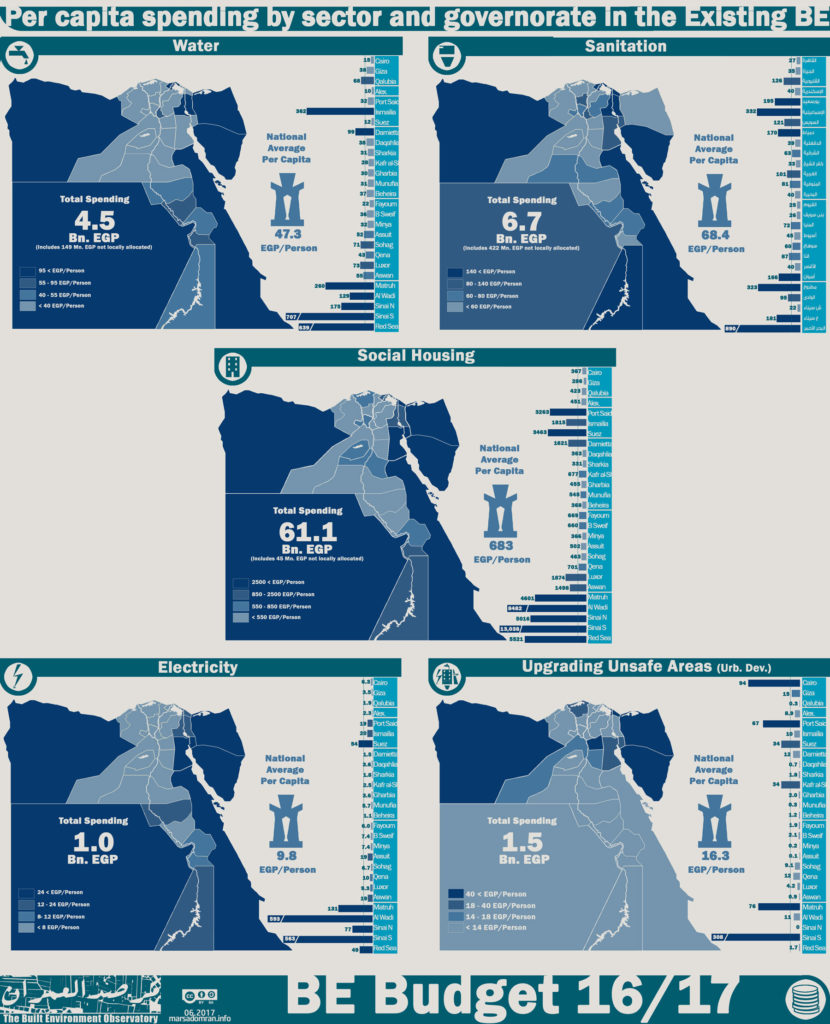
Figure 4: Per capita spending by sector and governorate in the Existing BE
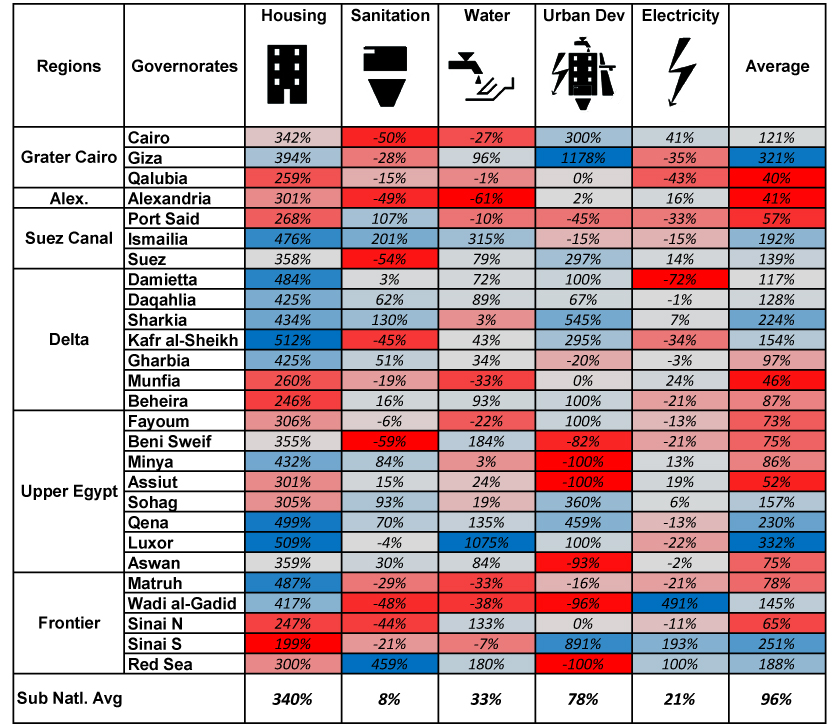
3.4 Change in Per Capita Spending by Sector and Governorate on FY 15/16
In real terms, per capita spending was up in all five sectors, where the Social Housing Project (housing) saw the biggest change at 340% (Table 4). This change was largely uniform across the governorates, with a low of 199% in South Sinai, and a high of 512% in Kafr al-Sheikh. AS mentioned before, recent budget documents reveal a large gap between this planned spending, and what was actually spent, meaning that a large portion of these increases has not happened.
In urban development, spending on the National Project to Upgrade Unsafe Areas rose by 78% in real terms. This gain was not not uniformly distributed, as despite the big boost, per capita spending dropped in eight governorates, where funding was completely cut in Minya, Assuit and the Red Sea. Giza had the biggest gains of 1178%, followed by South Sinai with 891% more per capita spending than last year.
Per capita spending on water saw the third largest increase, though of 33% and with a wider range, where spending dropped in nine governorates, led by Alexandria with a 61% drop in spending on last year. On the other hand, the biggest jump in per capita spending was in Luxor, at a massive 1075%.
Electricity witnessed the fourth highest increase between the sectors, of 21%. However, at the governorate level 15 governorates had spending cut by between one and 72%, with Damietta receiving the biggest cuts. Wadi al-Gadid on the other hand, saw spending jump by 491%.
Spending on Sanitation saw the smallest increase, of only eight percent in real terms, where cuts were made in over half the governorates. The biggest of these was on Beni Sweif in Upper Egypt, where per capita spending dropped by 59%. Spending was up in five of the eight Upper Egyptian governorates, while the Red Sea saw the highest increase of 459%.
Table 4: Change in per capita spending on FY 15/16 by sector and governorate in real terms
4 Needs-based Spatial Justice
While per capita spending shows how funds are spent depending on the number of people, the Spending-to-Deprived Population Ratio (SDPR) measures spending according to needs (For more see: Methodology; SDPR). Here, only four of the six sectors were analysed (housing, urban development, water and, sanitation), [8] where governorate level data was available for both spending and needs.[9] As with per capita spending, the SDPR was analysed at both the regional and the governorate levels for spending in the Existing BE where almost all needs are, as New Cities are very well served by comparison.
In general, an SDPR 1.0 means a matching of the share of each region/governorate from the total budget and their share of the total deprived population. If the ratio drops below 1.0, then there is underspending, which directly implies continued deprivation. If the ratio is between 1.0 and 2.0 then the regions/governorates are being targeted to improve conditions quickly or have exceptional circumstances, An SDPR over 2.0 could be considered as unjustified overspending.
4.1 Spending to Deprived Population Ratio (SDPR) by Region
In all four sectors, the SDPR varied considerably within the sector, ranging from well below par, to very well above par, an ominous sign that spending does not mirror needs (Figure 5). The more equitable of the sectors in this regard was water, where the SDPR in only one region, Upper Egypt, was below par. However, spending was near par in only one region, the Delta, and above or well above par in the remaining three. In comparison, spending on housing and urban development was below par in three of the six regions, and above or well above par in the remaining three.
On the regional level, it was shocking to see how Upper Egypt, a region long considered to be deprived, to score consistently below par (1.0) in all four sectors, with a high of 0.8 in housing, and only 0.5 in the three other sectors. The Delta was the second most deprived region, scoring below par in three sectors, and had near par spending only on water.
Only two regions, Greater Cairo and Alexandria, had SDPRs that ranged from below par to above par, with the former only scoring low in housing, and the latter in urban development. The remaining two regions, the Suez Canal and the Frontier, had generally well above par SDPRs in all four sectors, bar urban development in the Suez Canal region, which was above par. This is an indication of unjustified overspending in these two regions.
Figure 5: Spending-to-deprived population ratio by sector and region
4.2 Spending to Deprived Population Ratio (SDPR) by Governorate
The governorate level maps give us more detail on the spatial inequity of spending (Figure 6). As with the regional analysis, spending according to needs within each of the four sectors was highly varied, with a range of zero to 65 times the number of deprived people. Urban development had a relatively more equitable SDPR of the four sectors, with a range of zero to 10.5. Even so, the Red Sea, North Sinai, Munufia scored zero, and ten other governorates scoring well below par. By comparison, Damietta, Suez, Matruh and Wadi al-Gadid were more than well-funded relative to their needs.
Despite a large boost in spending on housing, and the largest budget by far among the sectors, eleven governorates saw SDPRs of below and well below par, five of them in Upper Egypt, and four in the Delta. At the other end of the scale, South Sinai and Wadi al-Gadid scored 37 and 32.8 respectively, indicating massive overspending compared to needs. This conclusion was not a surprise, as all 27 governorates received near identical budgets, a clear indicator of how the budget distribution process did not follow any equitable development standards.
Sanitation saw extremely inequitable spending in Upper Egypt, where seven out of its eight governorates had below par SDPRs, and Fayoum scoring only 0.2. Four of the seven governorates in the Delta had below par SDPRs, with two near par, and Damietta well above. All governorates in Greater Cairo, Alexandria, the Suez Canal and the Frontier regions had SDPRs of above or well above par, where the Red Sea scored a very high 56.
While Water did well in the regional SDPR, at the governorate level, it fared badly. Six out of the eight Upper Egypt governorates had SDPRs lower than 1.0, four of which were lower than 0.5, with Fayoum again coming bottom. The touristic Luxor and Aswan governorates scored an on par 1.0 each. The Delta had the greatest disparity with one region, with two governorates, Munufia and Gharbia scoring below 1.0, while Damietta scored an extremely high 64.6, the highest SDPR across all sectors. The Greater Cairo and Suez Canal Regions also had disparities within them, with one governorate scoring below par, and two scoring above, or well above par. The Frontier governorates were all well above par, with the two neighbouring governorates, North Sinai and South Sinai scoring the lowest (3.1) and highest (25) of the region respectively.
Focusing on the governorates, it was shocking to see that Minya, Assuit and Qena in Upper Egypt were the three most deprived governorates, scoring consistently below, or well below par across all four sectors. Five governorates scored below par in three of the four sectors analysed; Fayoum, Beni Sweif and Sohag in Upper Egypt, and Daqahlia and Sharkia in the Delta.
At the other end of the scale, four governorates consistently scored well above par SDPRs. Ismailia and Suez in the Suez Canal region, and Matruh and South Sinai in the Frontier.
![]()
Figure 6: Spending-to-deprived population ratio by sector and governorate
5 Background on Sectoral Spending
Out of a total of EGP 187 Bn in public spending, housing had the largest share at almost 40% of the budget, followed by electricity and transport (36% and 14% of the budget respectively) (Figure 7). This was a clear departure from last year’s ranking, where electricity received the highest spending, followed by transport, and then housing. The three other sectors, water, sanitation, and urban development all made up the remaining 11% of the budget.
Spending in FY 16/17 was even more uneven among the sectors, where the top three sectors took up 89% of spending, in comparison to 78% of spending in the previous year. However, this change is partly due to a dis-aggregation of the Urban Development sector in New Cities, where part of that budget has been allocated under housing.
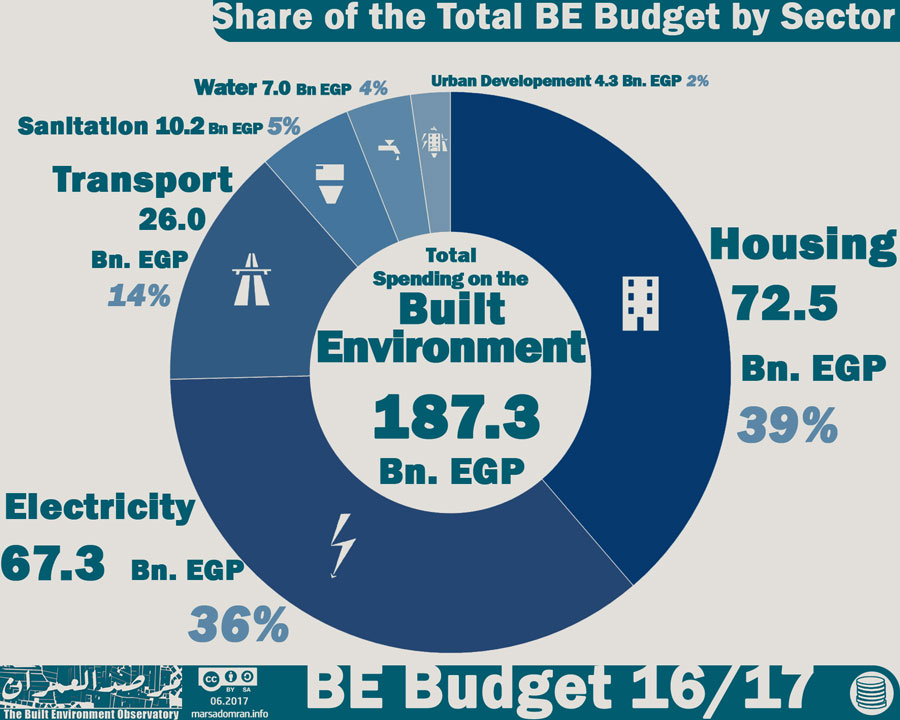
Figure 7: Share of the BE Budget by Sector
5.1 Spending by Geo-Administrative Domain
About 40% of the Built Environment Budget for FY 2016/17 is spent on all six sectors in the Existing BE, where 98% of Egyptians live (Table 5). Another 40% is spent on Regional Projects in two sectors; electricity (power stations and networks), and transport (railroads and regional highways). The remaining fifth is spent on all six sectors in New Cities, home to only 2% of the population. The latter spending is mostly on real estate investments where new land subdivisions are prepared and sold, as well as spending on both for profit housing schemes and public housing.
Table 5: Spending by Geo-Admin. Domain and Sector
| Housing | Electricity | Transport | Sanitation | Water | Urban Development | TOTAL | |
| Existing BE | 49,923,214,000 | 1,033,000,000 | 9,660,058,000 | 6,721,800,000 | 4,502,600,000 | 2,207,000,000 | 74,047,672,000 |
| 68.8% | 1.5% | 37.1% | 65.7% | 64.3% | 51.6% | 39.5% | |
| New Cities | 22,593,318,000 | 3,858,244,000 | 4,395,329,000 | 3,509,619,000 | 2,494,790,000 | 2,070,000,000 | 38,921,300,000 |
| 31.2% | 5.7% | 16.9% | 34.3% | 35.7% | 48.4% | 20.8% | |
| Regional Projects | 0 | 62,364,500,000 | 11,987,500,000 | 0 | 0 | 0 | 74,352,000,000 |
| 0.0% | 92.7% | 46.0% | 0.0% | 0.0% | 0.0% | 39.7% | |
| Total | 72,516,532,000 | 67,255,744,000 | 26,042,887,000 | 10,231,419,000 | 6,997,390,000 | 4,277,000,000 | 187,320,972,000 |
| 38.7% | 35.9% | 13.9% | 5.5% | 3.7% | 2.3% | 100.0% |
5.2 Spending by Agency and Sector
The array of public agencies investing in the built environment has stayed largely the same, with 14 agencies affiliated to four ministries and 27 governorates (Table 6). However, the Guarantee and Subsidy Fund has lost its investment facility and is on its way to be merged with the Social Housing Fund (SHF). While for this year, data on spending by a number of relatively small State-Owned Enterprises (SOEs) affiliated to the Ministry of Electricity has been accessed, and thus included as a lump sum.
In terms of sectoral involvement, the Ministry of Housing remained the only ministry to spend on all six built environment sectors, specifically through its New Urban Communities Authority (NUCA), which was the only agency to do so. The Central Agency for Construction, also affiliated to the MoH, spent on four sectors, while the 27 governorates worked in three sectors. The remaining agencies only invested in one or two sectors each.
What this analysis reveals, is a massive web of mostly central government agencies, which operate on national, regional and governorate levels through branches and subsidiaries. It is a complex state of affairs that undoubtedly produces many inefficiencies in both planning and implementation.
Table 6: Spending by Agency and Sector
| Agency | Water | Sanitation | Transport | Electricity | Housing | Urban Development | TOTAL | |
| Ministry of Housing, Utilities & Urban communities | New Urban Communities Authority (NUCA)* | 2,494,790,000 | 3,509,619,000 | 4,395,329,000 | 3,858,244,000 | 22,593,318,000 | 2,070,000,000 | 38,921,300,000 |
| Central Agency for Construction (CAC) | 0 | 0 | 1,697,800,000 | 74,000,000 | 158,400,000 | 112,000,000 | 2,042,200,000 | |
| Social Housing Fund (SHF)** | 0 | 0 | 0 | 0 | 49,713,314,000 | 0 | 49,713,314,000 | |
| General Authority for Cooperative Construction and Housing | 0 | 0 | 0 | 0 | 51,500,000 | 0 | 51,500,000 | |
| Informal Settlements Development Facility (ISDF) | 0 | 0 | 0 | 0 | 0 | 1,500,000,000 | 1,500,000,000 | |
| Construction Authority for Potable Water and Wastewater (CAPWW) | 3,642,100,000 | 1,840,300,000 | 0 | 0 | 0 | 0 | 5,482,400,000 | |
| National Organisation for Potable Water and Sanitary Drainage (NOPWSD) | 860,500,000 | 4,881,500,000 | 0 | 0 | 0 | 0 | 5,742,000,000 | |
| Sub-total | 6,997,390,000 | 10,231,419,000 | 6,093,129,000 | 3,932,244,000 | 72,516,532,000 | 3,682,000,000 | 103,452,714,000 | |
| Ministry of Transport | General Authority for Roads, Bridges and Land Transport (GARBaLT) | 0 | 0 | 6,982,000,000 | 0 | 0 | 0 | 6,982,000,000 |
| National Authority for Tunnels (NAT) | 0 | 0 | 5,082,258,000 | 0 | 0 | 0 | 5,082,258,000 | |
| Egyptian National Railways (ENR) | 0 | 5,197,000,000 | 0 | 0 | 0 | 5,197,000,000 | ||
| Sub-total | 0 | 0 | 17,261,258,000 | 0 | 0 | 0 | 17,261,258,000 | |
| Ministry of Electricity & Renewable Energy | Electricity SOEs*** | 0 | 0 | 0 | 6,859,500,000 | 0 | 0 | 6,859,500,000 |
| Egypt Electricity Holding Company (EEHC) | 0 | 0 | 0 | 55,505,000,000 | 0 | 0 | 55,505,000,000 | |
| Sub-total | 0 | 0 | 0 | 62,364,500,000 | 0 | 0 | 62,364,500,000 | |
| Governorates | Offices of the 27 Governorates | 0 | 0 | 2,238,500,000 | 985,700,000 | 0 | 95,000,000 | 3,319,200,000 |
| Cairo Transport Authority (CTA) | 0 | 0 | 250,000,000 | 0 | 0 | 0 | 250,000,000 | |
| Alexandria Public Transport Authority (APTA) | 0 | 0 | 200,000,000 | 0 | 0 | 0 | 200,000,000 | |
| Sub-total | 0 | 0 | 2,688,500,000 | 985,700,000 | 0 | 95,000,000 | 3,769,200,000 | |
| Ministry of Local Development | Office of the ministry | 0 | 0 | 0 | 0 | 0 | 500,000,000 | 500,000,000 |
| Total | 6,997,390,000 | 10,231,419,000 | 26,042,887,000 | 67,282,444,000 | 72,516,532,000 | 4,277,000,000 | 187,347,672,000 | |
| * Include investments in the New Administrative Capital and the Social Housing Project ** The share of NUCA was omitted to avoid dual counting. The total allocated to the SHF in the state budget is EGP 61,027,000,000 *** No detailed breakdown by agency was provided |
||||||||
5.3 Change in Spending by Geo-Administrative Domain on FY 15/16
In real terms, public spending on the built environment was up by a full 61% on last year, where exceptionally boosted spending on housing (up by 165%) and electricity (up by 102%) were the main fatcors (Figure 8). Spenidng was only up 13% for water, though sanitation, transport and urban development all saw spending decline considerably in real terms. For the latter, the decline was mostly due to a reassignment of part of the New Admisntrative Capital as housing, as more dsiaggregated data on the project was available this year.
Spending on the Existing BE jumped by 122% in real terms over FY 15/16, most of it due to a boost in spending on the Social Housing Project by an exceptional 276%. Despite an official inflation rate 14.8%, the remaining five sectors received boots in planned spending of between 10% (transport) and 45% (electricity). However, considerable variations between planned and actual spending in previous financial years where data is available (the final accounts for FY 15/16 are still unpublished), mean that these gains may not be implemented (For more on this see the forthcoming Part III of the report).
In comparison to the Existing BE, spending on New Cities received a modest increase of 11% in real terms, with most of the gain driven by a considerable boost to the Social Housing Project (61%), also implemented there. However, only two other sectors received more spending, where electricity and transport (local roads), were 37% and 38% higher on last year respectively. Spending on water and sanitation decreased by a considerable 18% and 42% respectively. And while spending on urban development also decreased noticeably (by 65%), this is due to more disaggregated data on the New Administrative Capital project compared to last year, where about half its budget has been identified for housing, and the rest remains a lump sum for infrastructure.
Spending on Regional Projects was up 56% on last year, due to a massive increase in spending on electricity by 110%. However, spending on transport was down by a considerable 34% on last year.
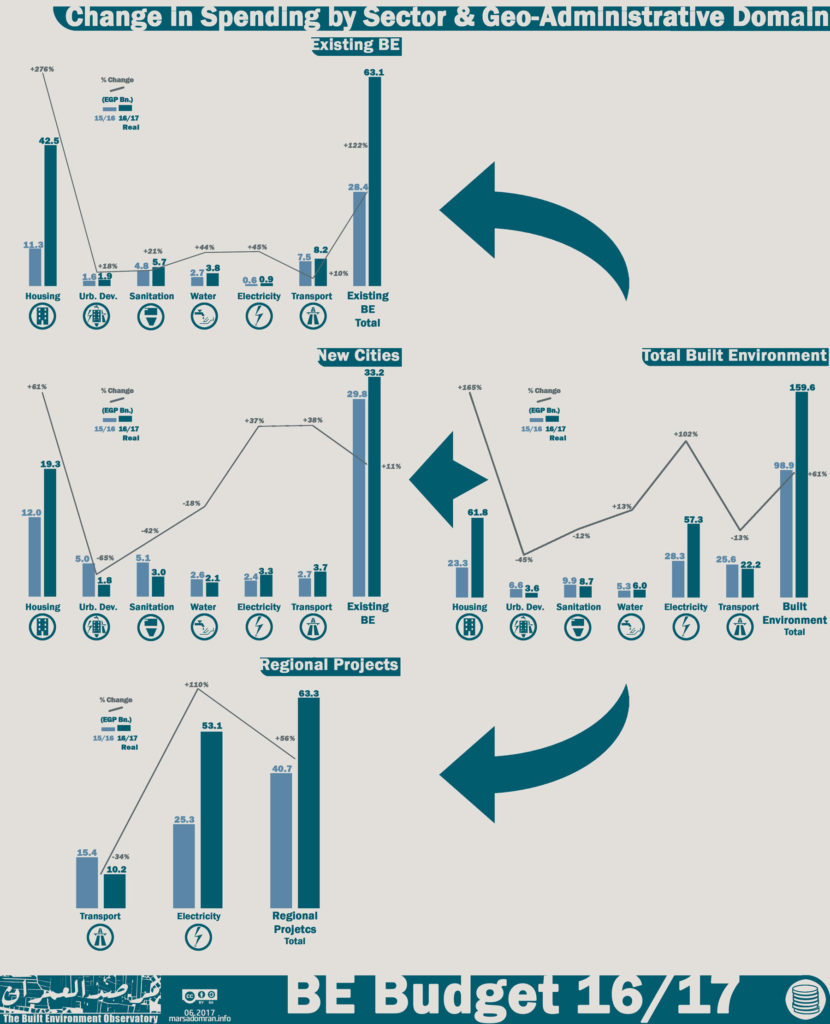
Figure 8: Change in spending by Geo-Administrative Domain on FY 15/16
5.4 Housing
The two types of government-built housing; subsidised and for profit, continue this year. 90 percent of the housing budget has been allocated to subsidised housing, almost all of which goes to the Social Housing Project (EGP 65.1 Bn), while less than one percent goes to Rural Housing, Cooperative Housing, and repair projects (Figure 9). The remaining ten percent of public spending on housing is allocated to the profitable Dar Masr project (7%), as wells as for-profit housing in the New Administrative Capital (3%), both of which are exclusive to New Cities.
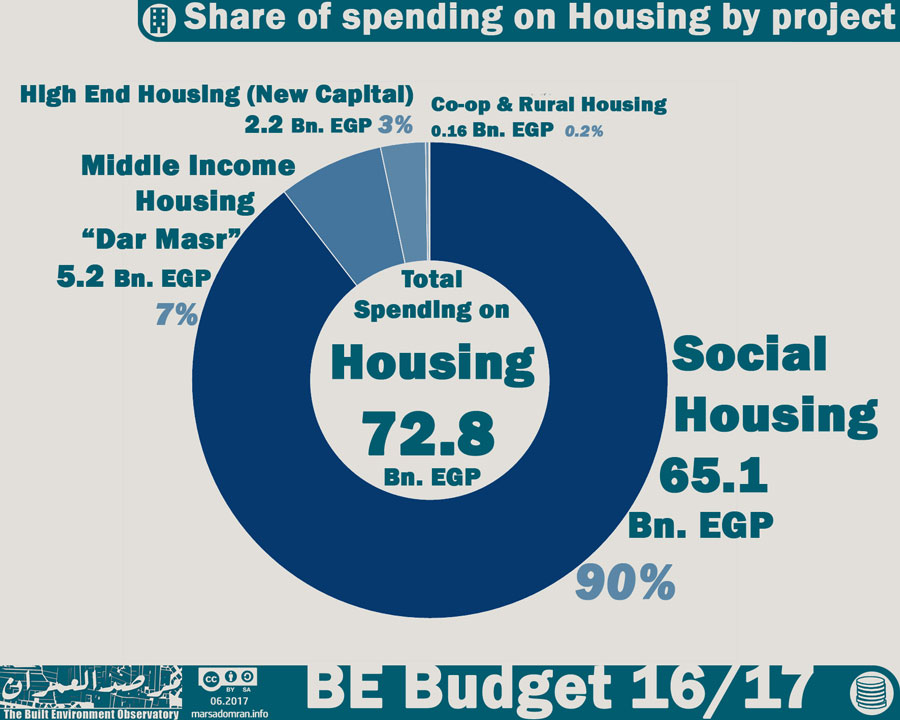
Figure 9: Share of spending on Housing by project
Four agencies, all affiliated to the Ministry of Housing, spent EGP 72.8 Bn on housing (Table 7). We have been able to roughly estimate that 31% of this spending was by NUCA in the New Cities, however there were discrepancies in the data preventing a definitive outcome.[10] Of these agencies the SHF was the largest spender by far, with an allocation of 69% of the housing budget, followed by NUCA spending 31% of the budget on three projects. Two agencies had to make do with less than 1% of the budget, the CAC and the General Authority for Cooperative Construction and Housing.
Table 7: Spending on Housing by Agency and Geo-Administrative Domain (EGP)
| Ministry | Ministry of Housing | Ministry of Housing | Ministry of Housing | Ministry of Housing | TOTAL | |
| Agency | New Urban Communities Authority (NUCA)* | Central Agency for Construction (CAC) | Social Housing Fund (SHF)** | General Authority for Cooperative Construction and Housing | ||
| Projects | Social Housing Project Dar Masr New Capital |
Rural Housing | Social Housing Project | Cooperative Housing | ||
| Existing BE | 0 | 158,400,000 | 49,713,314,000 | 51,500,000 | 49,923,214,000 | 69% |
| New Cities | 22,593,318,000 | 0 | 0 | 0 | 22,593,318,000 | 31% |
| Total | 22,593,318,000 | 158,400,000 | 49,713,314,000 | 51,500,000 | 72,516,532,000 | 100% |
| 31.2% | 0.2% | 68.6% | 0.1% | 100.0% | ||
| * Includes investments in the New Administrative Capital and the Social Housing Project ** The share of NUCA was omitted to avoid dual counting. The total allocated to the SHF in the state budget is EGP 61,027,000,000 |
||||||
Planned spending on housing was up by an extraordinary 165%, mostly due to a massive boost in spending on the Social Housing Project by 267% in real terms on the back of a Presidential order to build 400,000 new units during the year (Figure 10).[11] However, as FY 16/17 is coming to a close, the Ministry of Finance has projected that only one third of the massive budget will be spent,[12] meaning that the actual increase in spending will only be 18%, a far cry from the planned spending (For more on underspending, see BE Budget 16/17 PIII, forthcoming).
Spending on the profitable Dar Masr project was down 43%, however, another profitable housing project, the New Administrative City Housing was introduced, levelling a considerable amount of the drop in spending on for-profit housing. The much smaller housing projects, Rural Housing, and Co-operative Housing, saw real spending drop by 47% and 58% respectively.
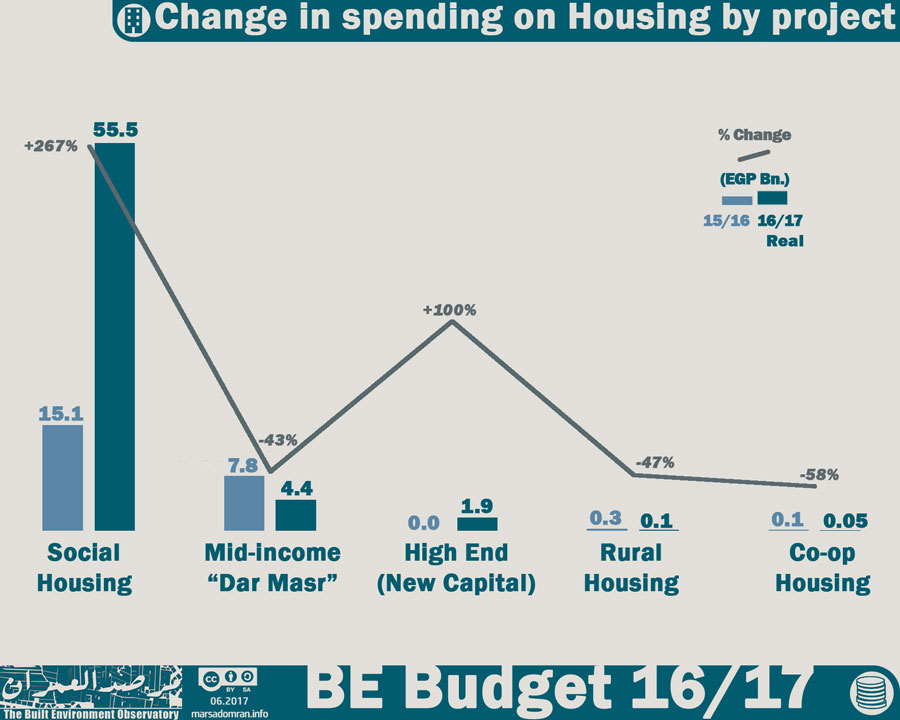
Figure 10: Change in spending on Housing by project on FY 15/16
5.5 Sanitation
Three agencies, all affiliated to the Ministry of Housing, were responsible for spending EGP 10.2 Bn, on sanitation stations and networks (Table 8).
Table 8: Spending on Sanitation by Agency and Geo-Administrative Domain (EGP)
| Ministry | Ministry of Housing | TOTAL | |||
| Agency | Construction Authority for Potable Water and Wastewater (CAPWW) | National Organisation for Potable Water and Sanitary Drainage (NOPWSD) | New Urban Communities Authority (NUCA)* | ||
| Projects | Sanitation Stations and Networks | ||||
| Existing BE | 1,840,300,000 | 4,881,500,000 | 0 | 6,721,800,000 | 66% |
| New Cities | 0 | 0 | 3,509,619,000 | 3,509,619,000 | 34% |
| Total | 1,840,300,000 | 4,881,500,000 | 3,509,619,000 | 10,231,419,000 | 100% |
| 18.0% | 47.7% | 34.3% | 100.0% | ||
Overall, spending on sanitation was down 12% on last year in real terms where it was EGP 8.7 Bn versus EGP 9.9 Bn in FY 15/16 (Table 9). However, spending on the Existing BE was up 20% in real terms, and down by 41% in New Cities.
Table 9: Change in spending on Sanitation in real terms on FY 15/16
| TOTAL | New Cities | Existing BE | |
| 9,860,219,000 | 5,107,087,000 | 4,753,132,000 | 15/16 |
| 8,717,168,988 | 2,990,195,388 | 5,726,973,600 | 16/17 Real |
| 10,231,419,000 | 3,509,619,000 | 6,721,800,000 | 16/17 Nominal |
| -12% | -41% | 20% | % Change |
Despite the gains in spending on the Existing BE, only two thirds of the sanitation budget were spent on 98% of the population, while 34% still went to New Cities where only 2% of the population lives (Figure 11). This means that total per capita spending in New Cities (EGP 1790 per person) was 25 times more than on the Existing BE.
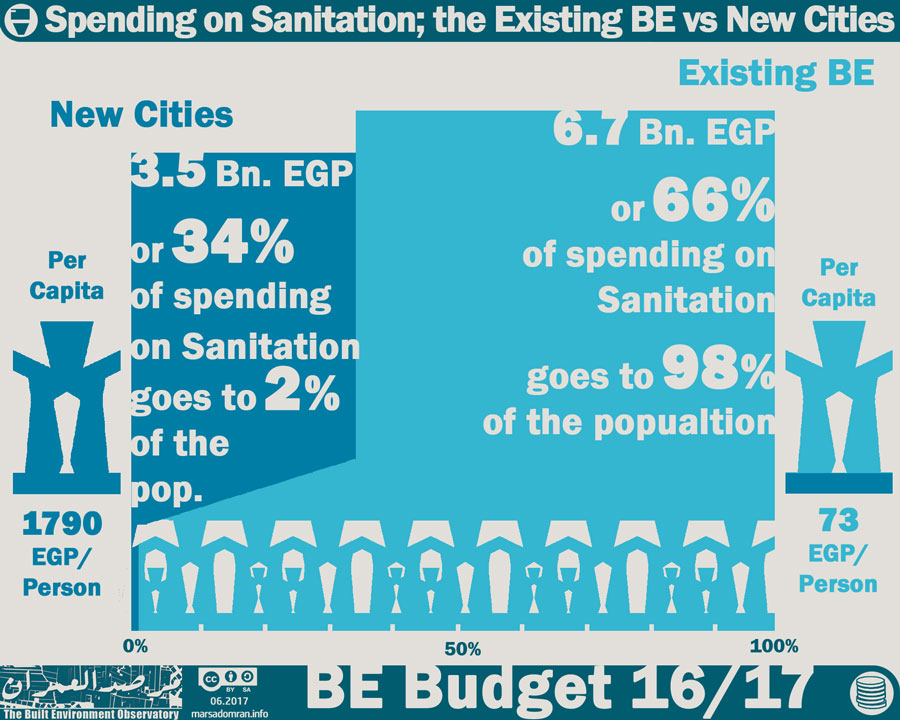
Figure 11: Spending on Sanitation; the Existing BE vs New Cities
Out of the 20 governorates that have New Cities, three governorates saw more spending on New Cities than on the cities and villages of the Existing BE, while another three governorates had spending close to equal (Figure 12). In Cairo, spending on sanitation on the New Cities home to roughly 30% of the governorate’s population, was a phenomenal six times more than spending on the old city districts where 70% of the population live[13] (For more, see Methodology: Administrative Divisions; Existing Built Environment and New Cities). In Matrouh, New Alamein, a New City that is mostly a large coastal resort still under construction, received 2.8 times more spending than Matruh’s eight existing cities, and 97 villages where all its population live.
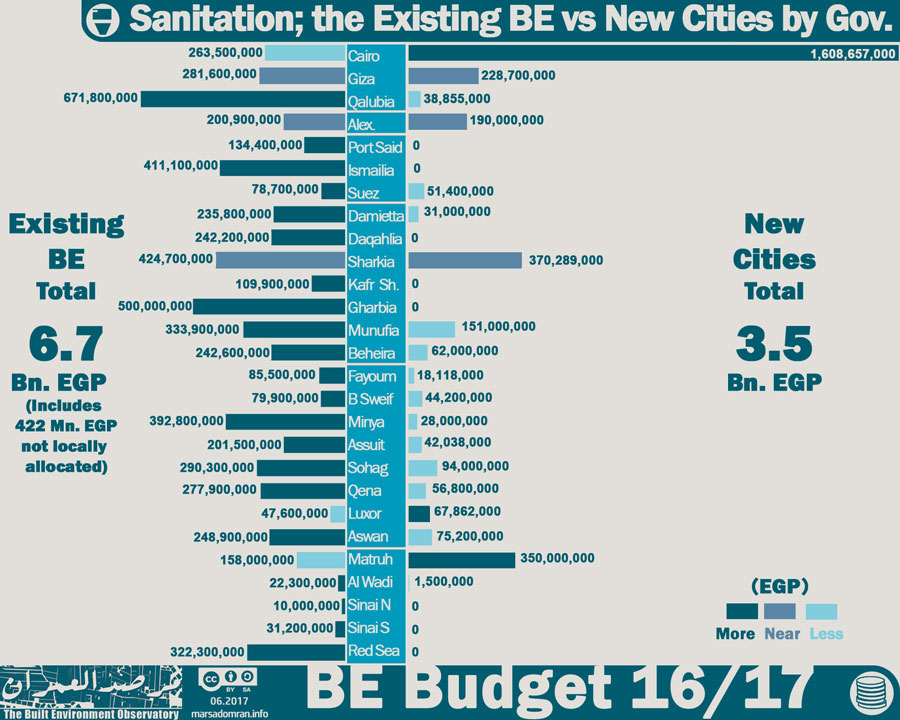
Figure 12: Spending on Sanitation; the Existing BE vs New Cities by Governorate
5.6 Water
The same three agencies responsible for sanitation, spent EGP 7 Bn on drinking water stations and networks (Table 10).
Table 10: Spending on Water by Agency and Geo-Administrative Domain (EGP)
| Ministry | Ministry of Housing | TOTAL | |||
| Agency | Construction Authority for Potable Water and Wastewater (CAPWW) | National Organisation for Potable Water and Sanitary Drainage (NOPWSD) | New Urban Communities Authority (NUCA)* | ||
| Projects | Drinking Water Stations and Networks | ||||
| Existing BE | 3,642,100,000 | 860,500,000 | 0 | 4,502,600,000 | 64% |
| New Cities | 0 | 0 | 2,494,790,000 | 2,494,790,000 | 36% |
| Total | 3,642,100,000 | 860,500,000 | 2,494,790,000 | 6,997,390,000 | 100% |
| 52.0% | 12.3% | 35.7% | 100.0% | ||
Spending on water saw an increase of 13% in real terms on last year, where it was up by a considerable 44% in the Existing BE, while it dropped by 18% in New Cities (Table 11).
Table 11: Change in spending on Water in real terms on FY 15/16
| TOTAL | New Cities | Existing BE | |
| 5,262,804,000 | 2,591,087,000 | 2,671,717,000 | 15/16 |
| 5,961,776,280 | 2,125,561,080 | 3,836,215,200 | 16/17 Real |
| 6,997,390,000 | 2,494,790,000 | 4,502,600,000 | 16/17 Nominal |
| 13% | -18% | 44% | % Change |
As with sanitation, the big gains made in spending on the Existing BE still mean that 64% of the water budget is spent on 98% of the population, leading to a massive per capita discrepancy with people in New Cities of 26 times (Figure 13).
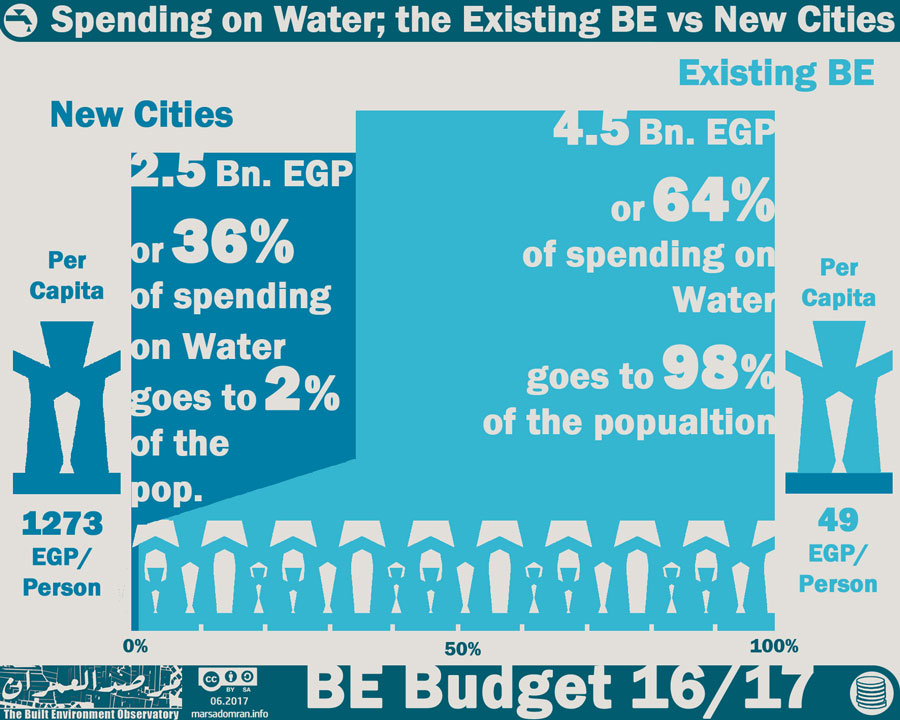
Figure 13: Spending on Water; the Existing BE vs New Cities
The sub-national dis-aggregation of spending shows the spatial injustice in more detail, where spending on New Cities was higher or close to equal in seven of the 20 governorates that have a New City programme (Figure 14). Most glaring is the Sharkia governorate where one New City, the 10th of Ramadan, receives 2.8 times more spending than the 15 cities and almost 500 villages that make up the Existing BE there (For more see Methodology, Administrative Divisions; Existing Built Environment and New Cities).
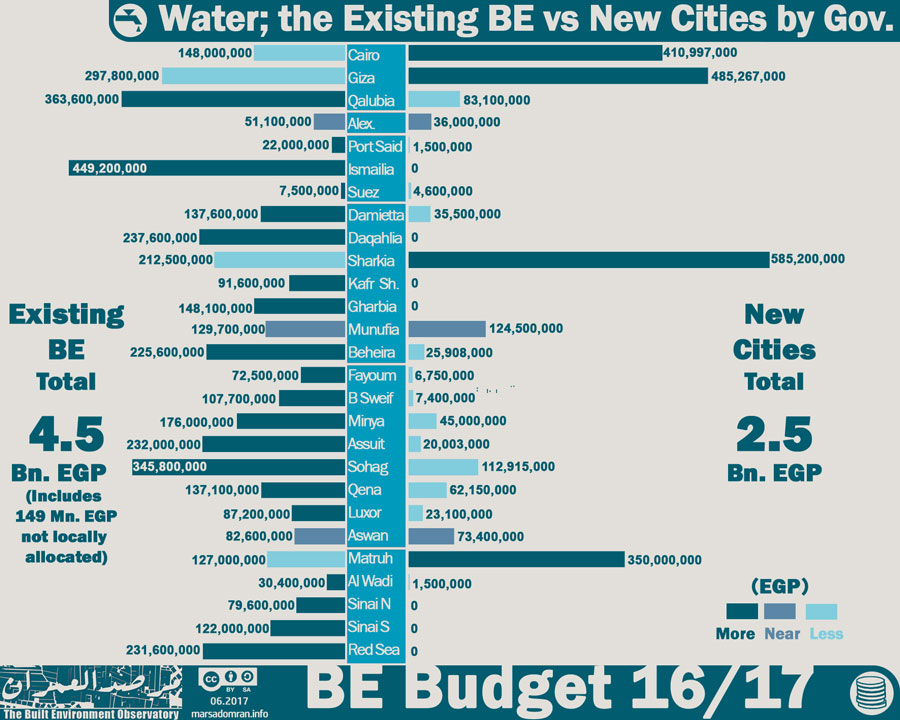
Figure 14: Spending on Water; the Existing BE vs New Cities by Governorate
5.7 Urban Development
A total of EGP 4.3 Bn was planned to be spent on five urban development projects by five different agencies affiliated to two ministries and 27 governorates (Table 12). Almost half of this spending was on the infrastructure of one project; the New Administrative Capital in Cairo.
Table 12: Spending on Urban Development by Agency and Geo-Administrative Domain (EGP)
| Ministry | Ministry of Housing | Min. of Local Development | Governorates | TOTAL | |||
| Agency | Informal Settlements Development Facility (ISDF) | Central Agency for Construction (CAC) | New Urban Communities Authority (NUCA)* | Office of the ministry | Offices of the 27 Governorates | ||
| Projects | Upgrading Unsafe Areas | Comprehensive Development | New Admin. Capital Infrastructure | National Project to Upgrade Villages | Most Needy Villages | ||
| Existing BE | 1,500,000,000 | 112,000,000 | 0 | 500,000,000 | 95,000,000 | 2,207,000,000 | 52% |
| New Cities | 0 | 0 | 2,070,000,000 | 0 | 0 | 2,070,000,000 | 48% |
| Total | 1,500,000,000 | 112,000,000 | 2,070,000,000 | 500,000,000 | 95,000,000 | 4,277,000,000 | 100% |
| 35.1% | 2.6% | 48.4% | 11.7% | 2.2% | 100.0% | ||
| * Includes investments in the New Administrative Capital and the Social Housing Project | |||||||
Analysing spending on related projects that foucs only on the Exitsing BE, the National Programme to Upgrade Unsafe Areas, mostly a slum clearance and rehousing project, accounted for 68% of planned spending (Figure 15). The National Project to Upgrade Villages, had the second highest spending (23%), while so-called comprehensive development projects, in Giza (North Giza/Imbaba Airport), the Red Sea and Sinai were allocated 5% of spending, leaving 4% for the Neediest Villages Project. It is important to note though, that the National Project to Upgrade Villages might only be a renaming of the Neediest Villages Project, however there is no further information available on the Ministry of Local Development’s website.
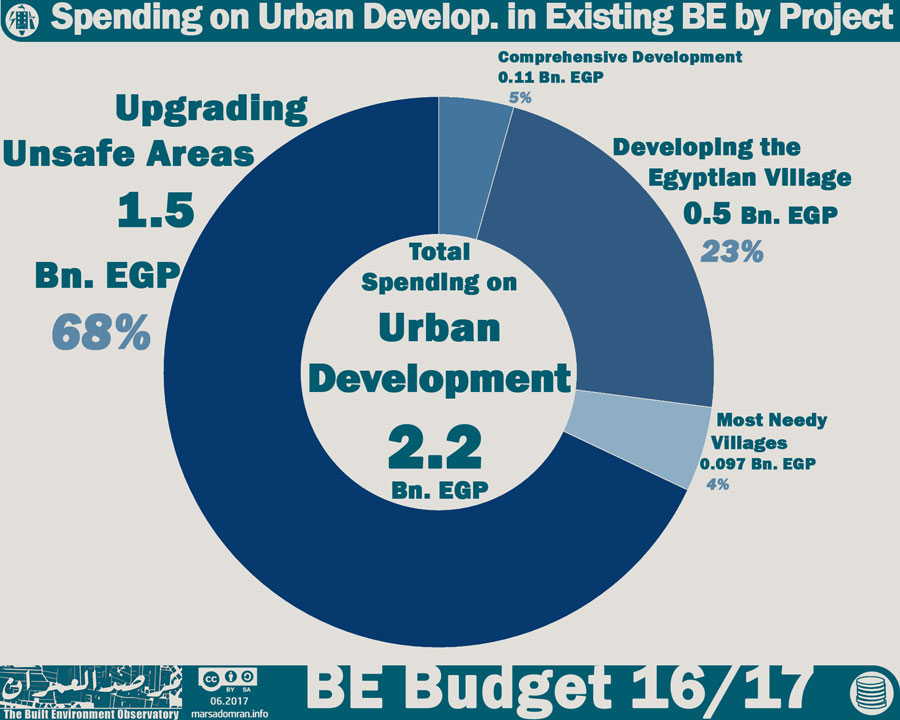
Figure 15: Spending on Urban Development in the Existing BE by Project
Spending on urban development projects in the Existing BE was up by 18% in real terms, where the National Programme to Upgrade Unsafe Areas saw the largest boost in planned spending by 86% (Figure 16). Comprehensive development projects fell by 41%, whereas the Neediest Villages project fell by 89%. However, even if both that and the National Project to Develop Villages are the same project, overall spending on both would be still down by 32%.
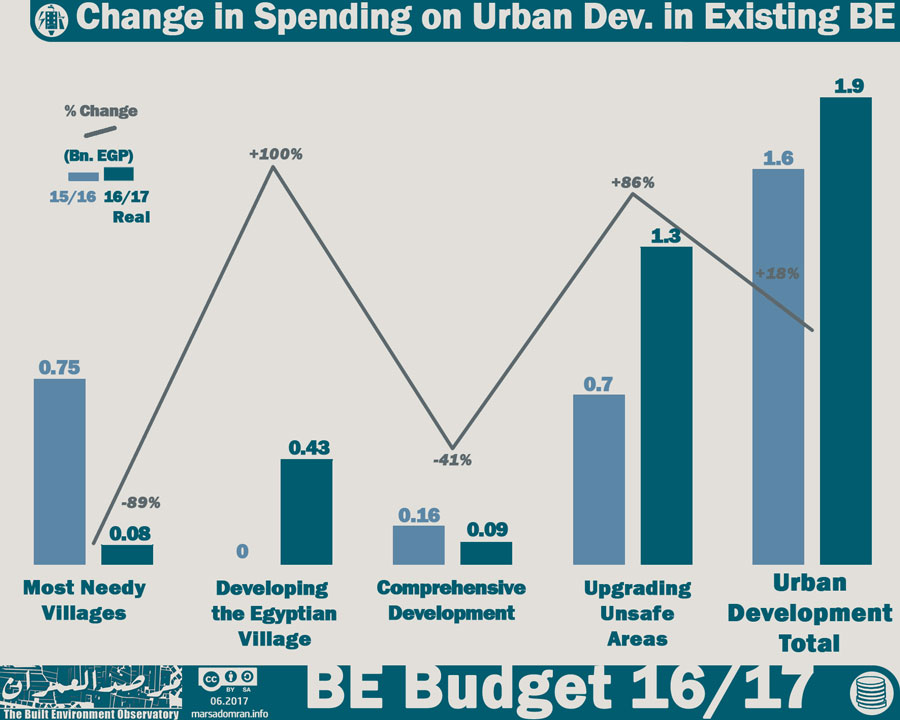
Figure 16: Change in Spending on Urban Development in Existing BE
5.8 Electricity
Over four agencies in two ministries, as well as the Offices of 27 governorates planned to spend EGP 67.3 Bn on electricity projects in FY 2016/2017 (Table 13). Spending was divided among the three geo-administrative domains, with 93% being spent on Regional power stations and networks that are part of the national grid, with the rest being spent on local networks in New Cities (5.7%) and the cities and villages of the Existing BE (1.5%) (Figure 17).
Table 13: Spending on Electricity by Agency and Geo-Administrative Domain (EGP)
| Ministry | Governorates | Ministry of Housing | Ministry of Electricity | TOTAL | |||
| Agency | Offices of the 27 Governorates | Central Agency for Construction (CAC) | New Urban Communities Authority (NUCA)* | Electricity SOEs* | Egypt Electricity Holding Company (EEHC) | ||
| Projects | Local electricity networks | Local electricity networks | Local electricity networks | Power stations and regional networks | Power stations and regional networks | ||
| Existing BE | 985,700,000 | 74,000,000 | 0 | 0 | 0 | 1,059,700,000 | 2% |
| New Cities | 0 | 0 | 3,858,244,000 | 0 | 0 | 3,858,244,000 | 6% |
| Regional Projects | 0 | 0 | 0 | 6,859,500,000 | 55,505,000,000 | 62,364,500,000 | 93% |
| Total | 985,700,000 | 74,000,000 | 3,858,244,000 | 6,859,500,000 | 55,505,000,000 | 67,282,444,000 | 100% |
| 1.5% | 0.1% | 5.7% | 10.2% | 82.5% | 100.0% | ||
| * No detailed breakdown by agency was provided | |||||||
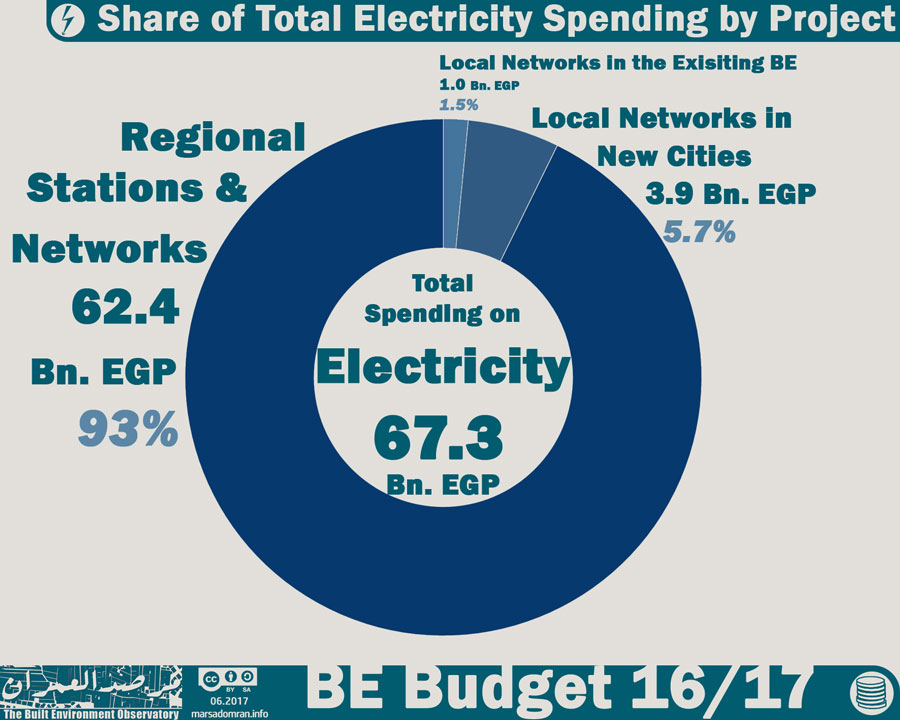
Figure 17: Spending on Electricity by Project
In real terms, total planned spending on electricity was up a massive 102% on the previous FY, with increases across all three projects (Figure 18). Most of the increase was in Regional Projects (110%), where the Egypt Electricity Holding Company (EEHC) has started implementing three large power stations worth EGP 68 Bn (EUR 8 Bn in 2015) to boost supply by 50% over three years.[14] One of the power stations is due to serve the New Administrative Capital in Cairo, still under construction.
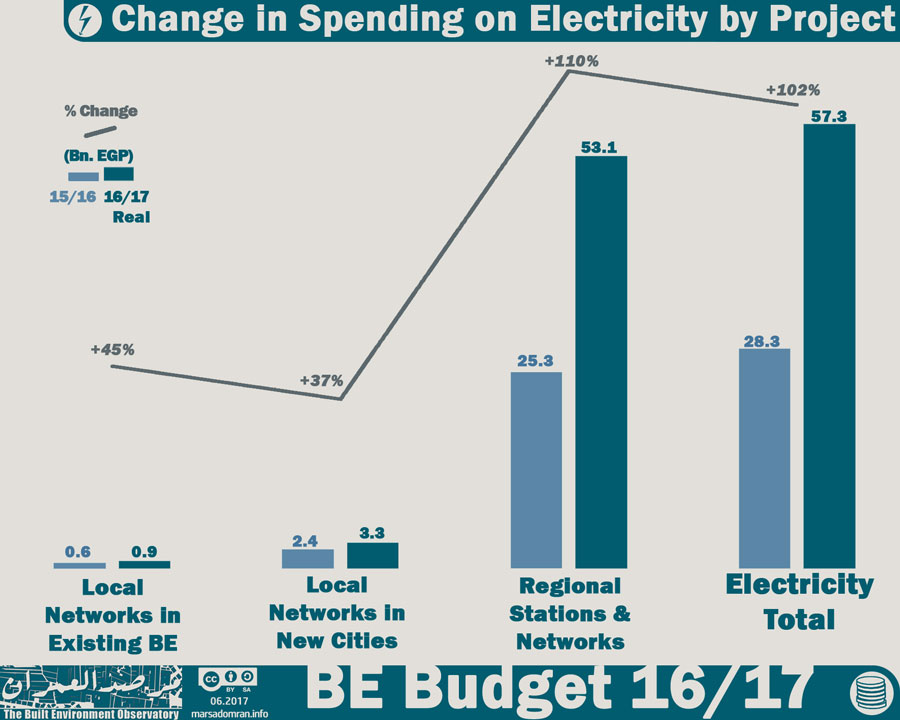
Figure 18: Change in spending on Electricity by Geo-Administrative Domain on FY 15/16
On the local level, there remained a huge disparity between New Cities and the Existing BE, where the former received 79% of the budget for only 2% of the population (Figure 19). In per capita terms, spending on local electricity networks in New Cities was almost 200 times higher than in the cities and villages of the Existing BE.
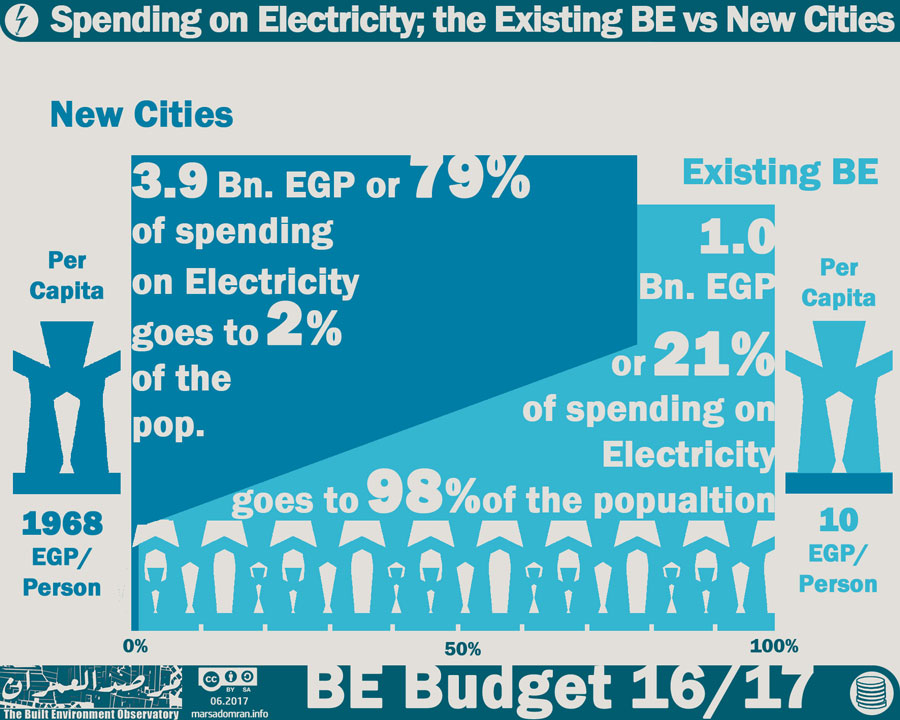
Figure 19: Spending on Electricity; New Cities vs the Existing BE
On the governorate level, spending on local electricity networks was higher in 14 of the 20 governorates that had New Cities (Figure 20). Sharkia, Matruh and Damietta had New City to Existing BE ratios of 58.3, 17.4, 16.4 respectively, making them the least equitable governorates in this comparison.
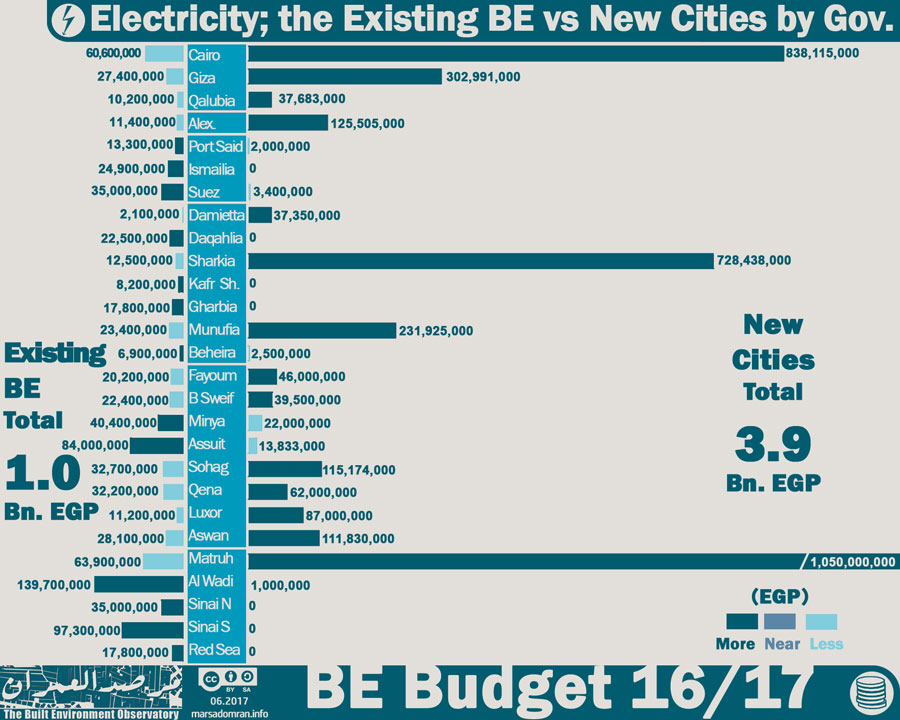
Figure 20:Spending on Electricity; New Cities vs the Existing BE by Governorate
5.9 Transport
Eight agencies affiliated to two ministries and two governorates, along with the Offices of 27 governorates planned to spend EGP 26 Bn on transport in FY 2016/2017 (Table 14). 46% of this spending was for Regional Projects such as highways and railroads, while 37% of spending was for local transport in the Existing BE (roads and public transport), and the remaining 17% was for local roads in New Cities (Figure 21).
Table 14:Spending on Transport by Agency and Geo-Administrative Domain (EGP)
| Ministry | Ministry of Transport | Ministry of Housing | Governorates | TOTAL | ||||||
| Agency | General Authority for Roads, Bridges and Land Transport (GARBaLT) | National Authority for Tunnels (NAT) | Egyptian National Railways (ENR) | Central Agency for Construction (CAC) | New Urban Communities Authority (NUCA)* | Offices of the 27 Governorates | Cairo Transport Authority (CTA) | Alexandria Public Transport Authority (APTA) | ||
| Projects | County & Regional Highways | Public Transport (Metro) | Regional rail | County & Regional Highways | Local roads | Local roads | Public Transport (Buses & tram) | Public Transport (Buses & tram) | ||
| Existing BE | 1,091,000,000 | 5,082,258,000 | 0 | 798,300,000 | 0 | 2,238,500,000 | 250,000,000 | 200,000,000 | 9,660,058,000 | 37% |
| New Cities | 0 | 0 | 0 | 0 | 4,395,329,000 | 0 | 0 | 0 | 4,395,329,000 | 17% |
| Regional Projects | 5,891,000,000 | 0 | 5,197,000,000 | 899,500,000 | 0 | 0 | 0 | 0 | 11,987,500,000 | 46% |
| Total | 6,982,000,000 | 5,082,258,000 | 5,197,000,000 | 1,697,800,000 | 4,395,329,000 | 2,238,500,000 | 250,000,000 | 200,000,000 | 26,042,887,000 | 100% |
| 26.8% | 19.5% | 20.0% | 6.5% | 16.9% | 8.6% | 1.0% | 0.8% | 100.0% | ||
![]()
Figure 21: Spending on Transport by Geo-Admin. Domain and Project
In order to properly analyse spending on transport, trends in spending have been divided between the two major sub-sectors; roads and public transport. FY 2016/2017 saw a drop in total planned spending on roads of 9% over FY 2015/2016, mostly due to a considerable drop in spending on regional highways of 32% (Figure 22). However, the head of the Central Agency for Construction that is responsible for a number of regional highways, announced recently that planned spending of the agency tripled through FY 2016/2017, signifying that the drop in planned spending may have been levelled.[15]
On the other hand, planned spending was up in the three other projects, with local roads in New Cities receiving the highest boost (38%).
![]()
Figure 22: Change in Spending on Roads by Project on FY 15/16
Public transport also saw a drop in planned spending on FY 15/16, though by almost a fifth (Figure 23). This was mostly due to cuts in the Egypt National Rail budget of 35% in real terms. The Alexandria Public Transport Authority also saw cuts in its budget by 8%, however the Cairo Transport Authority and the Greater Cairo Metro saw increases of 20% and 7% respectively.
![]()
Figure 23: Change in Spending on Public Transport by Project/Agency on FY 15/16
6 Methodology
As with the BE Budget 2015/16, the BE Budget 2016/17 has compiled data and information from several sources to provide its analysis. The report has used publicly available official information only, giving a near accurate estimate of how much money the government allocates to the various built environment related sectors: building housing units; developing residential areas; providing roads and transportation for commuting in neighbourhoods and cities; building water and waste-water stations and networks; as well as providing electricity through power stations and grids.
Therefore, data compiled is consolidated to reflect information through six main sectors: 1) Housing Projects, 2) Urban Development, 3) Water, 4) Waste-water, 5) Transportation and 6) Electricity, with more detail within the sectors in the case of multiple projects. Furthermore, the BE Budget categorises public built environment spending according to both local spending on the sub-national governorate level to analyse spatial equality of public spending, as well as National spending for projects that cross sub-national borders such as National highways, rail-roads and electricity generation and networks. Another administrative distinction is made at the sub-national level particular to Egypt, which has dual local administrative structures. The first is the Existing Built Environment, composed of the mainstream municipalities that manage over 200 cities and 4000 villages and where over 98 percent of Egyptians live. The second are the so-called New Cities, composed of around 31 new urban settlements built in desert locations over the last four decades where 20 active, one is a mega tourist resort, and nine are under construction. Most New Cities have been built as satellites to large existing cities, and all constructed and run by a public corporation, the New Urban Communities Authority (NUCA), chaired by the Minister of Housing, Utilities and Urban Development.
6.1 The built environment Sectors
Six sectors were chosen to represent built environment spending based on a number of criteria (Table 15). The sectors had to make up the physical built environment, have a general public benefit, use public funds, and have budget data available at the national or sub-national levels.
Table 15: Built environment sectors by administration and projects
| Sector | Projects | ||
| National | Sub-national | ||
| Existing Built Environment | New Cities | ||
| Roads and Transportation | National Roads and Bridges | Local Roads and Bridges | Local Roads and Bridges |
| Railways | N/A | N/A | |
| N/A | Underground Metro | ||
| Public Buses | |||
| Electricity | Power Stations and Grids | Local Networks | Local Networks |
| Water | N/A | Treatment Stations & Networks | Treatment Stations & Networks |
| Waste-water | N/A | Treatment Stations & Networks | Treatment Stations & Networks |
| Housing | N/A | Social Housing Programme | Social Housing Programme |
| N/A | Middle Income Housing/ Dar Masr | ||
| Cooperative Housing Programme | N/A | ||
| Rural Housing (Desert Villages/Bedouin Housing/ Housing Repair) | N/A | ||
| Urban Development | N/A | Most Needy Villages Project | New Administrative Capital |
| Urban Renewal | |||
| Integrated Urban Development | |||
All projects included in this analysis are intended to provide public benefit. There are exceptions to this rule, which include projects directed at the middle class, such as the Cooperative Housing Program, the Median Housing Program and the luxury housing in the new capital, two profit-generating projects for the New Urban Communities Authority. The two projects also engage in sale of plots of land for profit. These projects were included to highlight the volume of public funds used in non-social projects versus those used in social projects.
General Public Benefit
All projects identified in this analysis must be accessible to the public or provide general public benefit. Some exceptions to this are the Cooperative Housing Programme and the Middle Income Housing Programme (Dar Masr), which sell housing to middle and upper middle income groups and are considered profitable. These have been included to highlight how public finance is used, especially public land. The latter project represents a large proportion of spending by a government agency, NUCA, that is supposed to focus on public projects.
Public Funds
Most of the built environment sectors in Egypt depend on public spending through state affiliated agencies. These are classified into; Government (Ministries and their offices/departments, Service Authorities directly affiliated to ministries and Local Administration offices/departments), and State-Owned-Enterprises (Economic agencies, public sector companies). SOEs are defined as publicly owned corporations through which the government undertakes commercial activities for social and economic projects.
State-Owned-Enterprises’ investments are included in this research as they play a major role in the Built Environment projects in Egypt. Other than having funding from private sources and collecting payments from companies, there is also a relationship between SOE’s and the National Treasury, where funds come in to SOE’s through the National Treasury. Revenues from SOE’s flow to the National Treasury and to quasi-fiscal expenditures as well. SOE’s budgets are independent of the General State Budget but their investments directly serve the Egyptian Economic and Social Development Program.[16]
On the other hand, there are a number of SOEs that use public money for mostly profitable construction and real estate activity, and these have not been included. One example is the Holding Company for Construction and Development and its real estate development subsidiaries, the Maadi, Heliopolis and el-Nasr companies.[17]
And while the private sector through their corporate social responsibility activities, charities, NGOs and donor agencies invest to some degree in the built environment, any of their expenditure that is exclusive to the State Budget and its agencies or that was not part of the agencies covered, is not included in the BE Budget.
Available Data
There are a number of agencies that fit the built environment criteria but that we could not find publicly available data for, and these were also not included. These include;
The Holding Company for Water and Waste Water. Most public holding companies’ budgets are not published regularly or at all. Only the Egyptian Electricity Holding Company (EEHC) is made available as one bulk figure, published through the Ministry of Planning documents.
So-called private funds, sanadiq khassa, investing in public housing and urban development projects and affiliated to government agencies such as the Tahya Masr Fund (Presidency) and Governorate Services’ Funds, are excluded, as their budgets are not published.
6.2 Urban Divisions and Regions
Spending has been analysed based on; regional and local projects; two local administration structures particular to Egypt (Existing BE and New Cities); and six geographic regions.
Spatial Spending 1; Regional Projects and Local Projects
Regional projects are those that cross sub-national (governorate) borders and that could not be isolated at the local level such as national highways, rail-roads and electricity generation and grids. Their spending is presented as national totals only. Local projects are those that serve communities within the administrative boundaries of governorates such as local roads and highways, water and waste-water infrastructure, housing, urban development and local electricity networks. Their spending is presented as both a national total as well as per governorate. In some cases, some local projects’ spending within one sector is not disaggregated, hence there are differences between the sub-national totals and the grand totals.
Spatial Spending 2; Geographic Regions
There is as yet no regional level administration, even though a provision for such a system has existed since 1977 and outlined seven or eight so-called Economic Regions.[18] In this research, we have identified six socio-geographic regions that better reveal spatial inequality and are different from the Economic Regions. They are:
The largely urban capital metropolis of Greater Cairo (Cairo, Giza and Qalyubia)
Egypt’s second largest city/governorate of Alexandria
The cohesive Suez Canal zone (Port Said, Ismailia and Suez)
The rural/industrial Delta (Damietta, Daqahlia, Kafr al-Sheikh, Beheira, Munfia, Gahrbia and Sharkia)
The mostly rural Upper Egypt (Fayoum, Beni Sweif, Minya, Assuit, Sohag, Qena, Luxor and Aswan)
The sparsely populated desert Frontier (Matruh, Wadi al-Gadid, Red Sea, North Sinai and South Sinai).
Geo-Administrative Divisions; Existing Built Environment and New Cities
There is an administrative distinction at the sub-national level particular to Egypt. Within the 27 sub-national governorates, Egypt has a dual local administrative structure. There are mainstream local administrations, or municipalities, that manage over 200 cities and 4000 villages,[19] where over 98 percent of Egyptians live.[20] This we have termed the Existing Built Environment (Existing BE). And then there are the 30 so-called New Cities that have been built and run by the New Urban Communities Authority (NUCA),[21] a public corporation administered at the national level by the Ministry of Housing, Utilities and Urban Development (MoH). These are referred to simply as New Cities.
6.3 Quantifying Spatial Justice
This research uses three methods to quantify spatial justice, in an effort to monitor either overspending or deprivation by between both regions and governorates.
Per Capita Expenditure
This is a simple relative method that relies on dividing expenditure in a certain scope (geographical or administrative), by the population of that scope. This is a highly relative method where it uses average or median figures within one scope as a baseline. It is better suited to comparisons between two scopes, for example between different sectors within the same geographical domains, or between different geographical domains within the same sector. Time trends are also comparable, but by only using real prices adjusted to inflation. Per capita expenditure has only been used relative to total population, excluding weights based on needs or exceptional circumstances.
Spending-to-population Ratio (SPR)
The SPR is a ratio between two percentage shares, and thus is less relative than the Per Capita method. It has a baseline of parity (1.0), which means a matching of the share of each region/governorate from the total budget and their share of the total population. If the ratio drops below 1.0, then there is underspending, which may either imply an already developed region/governorate if ratios were higher in previous years, or deprivation, if ratios have been persistently low. If the ratio is over 1.0, then either regions/governorates are being targeted to improve conditions or have exceptional circumstances (the national capital, extremely low population densities, disaster relief), or if not, then overspending may well be unjustified. In either case overspending must be based on plans with clearly defined timelines and sector targeting and should not generally exceed a ratio of 2.0 to ensure equitable development.
Spending-to-deprived-population Ratio (SPDR)
The SPDR is a ratio between two percentage shares, and thus is less relative than the Per Capita method. The SPDR has a baseline of parity (1.0), which means a matching of the share of each region/governorate from the total budget and their share of the total deprived population. It uses shares of deprived population according the Built Environment Deprivation Index (BEDI),[22] where spending on housing is compared to the affordability index, upgrading unsafe areas (urban development) is compared to the durability index, sanitation with the sanitation index, and water with the water index. If the ratio drops below 1.0, then there is underspending, which directly implies continued deprivation, especially if ratios have been persistently low, as spending is much lower than is needed relative to other regions/governorates. If the ratio is over 1.0, then the regions/governorates are being targeted to improve conditions quickly or have exceptional circumstances such as extremely low population densities requiring more spending on certain sectors such as transport, or disaster relief. If not, overspending may well be unjustified, as it must be based on plans with clearly defined timelines and sector targeting and should not generally exceed a ratio of 2.0 to ensure equitable development.
6.4 Expenditure Data, Sources, Government Agencies’ Information
The BE Budget has focussed only on public investments allocated to built environment projects outlined in the sectors presented in Chapter 6 of the General State Budget and other documents. This means that the rest of the expenditure budget line items are omitted.[23]
Given that the General State Budget is not published in a programs budget format, only planned allocations of Chapter 6, Investments, are relevant to this study. This allocation is concerned with investments directed to construction or developing infrastructure across sectors.
These figures provide a picture of how the government plans to spend public money on economic and social development programs, and do not reveal actual spending or information on accessibility of services.
The project collected this information from four main sources of data, all of which are published on the Internet, with the exception of the Official Gazette documents, as shown below:
- Ministry of Finance
1.1. General State Budget for FY 2016/2017 for the administrative agencies (ministries), local administration and service agencies (10 parts) http://www.mof.gov.eg/Arabic/%D8%B9%D9%86%D8%A7%D9%88%D9%8A%D9%86%20%D8%B1%D8%A6%D9%8A%D8%B3%D9%8A%D9%87/PE/Pages/budget16-17.aspx
1.2. Budget of Economic Agencies (SOES) for FY 2016/2017 (published after March 2017) http://www.mof.gov.eg/Arabic/%D8%B9%D9%86%D8%A7%D9%88%D9%8A%D9%86%20%D8%B1%D8%A6%D9%8A%D8%B3%D9%8A%D9%87/Pages/Economic_bodies_budgets.aspx
- Official Gazette
2.1. Budget Laws for economic agencies (SOEs) for FY 2016/2017, laws 20 to 49 for the year 2016, July 2016
- Ministry of Planning, Monitoring and Administrative Reform
3.1. Khittat al-Tanmiyya al-Mustadama lil-‘Am al-Mali 2016/2017, Sustainable Development Plan (formerly the socio-economic plan) for FY 2016/2017, (9 documents, an original edition was published and then replaced with a modified version several some weeks later after the launch of a new website)
3.2. Dalil al-Muwatin lil-Khitta al-Istithmariyya lil ‘am al mali 2016/2017, Citizen’s Guide to the Investment Plan FY 2016/2017 (The documents of the 27 governorates were posted on the Ministry’s Facebook page with a link to a Google drive between 26 November 2016 and 23 December 2016) https://www.facebook.com/pg/planning.egy/posts/?ref=page_internal
https://drive.google.com/drive/folders/0BybHPIRTQ4bKQm1YZG43ZWJqRlk
3.3. Dalil al-Muwatin lil-Khitta al-Istithmariyya lil ‘am al mali 2016/2017, Citizen’s Guide to the Investment Plan FY 2016/2017 ( Only 16 documents for 16 governorates were published on the Ministry’s website sometime after publication on the ministry’s Facebook page) http://mpmar.gov.eg/internal/index/investment-plan
- New Urban Communities Authority
4.1. Khittat al-‘am al-mali 2016/2017, Financial Year Plan 2016/2017 A (Original plan accessed on 28.04.2016) http://newcities.gov.eg/about/maps/images/%D8%AE%D8%B7%D9%87%20%D8%A7%D9%84%D9%87%D9%8A%D8%A6%D9%87%20%D8%A8%D8%A7%D9%84%D8%AA%D8%B7%D9%88%D9%8A%D8%B1%202016-2017%20%20-.pdf
4.2. Khittat al-‘am al-mali 2016/2017, Financial Year Plan 2016/2017 B (updated plan accessed 08.12.2016)
http://www.newcities.gov.eg/about/maps/default.aspx
4.3 Al-Mawqif al-Tanfidthi li Mashrua’ al-‘Asemma al-Idareyya al-Gadida, Progress Report of the New Administrative Capital Project (Slide presentation, accessed 22.02.2017) http://web.archive.org/web/20170222113630/http://newcities.gov.eg/know_cities/NewCapital/default.aspx
Acknowledgements
Main photograph: East Bani Salman village and New Benisweif New City, Benisweif, Courtesy of Google Earth
This work is licensed under a Creative Commons Attribution 4.0 license
Please reference the work as: Shawkat, Y. The Built Environment Budget 2016/2017, Part II: Spatial Justice by Sector. The Built Environment Observatory, June 2017.
Notes
[1] Measuring spatial equity was only possible in spending on one of the three geo-admirative domains; the Existing BE (For more, see; Methodology: Geo-admirative domains).
[2] MoF. Al-Bayan al-Mali ‘an Mashrua’ al-Muwazana al-‘Ama lil-Dawla lil-Sana al-Maliya 2017/2018 (The Financial Statement of the Fiscal Year 2017/2018). 2017. http://www.mof.gov.eg/Arabic/%D8%B9%D9%86%D8%A7%D9%88%D9%8A%D9%86%20%D8%B1%D8%A6%D9%8A%D8%B3%D9%8A%D9%87/PE/Pages/budget17-18.aspx
[3] Transport has not been included because of lack of disaggregated data for a main project, that for paving local roads.
[4] Seperating spending between the Existing BE and New Cities presented a challenge due to disparities in the official data (See Endnote 1).
[5] The second largest urban development project; The National Project to Upgrade Villages, did not have spending data disaggregated by governorate.
[6] MoF. Al-Bayan al-Mali ‘an Mashrua’ al-Muwazana al-‘Ama lil-Dawla lil-Sana al-Maliya 2017/2018 (The Financial Statement of the Fiscal Year 2017/2018). 2017. http://www.mof.gov.eg/Arabic/%D8%B9%D9%86%D8%A7%D9%88%D9%8A%D9%86%20%D8%B1%D8%A6%D9%8A%D8%B3%D9%8A%D9%87/PE/Pages/budget17-18.aspx
[7] Transport has not been included because of lack of disaggregated data for a main project, that for paving local roads.
[8] For housing, only spending on the Social Housing Project was used as it was the only national level project, and commanded most of the housing budget. In urban development, only the National Project to Upgrade Unsafe Areas was used, as the second largest project; The National Project to Upgrade Villages, did not have spending data disaggregated by governorate.
[9] Transport has not been included because of a lack of disaggregated data for a main project, that for paving local roads, as well the lack of data on transport needs. Electricity was not included because the disaggregated data only covers a very small portion of the sector.
[10] The Social Housing Fund is responsible for collecting revenue and spending on the Social Housing Project, while NUCA is a large SOE where a share of its profits is supposed to be directed to the SHF as per Social Housing Law 33/2014. To differentiate between spending on the Existing BE and spending on New Cities, we deducted the governorate disaggregated figures of NUCA form those of the SHP. To further confuse matters, a later NUCA budget document merged spending on both the Social Housing and the Dar Masr projects at the governorate level, leading us to deduct the original Dar Masr allocation from the new merged ones to deduce spending on the Social Housing Project in New Cites source (See Methodology, Sources). However, there were some discrepancies in the NUCA budget documents when compared to SHF spending at the governorate level where in one governorate, Giza, NUCA spending on the SHP was EGP 6.3 Bn, which is far greater than the SHF spending for that same governorate of EGP 2.7 Bn. Using the higher figure, we have raised the total spending on the Social Housing Project from the original figure of EGP 61 Bn to EGP 65.1 Bn to accommodate the discrepancy, but remain unsure as to the exact governorate spending for the Social Housing Project in both New Cities and the Existing BE, as well as for the Social Housing and the Dar Masr projects in New Cities.
[11] “Egypt targets new 656,000 affordable housing units in 2 1/2 years: Sisi”, Ahramonline, 24.02.2016 http://english.ahram.org.eg/NewsContent/3/12/188441/Business/Economy/Egypt-targets-new-,-affordable-housing-units-in—.aspx
[12] MoF. Al-Bayan al-Mali ‘an Mashrua’ al-Muwazana al-‘Ama lil-Dawla lil-Sana al-Maliya 2017/2018 (The Financial Statement of the Fiscal Year 2017/2018). 2017. http://www.mof.gov.eg/Arabic/%D8%B9%D9%86%D8%A7%D9%88%D9%8A%D9%86%20%D8%B1%D8%A6%D9%8A%D8%B3%D9%8A%D9%87/PE/Pages/budget17-18.aspx
[13] This also does not include spending on sanitation for the New Administrative Capital, yet another New City within Cairo governorate’s boundaries, where it is merged with spending on electricity and roads. See; 5.7 Urban Development.
[14] Siemens awarded record energy orders that will boost Egypt’s power generation by 50%, Siemens PR, 03.06.2015 https://www.siemens.com/press/en/pressrelease/?press=/en/pressrelease/2015/power-gas/pr2015060243pgen.htm&content[]=PG&content[]=Corp
For more on the project see; Egypt Megaproject, Siemens, n.d. https://www.siemens.com/eg/en/home/company/topic-areas/egypt-megaproject.html
[15] Itnein Milayr Geneih I’timad idafi lil-markazi lil-ta’mir al-‘am al-gari, Al Borsa News, 26.04.2017 http://alborsanews.com/2017/04/26/10145552
[16] For a simple introduction to general definitions of State-Owned-Enterprises:
Natural Resource Governance Institute, State Participation and State Owned Enterprises, http://www.resourcegovernance.org/sites/default/files/nrgi_State-Participation-and-SOEs.pdf
For a more on Quasi-Fiscal Activities and their relationship to public budgets:
IBP, Guide to Transparency in Public Finances: Looking Beyond the Core Budget,
http://www.internationalbudget.org/wp-content/uploads/Looking-Beyond-the-Budget.pdf
For more general information regarding Egyptian State-Owned-Enterprises:
Budgetary and Human Rights Observatory, الهيئات الاقتصادية المصرية: موازنة خارج الموازنة
http://bahroegy.org/userfiles/pdf/arabic/Esdarat/AwrakSyasat/2700.pdf
[17] For more on the HCCD see http://www.hccd-construction.com/Hccd_main.aspx
[18] For a comprehensive list of Egypt’s Economic Regions see: GOPP. Maps of Economic Regions and their Governorates http://gopp.gov.eg/eg-map/
[19] Egypt Information Portal. Dalil al-Taqsim al-Idari lil-Muhafzat 2012. Mulakhas http://www.eip.gov.eg/DataDirectories/AdministrativeDivision.aspx
[20] For total population, figures for January 1st 2017 were used according to CAPMAS. Egypt in Figures 2017. For the population of New Cities, the proportion of residents as per the CAPMAS 2006 census was used as a base-line (1.1%) and then doubled to account for population growth that is higher than the national average.
[21] For an overview of NUCA’s New Cities see http://www.newcities.gov.eg/english/New_Communities/default.aspx
[22]A national map of quantifiable deprivation in Egypt, using indicators on affordability, tenure security, durability of housing, crowding, drinking water and sanitation. 10 Tooba. The Built Environment Deprivation Indicator (BEDI), September 2016 http://10tooba.org/bedi/en/
[23] Budget line items are arranged as follows; Salaries and Compensation (Ch 1), Purchase of Goods and Services (Ch 2), Interest, Subsidy (Ch 3), Grants and Social Benefits (Ch 4), Other Expenditures (Ch 5), Investments (Ch 6), Acquisition of Financial Assets (Ch 7), Repayment of Loans (Ch 8).