- Published on 18 April 2023
It is no secret that the Government of Egypt is a major investor in the real estate sector. Last year we were able to show how the government was the largest landowner in Cairo through companies listed on the Egyptian Stock Exchange (See Who Owns Cairo?), even though these companies were ‘privatized’ three decades ago under the 1991 Structural Adjustment Program. Today, as another round of privatization starts under yet another International Monetary Fund loan condition: structural reforms to reduce the state footprint and facilitate private-sector-led growth,[1] four out of the 32 companies recently announced to be privatised, are engaged in real estate development.[2]
The Taamir [taʿ- mīr, urbanisation, تعمير] series aims to provide an explanation using available official data, by assessing the size of state investments in real estate, understanding the different activities and entities involved, and looking more closely at some of the companies due to be privatised.
How the state invests
By canvassing the real estate sector, we found three major ways the state is invested in real estate. The first was through state-owned enterprises (SOEs) with clear mandates to develop real estate, whether the state owns them outright, or has majority holdings in them, and thus control. The second method was through state-owned banks’ and insurance companies’ investment portfolios, where many own small to major minority stakes in a number of real estate developers.
In addition to these two main methods of investment, a cross-government asset management strategy has driven various non-real estate related government agencies that have significant assets in land or property, to set up real estate development companies of their own to redevelop or market these assets. Most are in the industrial, agricultural and transport sectors, though their functions have been liquidated, or their lands have become so-called ‘prime real estate’ within city limits, where functions could presumably be relocated to less valuable locations. The recently founded Sovereign Wealth Fund of Egypt sits at the apex of these asset managers, and so far, has focused on developing some of the real estate assets that have been brought under its jurisdiction through public private partnerships, such as the Mugama’ Building in Tahrir Square,[3] the old Ministry of Interior premises in Downtown Cairo,[4] and the Bab al-Azab area adjacent to the Cairo Citadel.[5]
State-owned real estate enterprises
In order to better understand the role of real estate SOEs, we studied the publicly available financial information of financial year 2019/2020 of 17 state-owned or controlled (ownership above 50%) companies and agencies that have a clear mandate allowing real estate development and the sale of for-profit housing (Table 1). Some exceptions are included for comparison (For more details, see Methodology below).
The SOEs adhere to a fragmented legal landscape due to the changing nature of economic policies that divides them into public agencies and joint stock companies. Public agencies are then divided into economic agencies – run more like companies, and service agencies – profit is not the main concern (See Methodology below). A much simpler and more relevant method to this study, is grouping the real estate SOEs by activity as we found four real estate sub-types and scales, though not without contradictions and overlaps between the entities.[6]
Table 1: Real estate SOEs for which financial data was available for in FY 2019/2020
| Name | Control | State Owner
ship |
Type | Real Estate Activity |
| Egyptian Company for Real Estate Asset Management & Investment –
ERAMI (Al-Ahly Misr Real Estate Asset Management) |
Banks | 100% | Company | Asset manager |
| Maspero Urban Development | Banks | 100% | Company | Developer |
| Maadi Company for Development and Construction | HCCD | 100% | Company | Master Developer |
| Al-Nasr for Housing and Development | HCCD | 100% | Company | Master Developer |
| Zahraa Maadi Investment and Development – ZMID | HCCD | 77% | Company (Listed) | Master Developer |
| Al-Shams Housing and Urbanization – ELSH | HCCD | 77% | Company (Listed) | Developer |
| Heliopolis for Housing and Development – HELI | HCCD | 72% | Company (Listed) | Master Developer |
| Misr Real Estate Assets – MISRREA | Misr Hold. | 100% | Company | Asset manager |
| New Urban Communities Authority – NUCA | MoH | 100% | Agency (Economic) | City Developer |
| General Organisation of Cooperative Housing – GOCH | MoH | 100% | Agency (Economic) | Housing – Cooperative |
| Social Housing and Mortgage Finance Fund – SHMFF | MoH | 100% | Agency (Service) | Housing – Low and middle-income |
| Saudi Egyptian Developers – SED | MoH | 50% | Company | Developer |
| Misr Development Company | MoH | 100% | Company | Developer |
| Tenth of Ramadan for Construction, Marketing and Real Estate Investment | MoH | 100% | Company | Developer |
| City Edge Developments | MoH | 84% | Company | Developer |
| Hyde Park Developments | MoH | 78% | Company | Developer |
| Housing and Development Bank (Housing activity) – HDBK | MoH | 59% | Company (Listed) | Developer |
City developers
At the top of the real estate food chain are what we can call ‘city developers’, agencies that primarily subdivide, regulate and manage mega land parcels into towns or cities, where complete infrastructure (drinking and wastewater-plants, public transportation), and roads are built, and where parcels are then sold on to master-developers, developers or individuals to build. Since the New City programme started in the 1970s, the MoH affiliated New Urban Communities Authority (NUCA) has had almost exclusive rights to develop public land into new satellite towns and districts, where by 2022 it has 44 new cities agencies (subsidiaries) that have developed, or are in the process of developing 2.3 million acres of mostly desert land. It is thus in a class of its own. In addition to its city developer role, NUCA acts as a real estate developer where it has recently built and sold over 77,000 for profit housing units such as the Sakan Masr, Dar Masr, luxury housing projects such as Janna, Capital Residence and others, itself,[7] accounting for 28% of its income.[8] NUCA also controls a number of real estate developers such as City Edge and Hyde Park Developments (Table 1), and is a 49% shareholder in Administrative Capital for Urban Development,[9] which is the city developer of the New Administrative Capital.
Master developers
The second tier of developers are companies and agencies that primarily subdivide large land parcels into districts, where utilities and roads are built with the aim of selling the subdivided parcels on to developers to develop. Cairo relied on such companies to expand the city, developing Maadi, Heliopolis and Moqattam, among other places, on public land allocated to them for free, or for a nominal price. Four out of the 17 entities covered are master developer SOEs: Heliopolis for Housing and Development ( Factsheet) and Zahra al-Maadi for Investment and Development – ZMID are already listed on the Egyptian Exchange (EGX), though under government control. The other two under full state ownership, but slated for a private offering, are Maadi Company for Development and Construction, and Al-Nasr for Housing and Development. A significantly large state-owned master developer with a landbank of 11,000 acres in New Cairo, El Mostakbal for Urban Development/MIDAR, and which was valued at LE 75bn in 2018,[10] had no financial data published about it, and is thus not in the study.[11]
Real estate developers
Companies and agencies that primarily develop residential and residential-mixed-use real estate on land bought from or allocated to them by city or master developers. Here, nine entities in the study are real estate developer SOEs that have activities ranging from building standalone buildings, to gated compounds, to managing large portfolios of already built assets. Here, only one company may be privatised, Misr for Real Estate Assets, through its parent SOE Misr Holding after its recent transfer to the Sovereign Wealth Fund of Egypt.[12] Most of these are strong independent companies even though owned by holding companies or agencies, while they wholly or partially own a large number of smaller subsidiary developers, some even set up to build a single building. The subsidiaries have thus not been included as they are generally represented in the main holders’ financial statements.
Social and cooperative housing
Public agencies that are mandated to build and sell housing at state-regulated prices, or, to certain groups that meet a set of pre-defined criteria, usually in the form of housing estates. Historically, these entities were able to benefit from subsidised building materials and public land, however, recently they only benefit from public land which is allocated for free (Social Housing), or at below market values (cooperative housing). Here the Social Housing and Mortgage Finance Fund (SHMFF) and the General Organisation for Cooperative Housing (GOCH) are included because their housing is sold rather than rented to beneficiaries, and controls over use (resale) are lifted over the course of a few years, bringing these units to market at market values.
Financial size
There are a number of methods to assess the size of companies, such as capital and assets, especially landbanks as we did in Who Owns Cairo. Here, however we needed to use a quantitative metric that can be harmonized across the differing accounting standards between companies, economic agencies and service agencies. The metric also needed to be compared to the real estate sector at large namely by GDP, and thus to the private sector. Therefore, annual income (revenue from sales, investment returns, and all other operating income, see Methodology) was chosen for the latest financial year where closing accounts were available for the largest number of SOEs, that of financial year 2019 or 2019/2020, depending on their accounting methods. This is of course gross income, and not profits.
SOE Income
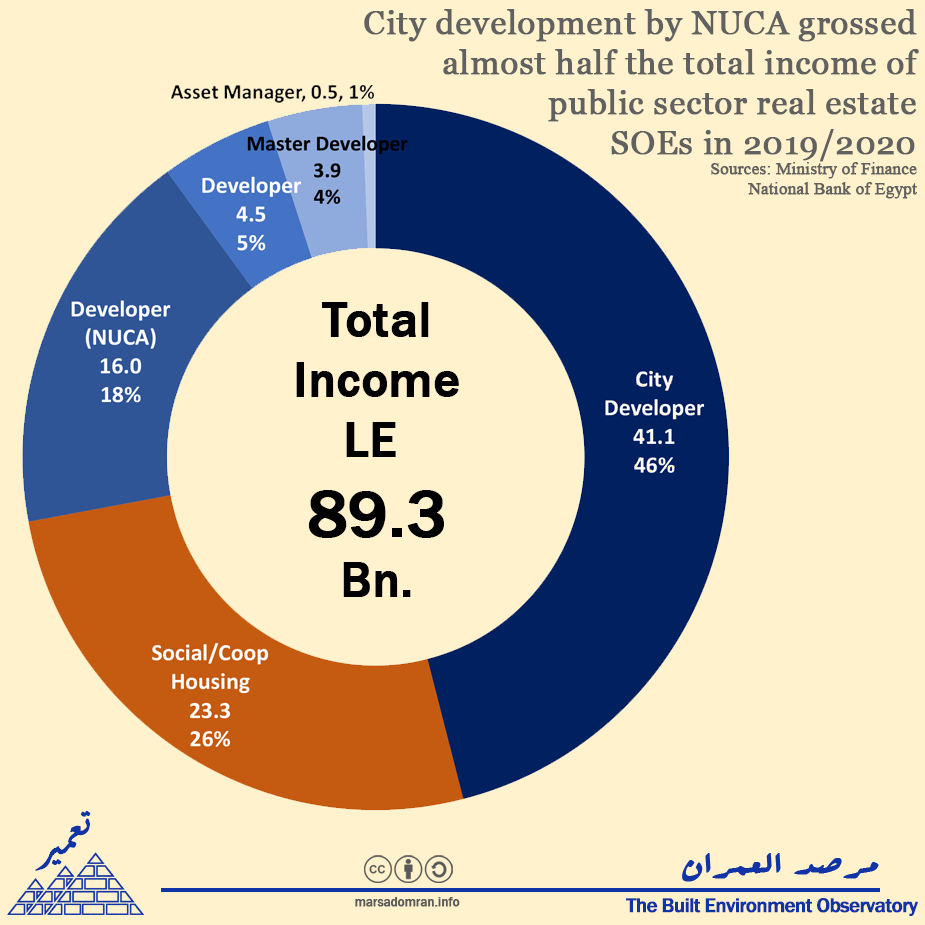
Real estate SOEs generated almost LE 90bn in income in 2019/2020 (Figure 1). Unsurprisingly, city development, all by NUCA, represented almost half of that income at LE 41.1bn. In second place was income of LE 23.3bn representing 27% of total SOE income, mostly from the sale of tens of thousands of low- and middle-income units by the SHMFF in its Social Housing and Housing for All Egyptians projects. A relatively insignificant part of this income was from the sale of cooperative housing by GOCH (see Appendix 2). NUCA’s for profit housing (Sakan Masr, Dar Masr, Janna) accounted for 18% of real estate income. Even though this activity can be considered as real estate development, its share was so significant, that it was better to isolate it compared to the other companies. Mainstream real estate development companies generated 4% of real estate SOE income. When NUCA and company operations are added together, real estate development by SOEs would account for 23% of income, or almost as much as that of low and middle-income housing. Master developers generated LE 3.9 bn or 4% of total SOE income. This figure is however misleading as it does not include El Mostakbal/MIDAR, which would boost it considerably., while asset managers accounted for barely 1%.
Figure 1: SOE Income by real estate sub-activity in 2019/2020 (LE bn). For sources see Appendix 2.

Income to Other SOE activity
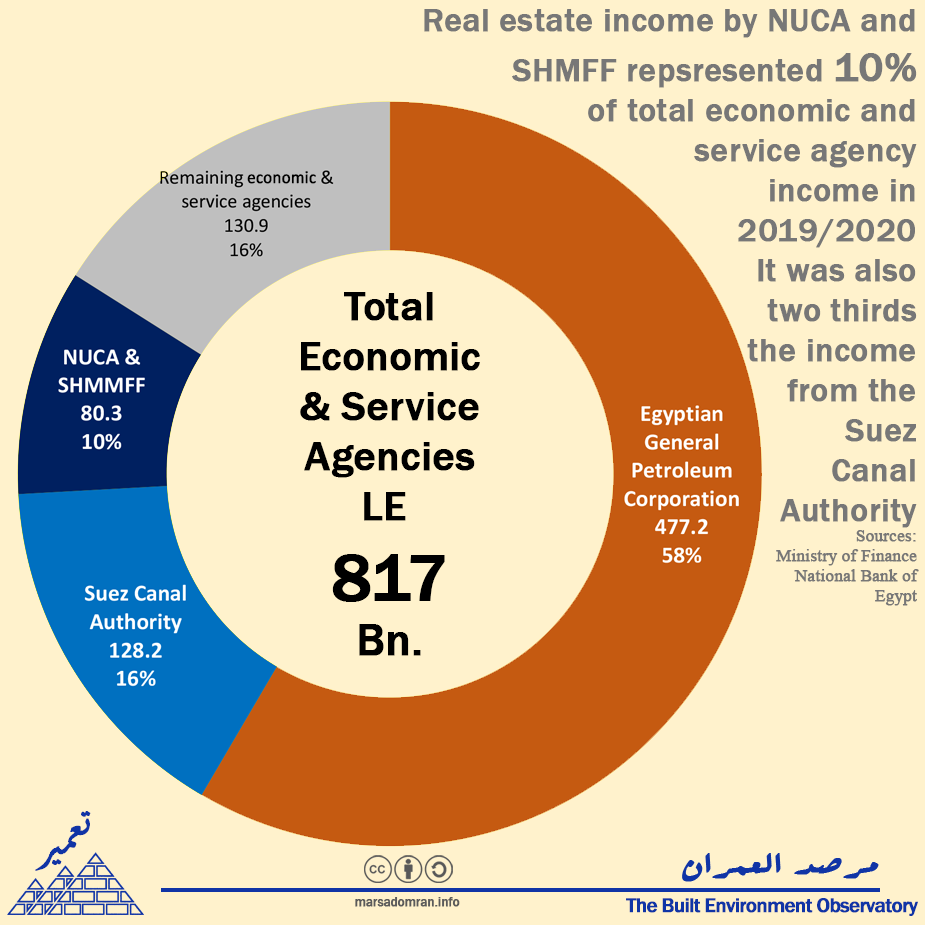
Income from the main agencies involved in real estate, NUCA and the SHMFF was around LE 80bn in 2019/2020 which represented 10% of total income from both economic and service agencies that year (Figure 2). Their income made them the third largest public agency activity, after perennial giants: the Egyptian General Petroleum Corporation, which grossed 58% of all SOE income, and the Suez Canal Authority, which grossed 16%. SOE income from all other activities was only one third more than from real estate.
Figure 2: Economic and service agency income by agency in 2019/2020 (LE Bn.)

Income to GDP
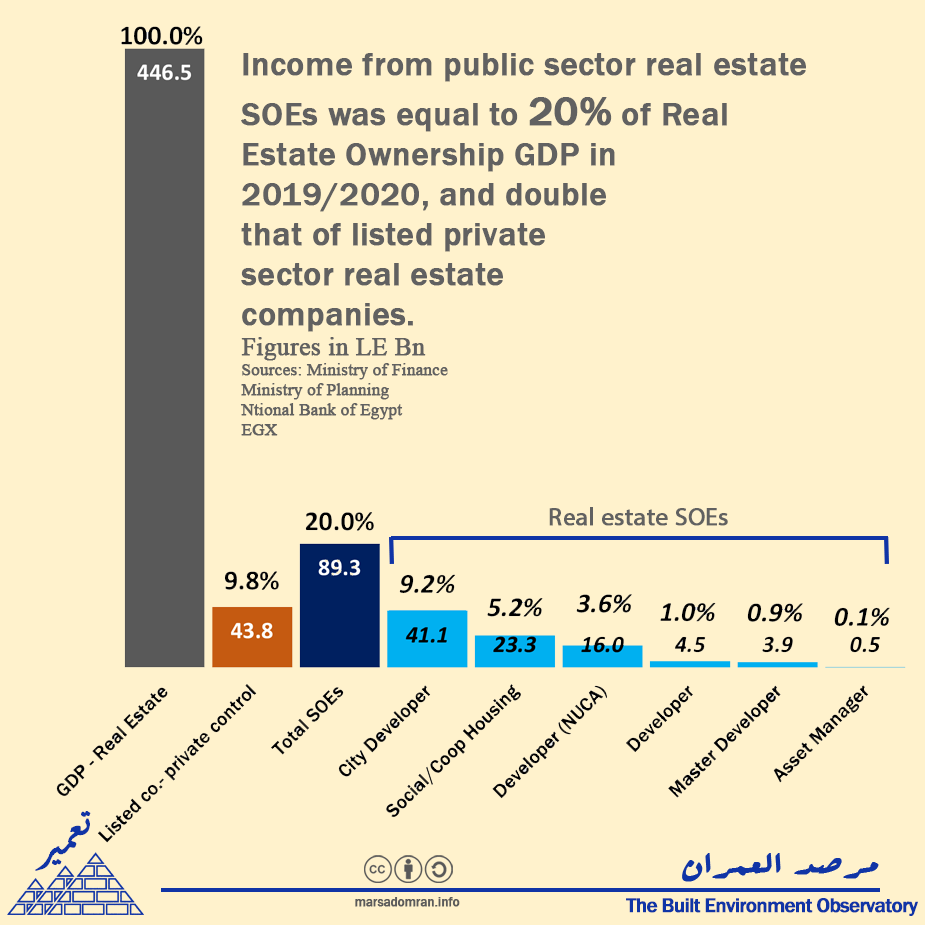
Added together, the 17 real estate SOEs’ income represented 20% of the real estate ownership activity’s share of GDP a a comparison with the known private sector – 27 real estate companies listed on the EGX and that were under private control in 2019, total SOE income was also almost double theirs. If we removed city development and social housing to better compare public sector with private sector activity, then total SOE income would be a little more than half the listed private sector’s (5.6% to GDP).
On an activity basis, city development accounted for 9% of real estate GDP, followed by low and middle-income housing that compared to 5% of GDP. Real estate development by NUCA (middle income and luxury housing) was 3.6% of real estate GDP where total real estate development would increase by 1% to 4.6% if the smaller state-owned companies were added. Master developers accounted for a little less than 1%, and asset managers where the smallest at 0.1%.
Figure 3: Income comparison of SOEs by real estate activity and listed privately controlled companies to real estate ownership GDP in 2019/2020 (LE Bn)

Conclusion
Public involvement in the real estate sector is distributed across a wide array of ministries and state-owned banks, covering a range of activities. Here, two sectors stand out which are unsurprisingly dominated by the state: city development and low-income housing. However, real estate development by NUCA itself, rather than its affiliated companies, is quite large at 3.6% of real estate GDP and about one third of the listed private sector. It is also one third bigger than state-owned master developers’ and real estate developers’ incomes combined.
Developments in the privatization program are due to change these figures over the coming year, however their change will be limited to the master-development and asset management activity by companies that account for less than 5% of SOE income, leaving overall real estate SOE income strong.
Appendix 1: Methodology
We able to gather financial information on 14 state-owned or controlled real estate companies in addition to two economic agencies that primarily act as real estate developers, and that are allowed to sell a portion or all of their housing at market rates, and one service agency, the Social Housing and Mortgage Finance Fund, that sells social housing. These entities cover almost all the real estate portfolios of the Ministry of Housing, Utilities and Urban Communities (MoH), and the Ministry of Public Business Sector (MoPBS) through its Holding Company for Construction and Development (HCCD), in addition to some companies controlled by state-owned commercial banks, Banque Misr and the National Bank of Egypt (NBE). SOEs that engage in specialist real estate activities such as in tourism or industrial development are not included.
While this list includes most major real estate SOEs, the main exceptions where financial data has not been provided are the Administrative Capital for Urban Development, and El-Mostakbal for Urban Development/MIDAR, which was valued at LE 75bn in 2018[13] (Financial data may be subsequently released if it is listed on the EGX). The list does not include companies where data is fragmented or outdated, small subsidiaries of companies already in the case study as their earnings flow into them, holding companies – especially where their companies are already represented, and companies where the state does not have controlling interest (generally below 50%).
Types of SOEs
There are three general typologies of SOEs in this study, with some exceptions. We did our best effort to harmonise chief financial data between them as they follow differing accounting practices. Thus, the main data we focused on across the study was: total assets, income, net profits, and taxes. Paid in capital could not be harmonised, as in many cases some companies’ data did not seem up to date, while agencies’ capital is nominal.
State-owned companies (Public business sector)
These are entities that are Joint Stock Companies under Law 159/1981, or Public Business Sector Law No. 203/1991. These are supposed to act as private companies do, and are subject to the same income tax regime, and are generally not allowed to receive subsidies from the government. Their articles of association set out how profits are distributed, with standard legal reserve and exceptional reserve requirement, employee and board of director shares, as well as large board discretion to how dividends are paid out to their holding companies, or controlling agencies.
Economic agencies
Entities under their own special laws, though that adhere to Public Finance Law 6/2022, that are allowed to generate profits much like companies do. They are also generally not allowed to receive subsidies from the government, with some significant exceptions in the energy and utilities sectors, though their main accounting departure from companies is that they are generally not taxed, and their profits are officially termed as surplus (fa’id), which is negotiated on an annual basis with the Ministry of Finance, receiving anywhere between 100% to zero, where the balance is allowed to be reabsorbed as a reserve.
| Economic Agency | Regulation | |
| 1 | New Urban Communities Authority (NUCA) | Law 59/1979 |
| 2 | Ministry of Reconstruction Housing Fund (MoRHF) | PD 494/1979 |
| 3 | General Organisation for Cooperative Housing (GOCH) | PD 193/1977 |
Service agencies
Entities under their own laws that adhere to Public Agency Law 61/1963, where they receive direct budget support from the treasury for their deficits. Their balance sheets and income statements show income, but do not show assets or profits (generally do not generate a surplus), and they are not taxed. We included only one such agency, the Social Housing and Mortgage Finance Fund (SHMFF), established by Law 93/2018, for comparative reasons as its income from selling price-regulated social housing, were significant.
Appendix 2: Real Estate SOEs’ Income
| SOE | Real Estate Activity | Income in 2019 or 2019/2020 (LE) | Sources (Final accounts) | |
| 1 | New Urban Communities Authority (Total) | All activity | 57,060,524,029 | MoF FSEA 2021 p180 |
| 1a | New Urban Communities Authority (sub tot a) | City Developer | 41,083,577,301
|
Housing est. as 28% of income.[14] |
| 1b | New Urban Communities Authority (sub tot b) | Housing – For Profit | 15,976,946,728
|
|
| 2 | Social Housing and Mortgage Finance Fund | Housing – Low and mid income | 23,008,847,000 | MoF SAR 2019/2020 p1865 (Budget) |
| 3 | Hyde Park Developments | Developer | 2,027,553,431
|
HDBK Con fin 2019 p53 |
| 4 | Maadi Company for Development and Construction | Master Developer | 1,439,370,000 | Maadi Con Fin 2019/2020 |
| 5 | Heliopolis for Housing and Development | Master Developer | 1,125,960,000 | HELI Con Fin 2020/2021 |
| 6 | Housing and Development Bank (Housing activity) | Developer | 1,032,046,846 | HDBK Con fin 2019 p46 |
| 7 | City Edge Developments | Developer | 847,183,493
|
HDBK Con fin 2019 p53 |
| 8 | Al-Nasr for Housing and Development | Master Developer | 683,883,000 | Al-Nasr Con Fin 2019/2020 |
| 9 | Zahraa al-Maadi Investment and Development | Master Developer | 581,846,296 | ZMID Con Fin 2019 |
| 10 | Misr Real Estate Assets – MISRREA | Asset manager | 474,579,000 | MoF BISEU p77 |
| 11 | Saudi Egyptian Developers | Developer | 358,924,000 | MoF BISEU p489 |
| 12 | General Organisation of Cooperative Housing | Housing – Cooperative | 258,386,632 | MoF FSEA 2021 p181 |
| 13 | Al Shams Housing and Urbanization | Developer | 233,973,000 | ELSH BoD Report 2022p11-13 |
| 14 | Tenth of Ramadan for Construction, Marketing and Real Estate Investment | Developer | 88,151,000 | MoF BISEU p483 |
| 15 | Misr Development Company | Developer | 81,335,000 | MoF BISEU p485 |
| 16 | Egyptian Company for Real Estate Asset Management & Investment | Asset manager | 62,500,000 | NBE Sep Fin 30 June 2021 p48-49* |
| 17 | Maspero Urban Development | Developer | 47,000,000 | NBE Sep Fin 30 June 2021 p49 |
| Total real estate SOEs | 89,469,041,727 | |||
| MoF FSEA 2021: Ministry of Finance, Financial Statements for Economic Agencies on 30/6/2021.
MoF SAR 2019/2020: Ministry of Finance, Services Authorities Income 2019/2020 MoF BISEU: Ministry of Finance, Balance and income statements of economic units 2015 – 2019 Con. Fin.: Consolidated financial statements Sep. Fin.: Separate financial statements * Average between income of Dec 2020 and Dec 2018 as Dec 2019 was not available. |
||||
Aknowledgements
Lead researcher: Yahia Shawkat
Assitant researcher: Dina El-Mazzahi
Notes and References
[1] International Monetary Fund, ‘Arab Republic of Egypt: Request for Extended Arrangement Under the Extended Fund Facility-Press Release; and Staff Report’ (International Monetary Fund, 10 January 2023), 2,
[2] ARE, The Cabinet, ‘Status of the Offering Program Companies – February 2023’ (ARE, The Cabinet, February 2023),
[3] Gamal Essam El-Din, ‘Al-Mogamma: Phoenix from the Ashes – Egypt – Al-Ahram Weekly’, Ahram Online, 8 December 2021.
[4] Doaa A.Moneim, ‘Egypt’s Sovereign Fund to Transform Former Interior Ministry’s HQ into 3-Star Hotel and Mixed-Use Destination – Economy – Business’, Ahram Online, 28 March 2023,.
[5] Nehla Samir, ‘Egypt’s Sovereign Fund, Bidayat Sign MOU to Develop Historical Area of Bab Al-Azab – Dailynewsegypt’, 20 September 2021.
[6] Some have also historically acted primarily in one category, though today may be in a different one. And since there is no clear legal definition of these activities, this is an observational assessment based on general activity over the past decade.
[7] New Urban Communities Authority, ‘Authority Achievements’, New Urban Communities Authority (NUCA), 2022,
[8] Bakr Bahgat, ‘76 Milyar jeneih iradat mustahdafa li-l-mujtama’at al-’umraniya al-’am al- hali’, Hapi Journal (blog), 26 August 2020.
[9] The remaining 51% are owned by the Ministry of Defense. See: Presidential Decree 57/2016.
[10] Marwa Hamdan, ‘Al-muqawiloun al-’arab tabi’4% min hisatiha bil-mustakbal li bankay al-ahly wa misr bi 3 milyar geneih’, Amwal al-Ghad, 22 July 2018,
[11] It is however slated for a private offering and financial data may be made available over the coming months.
[12] Presidential Decree 102/2023
[13] Hamdan, ‘Al-muqawiloun al-’arab tabi’4% min hisatiha bil-mustakbal li bankay al-ahly wa misr bi 3 milyar geneih’.
[14] According to a NUCA source who split revenue into land sales and housing sales. See: Bakr Bahgat, ‘76 Milyar jeneih iradat mustahdafa li-l-mujtama’at al-’umraniya al-’am al- hali’, Hapi Journal (blog), 26 August 2020,
