- Published on 20 November 2016
Introduction
As Egyptians, we have been raised since the 1950s with the notion that the Nile Valley and Delta, permanent home to our civilisation for over 7000 years, is overcrowded and cannot accommodate any more people. As architects and planners we have been trained over the last half century almost solely on designing mega regional, urban and land reclamation plans in the vacant desert. The purpose of these is to “redistribute the population” and absorb future population growth.
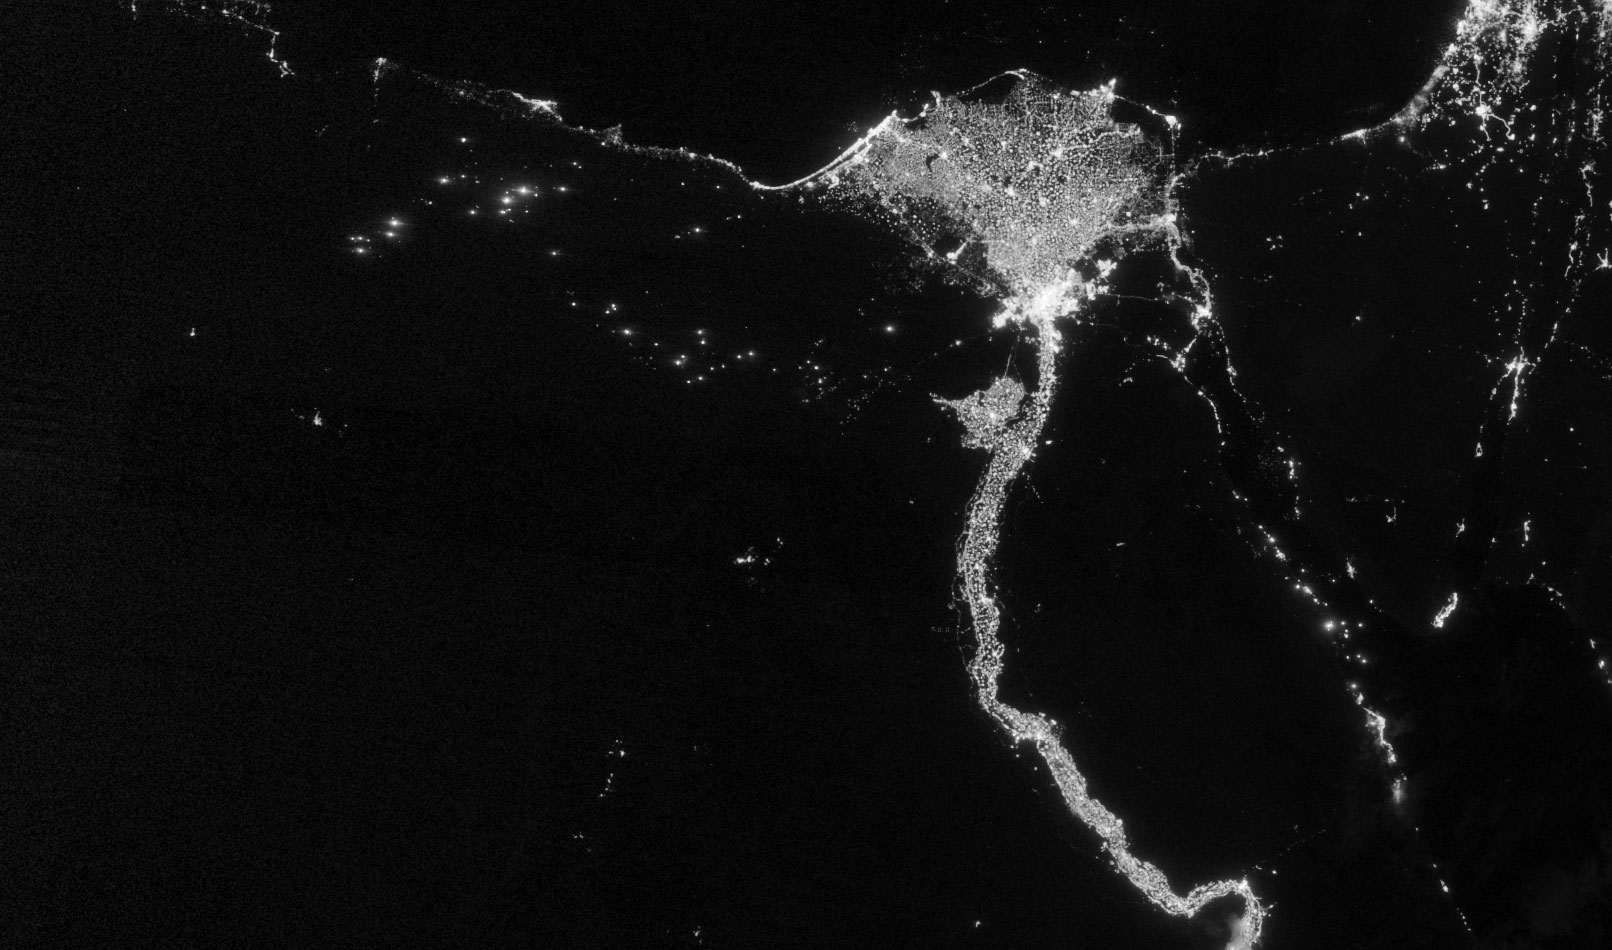
Billions of pounds of public money have been directed by the various governments to no less than four so-called strategic development plans, including six mega land reclamation projects and 22 so-called New Cities over the last sixty years. A considerable portion of these investments have been loans from international agencies whose literature on Egypt has echoed this “topological imperative” of overpopulation and land shortage with large-scale desert development as a natural answer to the problem[1]. Indeed one of the World Bank’s recent reports on Egypt has on its cover a satellite image showing population concentration in the Nile Valley[2].
In all these years, none of the mega projects has met a fraction of the set spatial or population targets. Egypt’s growing population has almost tripled since the first of these plans, though still lives in its historic confines, where inhabited land mass has grown less than 2 percent. A far cry from the 32 percent envisioned in one of the development plans. It is true that Egyptians suffer from gross inequality in their built environment. The majority are without secure tenure, over half do not have access to sanitation, 13 percent do not have access to safe water, and around 3 percent live in dangerous shelter. However, these inequalities have less to do with population density, and more to do with the formal drive to expand into the desert as is demonstrated in our analysis of the 2015/2016 Built Environment Budget[3].
In order to contribute to bringing spatial equality to urban planning in Egypt, this study aims to interrogate two myths: that the Valley and Delta are indeed overcrowded, and that the only solution is for both existing and future populations to migrate to and settle in urban and rural mega projects.
The first part of the study analyses Myth One through calculating gross and inhabited densities at the sub-national governorate levels to find out if there really is such a notion as too high a density requiring, in turn, mass resettlement. If so, does the entire Valley and Delta suffer from it, or do only certain governorates suffer from it?
The second part of the study interrogates Myth Two. Assuming that certain portions of the Valley are indeed overcrowded, the section presents the history of mega relocation schemes and questions their efficacy as solutions to overcrowding. This section focuses on the two main typologies repeated with uncanny consistency: large-scale land reclamation projects and giant desert New Cities. Were they planned wrong, or was the problem one of implementation?
Contrary to fresh strategic urban plans that continue on this policy of population redistribution to mega desert projects, this study concludes with recommendations for more just and inclusive strategic planning policies that may prove to be more efficient in tackling the spatial inequality from which the a majority of Egyptians suffer.
A Note on Methodology
Thoughts and recommendations in this study are derived from qualitative and quantitative data analysis. Quantitative data on population and areas were collected from official sources including the General Organisation for Physical Planning (GOPP) and the Central Agency for Public Mobilization and Statistics (CAPMAS). However, where area data seemed unrealistic or missing the researchers used GIS calculations to fill in the gaps. Calculations of densities and population growth rates were also made by the researchers, where extended tables are presented in the appendices.
For qualitative analyses a range of available literature was reviewed including official strategic plans, scholarly studies and newspaper reports spanning six decades between 1954 and 2016 in order to assess what was planned versus what was achieved in reality.
1. Myth 1: The Overcrowded Valley
Despite the different policies adopted since establishment of Egypt as a republic in 1952, all its presidents have promoted leaving the overcrowded Nile Valley and Delta and invading occupying the desert. They have all touted mass population redistribution, and at times, relocation. They encouraged schemes where Egyptians depopulate the “overcrowded”, “saturated” or “old lands”, and expand to the “new lands”. But six decades on, Egypt’s population has both trebled and stayed largely put in the Valley, without major spatial problems. Granted, both formal and informal urban expansion over agricultural land have had major ramifications on food sovereignty. Also, local, suburban and regional traffic congestion affects most Egyptian cities and villages. However both can be argued from planning and management angles, while little has been asked about density in and of itself. How dense is the Valley in fact? Is there such density that life is to be deemed unsustainable?
How Dense is the Nile Valley and Delta?
There are multiple ways to measure density. These depend on what you want to show. We employed three measures of population density to determine the extent of overcrowding in the Nile Valley and Delta .
(Figure 1) demonstrates the definition of gross, inhabited and built up densities used in this chapter (see Annex: Population densities in Egypt)
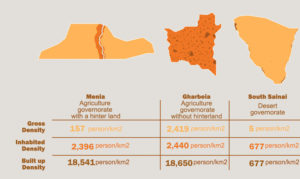
Figure 1 Terminologies adopted for gross, inhabited and built up densities
Gross Densities
First let’s start by calculating the sub-national gross densities for each of the 27 governorates. This entails dividing the population numbers by the total area of each governorate, including all the vacant desert land that may be within its administrative boundaries. Overall most governorates turn out to have very low densities, the average between the governorates being 854 people per square kilometre, or 3.6 people (almost a family) per acre.
It was not surprising that the Valley governorates in Upper Egypt all had below or far below average densities, as they had large swathes of desert land within their administrative boundaries. It was also not surprising that Delta governorates were somewhat above this average, especially those that did not have access to the so-called desert hinterland such as Kafr al-Shiekh (903 pax/km2); Damietta (1446 pax/km2); Daqahlia (1662 pax/km2) and Gharbia (2419 pax/km2). More surprising, however, was how the other Delta governorates on the fringes with access to desert and with similar populations to the ones they surrounded, had either similarly high densities (1304 and 1557 pax/km2 in Sharkia and Munufia respectively), or the highest (4486 pax/km2 in Qalubia). Beheira by contrast, had a below average denisty of 582 pax/km2.
Cairo and Alexandria, the largest and second largest city-governorates respectively, had some of the highest gross densities (2977 and 2070 pax/km2), hardly surprising given that they are both overwhelmingly urban metropolises (Figure 2) (seeAnnex: Population densities in Egypt).
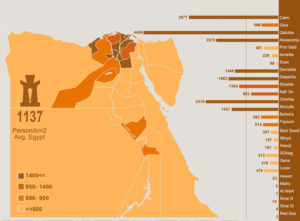
Figure 2 Gross densities
The map shifts tellingly once vacant desert land, lakes and lagoons, are taken out of the equation, and built up areas, cultivated fields and roads and canals are included in the calculation of inhabited density. Density averaged 2180 pax/km2, or about 2.6 times the gross average. Here the Greater Cairo metropolis leads, with Cairo, Qalubia and Giza coming in first, third and fourth at 10,579, 4627 and 3777 pax/km2 respectively.
Highly intriguing is the fact that the Red Sea, a sparsely populated desert governorate with the second lowest gross density, had the second highest inhabited density at 4796 pax/km2. This fact alone is critical to understanding the importance of including not only gross densities but also inhabited densities in the decision making process (Figure 3) (seeAnnex: Population densities in Egypt).
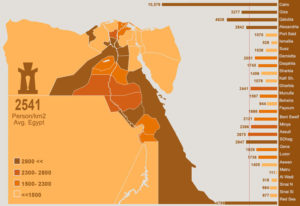
Figure 3 Inhabited densities
Ratio of Gross to Inhabited Density
The contrast between the gross and inhabited densities of the governorates is better shown as a ratio, where governorates were listed according to the difference between the total land available within their administrative boundaries on the one hand, and, on the other, the land already inhabited, built up, cultivated or made up of uninhabitable water bodies. Governorates that had inhabited all their land or allocated it to certain uses had a ratio of 1:1. Those that had a high utilization of land were between 1.1- 1.5:1. Those that had medium utilization of land were between 1.5 -2:1, while those that had much more vacant desert land than inhabited land had ratios higher than 2:1.
Only four governorates (Qalubia, Munufia, Daqahlia and Gharbia) had a ratio of 1:1. Given that both Daqahlia and Gharbia do not have access to desert land adjacent to their administrative boundaries, population growth would either lead to densification of existing built up areas, or expansion on agricultural land. On the other hand, both Qalubia and Munufia have under-utilised desert land especially within their New Cities of about 105km2 and 65km2 respectively. These latter can accommodate between one to two million people at an average density of 15,000 people/ km2.
Another four governorates (Damietta, Kafr al-Sheikh, Alexandria and Sharkia) had a high utilization of land and gross to habitable density ratios of between 1.1-1.5:1. While these governorates still have some room to easily accommodate population growth, all bar Sharkia are susceptible to different degrees of flooding due to rising sea levels, as well as the risk of storm surges (tsunami waves) to their coastal human settlements.
Only one governorate, Beheira, had medium utilization of land (a ratio of 1.6:1), currently having a considerable portion of underutilised desert land. The remaining 19 governorates have low utilization of their land ranging from a low of 2.2:1 for Port Said to a high of 1675:1 for the Red Sea. Even the 11 governorates on the Nile Valley had ratios of 3.3-62:1 (Figure 4) (seeAnnex: Population densities in Egypt).
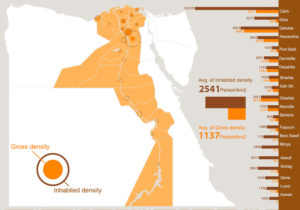
Figure 4 Gross to inhabited area ratios
This form of density calculation shows the real-world densities for human settlements per governorate, taking into consideration soley the area in which most people live: buildings, streets, parks and infrastructure. BUA densities ranged from a low of 150 people/km2 in Matruh (a desert governorate with mostly Bedouin settlements and large tourist resorts), to a high of 30,884 in Fayoum (a rural governorate, with large agricultural land, but also surprisingly, with a lot of vacant desert land).
Surprisingly, out of the top ten governorates according to their BUA densities, only two, Qalubia and Gharbia, were in the Delta. Also surprising was that the governorate with the second highest BUA, Suez, is a desert governorate on the Suez Canal and outside of the Nile Valley. Cairo, usually presented as the densest governorate, was tenth overall, with a BUA density of 13,643 people/km2. However this does include New Cities. If we consider only Cairo City where the majority resides, BUA rises to 33,000 people/km2 (Figure 5) (seeAnnex: Population densities in Egypt).
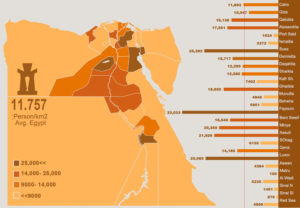
Figure 5Built up densities
When compared on an international level in terms of density, only two governorates make the top ten, with Fayoum and Suez in fourth and eighth places respectively (Figure 6).
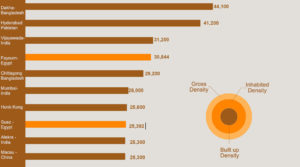
Figure 6 Comparison of the built up densities of the top urban centers worldwide with Egyptian governorates
2. Myth Two: Leave to Mega Projects
Over the last six decades, the government has tried to redirect population growth to two main types of desert development: mega land reclamation schemes with new rural settlements, and large-scale urban desert development in so-called New Cities. These projects were either embedded in national strategic plans with two to four decade horizons, or, in most cases, the plans were designed around the projects (Figure 7).
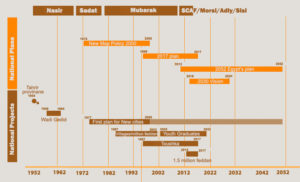
Figure 7 National projects and plans
In the 1960s, Nasser promoted leaving the Nile Valley to new rural settlements that were part of regional projects based on vast desert reclamation schemes. They started with the Tahrir Province (Mudireyat al-Tahrir) scheme in 1954 to reclaim 600,000 feddans of the western desert[4]. By the end of that decade, formal thinking shifted to strategic plans. Another mega reclamation scheme was announced as part of the first five year national plan issued in 1959: the establishment of the New Valley in the Western Desert, parallel to the existing valley. The plan hinged on the use of the existing oases as a base to reclaim between 500,000 and three million feddans[5], that were to become home to four million people[6].
During the 1970s, Sadat coined the term Ghazw al-Shara’ (literally, Desert Invasion) and introduced his New Map for Egypt. He unveiled his vision of the New Cities: vast urban settlements built from scratch in the middle of the desert that would host millions of residents by the year 2000. This was in addition to his plans for mega land reclamation schemes[7].
This trend continued under Mubarak who in 1987 initiated the Mubarak Project for Youth Graduates (Qura al-Kharigeen). In 1997 he combined both rural and urban schemes in the Egypt 2017 Urban Development Plan, which aimed to redistribute the projected population growth of 24.4 million people over the next 20 years into the desert: 13.3 million to 44 New Cities and the rest to land reclamation projects over an area of 4.3 million feddans, including the Toshka mega project[8]. A few years later, the Desert Fringe Villages (Qura al-Thahir al-Saharawi) scheme was launched as part of Mubarak’s presidential plan in 2005. The plan was to construct 400 villages accommodating five million people by 2022 as well as reclaiming one million feddans[9].
The January 2011 Revolution and change of regimes has not slowed down the efforts to redirect population growth into desert mega projects. The National Strategic Urban Development Plan Egypt 2052, started under Mubarak but finalized in 2012 and updated in 2014, proposes to redirect the projected growth of 80 million people into both urban and rural new settlements, expanding the total inhabited land mass of Egypt by 12 million feddans, with 6.4 million feddans to be reclaimed[10]. In tandem with the Egypt 2052 plan, the current government recently launched the Sustainable Development Strategy Egypt 2030. While including specific social goals such as reducing the number of households using unsafe water or without proper sanitation, this strategy is still primarily dependent on redistributing population growth towards new desert settlements and includes in Goal 8, the expansion of the inhabited area of Egypt by 7.1 million feddans by 2030. A tenth of this area is urban [11] (Figure 8).
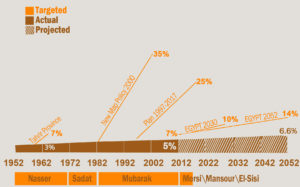 Figure 8 Area Targets over time
What is noticeable in the successive strategic plans is that they have all failed in their pursuit to increase habitable land mass in Egypt to anywhere near their targets. Inhabited land mass has increased by about 2 percent over the last fifty years, or at a rate of approximately 0.04 percent annually (Figure 8).[12] In comparison, government projects have projected between a low of 0.3 percent in the Egypt 2030 plan to a high of 1.3 percent for the New Map for Egypt (Table 1). To put them in perspective, these planned rates of growth range between an over-ambitious 7.5 times the actual rate of growth (Egypt 2030) to a simply ludicrous 33 times (New Map Policy).
Table 1 Comparison between the inhabited land areas each plan aimed to add
| Strategic Plan | Horizon | Projected Growth (Total) | Projected
Growth (Annual) |
Diff. to Actual Growth |
| Years | % | % | Ratio | |
| New Map 2000 | 25 | 32 | 1.3 | 33 |
| Egypt 2017 | 20 | 20 | 1.0 | 25 |
| Egypt 2052 | 40 | 24 | 0.6 | 15 |
| Egypt 2030 | 14 | 4 | 0.3 | 7.5 |
This of course has had a dramatic effect on the social targets of the plans to attract millions of Egyptians to migrate out of the valley and into the desert. A full 52 years after the New Valley project was started, a mere 230,591 people were living there[13]. This is about 7.7% of the targeted four million inhabitants[14]. The Toshka mega project suffered a similar fate. In 2012, eight years after reclamation work had started and five years from the deadline, only 5.5% of the down-sized target of 300,000 feddans were reclaimed[15]. In terms of population, only 2655 people were living there in 2006[16], far less than 1% of the target population of three million people by 2017 . [17]
It was even worse for the Desert Fringe Villages and One Million Feddan reclamation project that started under Mubarak in 2005. Eight years on, only 13 villages were constructed, while another 49 were under construction from the 400 targeted[18]. None of the one million feddans were reclaimed, as coordination between the Central Agency for Construction (CAC), the agency in charge with building the villages, and GARPAD, the agency responsible for land reclamation, was absent, leading to villages being located in land unsuitable for cultivation, irrigation water not being supplied, or the land simply not being allocated to beneficiaries.[19] Beneficiaries themselves did not move to the villages as without land, most would not have a means for income. But the villages themselves were also not ready to be lived in as many did not have drinking water, were being inundated by sand dunes, or were at risk of being washed away by flash floods.[20] A Central Auditing Authority report claimed that half a billion EGP were squandered in this project,[21] leaving most as qura ashbah, ghost villages, whiling away in the sand (Figure 9 and 10).[22]
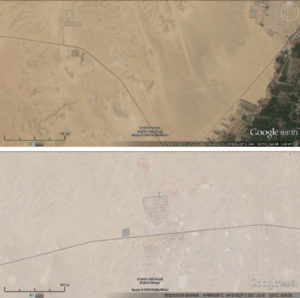
Figure 9 Recent aerial images taken in 2015 of Mallawi al-Gadida (top) and Faris al-Gadida (bottom) villages showing how surrounding land has yet to be reclaimed. © Google Earth
For the remaining mega reclamation projects including the Tahrir scheme and the Mubarak Youth Graduates Programme, there is an almost complete lack of data on both their population and reclamation targets, as well as how they progressed. This makes it impossible to analyse them. The same is true for New Cities (For more on the see Section 2.2) (Figure 10).
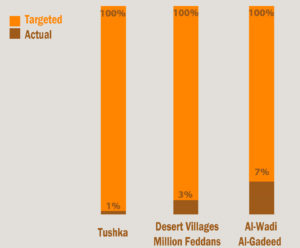
Figure 10 Targeted versus achieved population targets in reclamation projects
2.1 Problems with Planning Mega Land Reclamation Projects
With both social and reclamation targets woefully under met, it is hard not to conclude that the mega land reclamation projects were socially, economically and technically ill-conceived.
On the social front, migratory patterns and household needs were not properly studied, and inaccurate standards for population projection were used. For example these projects attracted mostly individual workers rather than families. According to the 2006 census, of the 2655 people living in Toshka, all were individuals rather than households, living in a total of 18 so-called ‘general buildings’- non-permanent housing such as hostels, workers’ barracks or shacks.[23] Tellingly 2652 were men, and only 3 were women. This is possibly due to the frontier-like situation of a new project such as Toshka: where large scale construction is underway, where there is a lack of job security, in a remote location which is also lacking in social services such as schools and health. All this makes it almost impossible for families to migrate.
Planning standards used to project population numbers were also wholly inaccurate. The Development and Construction Plan for Egypt 2017 had estimated that the High Dam Region, of which Toshka was a main project, would attract one million people by 2017[24]. It was a given that every feddan would provide one job opportunity, thus creating 540,000 jobs.[25] In addition, each job opportunity would support one family, with a household size of five people: two parents, and three children. Hence every feddan was estimated to attract five persons, meaning a target population of 2.7 million people.[26] In reality, the average size of the Egyptian household was 4.2 people in the 2006 census[27], and not 5, while plots for small holders have usually been between 5 to 10 feddans each. This amounts to a worker to feddan ratio of 0.2 to 0.1 per feddan, and not a one to one ratio as was presumed. All of the Toshka plots however were mega sized (between 10,000 to 130,000 feddans), where investors used labour un-intensive pivot irrigation which could use one operator and a handful of seasonal workers for every 120 feddans. This meant an even lower labour per feddan ratio (Table 2).
Table 2 Range of scenarios for target population in Toshka
| Scenario | Feddans | Agri Labour/ Fed | Household Size | Agri Pop. | Supporting Labour/ Fed. | Household Size | Supporting Pop. | Total Population | |
| A | 1 | 540,000 | 1 | 5 | 2,700,000 | 1 | 5 | 2,700,000 | 5,400,000 |
| 2 | 540,000 | 0.1 | 4 | 216,000 | 0.1 | 4 | 216,000 | 432,000 | |
| 3 | 540,000 | 0.1 | 4 | 216,000 | 0.05 | 4 | 108,000 | 324,000 | |
| 4 | 540,000 | 0.1 | 1 | 54,000 | 0.05 | 1 | 27,000 | 81,000 | |
| B | 1 | 300,000 | 1 | 5 | 1,500,000 | 1 | 5 | 1,500,000 | 3,000,000 |
| 2 | 300,000 | 0.1 | 4 | 120,000 | 0.1 | 4 | 120,000 | 240,000 | |
| 3 | 300,000 | 0.1 | 4 | 120,000 | 0.05 | 4 | 60,000 | 180,000 | |
| 4 | 300,000 | 0.1 | 1 | 30,000 | 0.05 | 1 | 15,000 | 45,000 | |
| C | 1 | 20,102 | 0.1 | 4 | 8,041 | 0.1 | 4 | 8,041 | 16,082 |
| 2 | 20,102 | 0.1 | 4 | 8,041 | 0.05 | 4 | 4,021 | 12,062 | |
| 3 | 20,102 | 0.1 | 1 | 2,010 | 0.05 | 1 | 1,005 | 3,016 | |
Table 2 projects a range of scenarios for population size based on changing the parameters of land reclaimed, the size of households and the ratio of jobs per feddan. It serves to demonstrate how when just the social parameters of household size and the labour per feddan ratio are adjusted, the projected population in 2017 for the lead scenario A1, shrinks from 2.7 million people, to 216,000 people in scenario A2 (Table 2).
On the economic front, some planners suggested that each direct job opportunity in agricultural labour would generate one indirect job opportunity in supporting industries such as packaging, trade, transport and social services.[28] With the revised labour per feddan ratio down to 0.1, this would mean that the population projection for supporting labour would shrink from 2.7 million to 216,000 people (Table 2). Common sense however makes the supporting labour to agricultural labour ratio very tricky to calculate since many variables have to be taken into consideration. The main reason being that the line between pure agricultural labour and supporting industry is blurred in large-scale and industrial farming, where the same worker can complete a number of tasks in both ‘sectors’ and particularly in that the tasks are seasonal. For example a worker may be involved first in harvesting a crop, and later be involved in packaging it at the depot. At best any extra labour needed would be a fraction of the already existing agricultural labour, and at worse, would only be seasonal and thus non-permanent. Therefore if we bring the agricultural labour to supporting labour ratio down to 0.5: 1, or 0.05 per feddan, the projected population for supporting labour would be halved from 216,000 people, to a mere 108,000 people, meaning the total population projection for Toshka’s original target area in Scenario A1 would shrink from 5.4 million people, to Scenario A3’s 324,000 people, or a mere 6% of the original projected target (Table 2) (Figure 11).
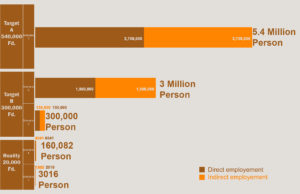
Figure 11 Direct and indirect employment scenarios for Toshka project
This fraction of a target shrinks even more if we add the fact that in the early years of development, and given the remote location of Toshka, workers would chose to migrate alone, leaving their families behind. Scenario A4 shows a total of 81,000 people living in Toshka in the case of migratory labour, or 98.5 percent less than the original projected population of A1 (Table 2).
On the technical front, the total land area that would be reclaimed by 2017 was almost halved from 540,000 feddans to the 300,000 feddans on branches 1 and 2 of the Zayed Canal after the project started. Applying the same corrections as in Scenario A, the total possible population would range from a high of 240,000 people in Scenario B2, or roughly the same as a Cairo district, to a low of 45,000 people in Scenario B4, the size of four medium-sized villages or towns (Table 2).
Building the infrastructure for the desert reclamation schemes and designating the land to companies does not automatically mean they will be implemented. In addition to technical setbacks to the scheme, there is very little control on how much land private investors, who typically make up more than 75% of desert land reclamation schemes[29], will eventually reclaim. Between 2010 and 2014, Google Earth images show that a total of around 20,000 feddans were in various states of cultivation (Figure 12). This is roughly 6.7% of the 300,000 feddan target after 75% of the timeline towards 2017 had passed. Naturally, this has had a large impact on population uptake in Toshka. Scenario C shows that between 3000 and 16,000 people could potentially be living there by now (Table 2). This is in-line with the 2006 census’ count of 2655 people, and a far cry from the governments’ envisioned millions. The coming census of 2016 will soon give us an accurate picture.
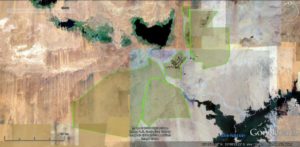
Figure 12 Composite aerial images of the Toshka project dated 2010-2014 with an overlay of the boundaries of the 300,000 feddan recalamation scheme © Google Earth
The Toshka project is a prime example of how planning standards and parameters have either been used blindly by complacent planners, or worse, deliberately abused by complicit planners for political propaganda.[30] Overall desert land reclamation projects have proven inefficient at attracting population growth out of the delta. Labour to land ratios are much lower than in the old lands due to the use of technology as well as bias towards permanent crops such as olive trees and orchards. Need for seasonal labour is high thus ruling out permanent as well as household migration. Extremely low population densities and remote locations make setting up of social services for communities difficult. These projects have also suffered from over-ambitious annual land reclamation targets that have outstripped both the government’s technical and financial ability to implement infrastructure, as well as investor’s limits in cultivating the land.
2.2 Problems with Planning New Cities
New cities have been designed to accommodate millions of people within 25 years of their founding. And while there has been a steady increase in the number of people moving to new cities, they are but a fraction of the numbers targeted by government plans. In 1997, roughly 20 years after the New City programme was started, the government laid out the 20 year Development and Construction Plan for Egypt 2017, which aimed to have 12 million people living in New Cities by then[31]. When compared to the actual population growth of New Cities as evidenced through three national censuses (1986, 1996, 2006), we find that one year away from the target, we are not even close to the plan’s targets. (Figure 13). Why then are the official targets so unrealistic?
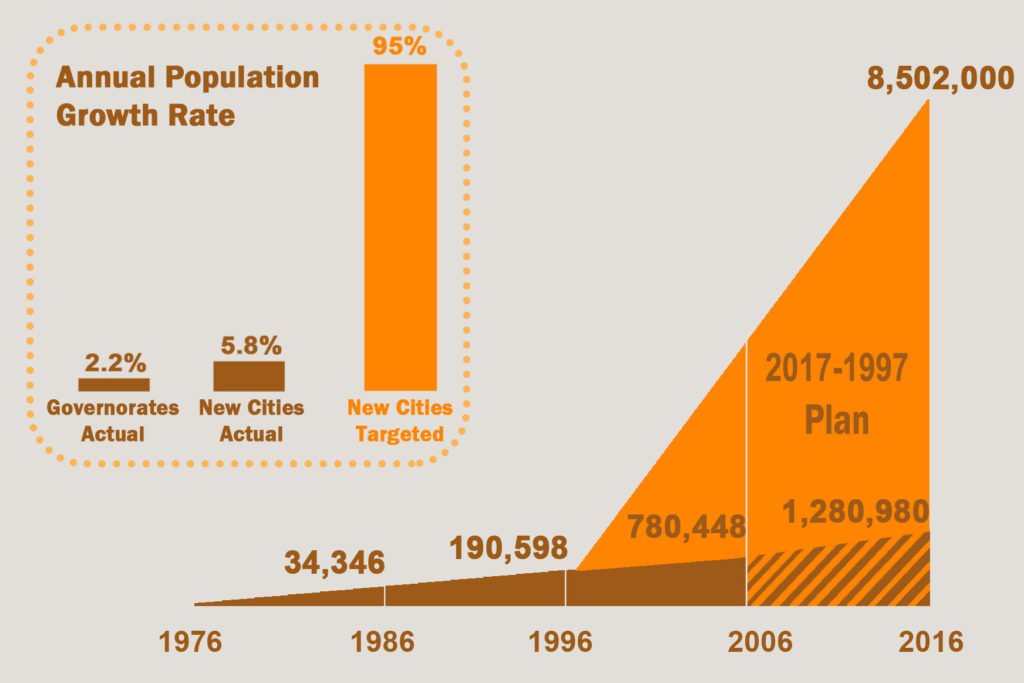
Figure 13 Projected and actual population figures for New Cities 1978-2017
Unrealistic Projected Growth Rates
First let’s look at sub-national population growth rates (GRs). In the inter-census years of 1996 and 2006, governorates grew between 1.78% annually in Kafr El Sheikh and Gharbia, and a high of 9.7% in South Sinai, which was the smallest governorate in terms of population, and one that experienced a large tourism boom (see Annex: Population Growth Rates in Egypt).
By comparison, the actual GR of New Cities averaged 5.8%, or almost double the national average, with a high of 27.1% for 15th May New City, at about three times the highest sub-national rate (see Annex: Population Growth Rates in New Cities’). This is not entirely comparable to the governorates’ GRs as these are cities not regions. They are also newly settled and thus do not show a momentum rate.
Even so, these values are a far cry from the GRs the New Cities were designed to grow at, namely around 95% per year assuming a base population of 10% of the target (see Annex: Population Growth Rates in New Cities’). This target of course is wholly unrealistic, whether when compared to the actual GR of New Cities (which is three times the highest GR and 20 times the average GR), or when compared to the highest sub-national GR where it is a full ten times higher (Figure 13).
Unequal Regional Distribution of New Cities by Land Area
Most New Cities are centralized in the Greater Cairo region which is home to three quarters of their total land area even though it represents 25 percent of the population with a per capita share of 17.5 sq. meters per person[32]. In comparison the per capita land share in Upper Egypt is a fraction of that at 2 sq. meters per person.
Even within the regions the remote locations of the cities were obstacles in and of themselves, with a number of the earlier ones located in barren desert areas tens of kilometres from the nearest existing settlements, such as 10th of Ramadan, Sadat, Shorouk and Badr cities. Even ones that have been “twinned” with existing cities, like New Damietta and most of the cities in Upper Egypt, have only served to attract population from those cities alone, and not the rural areas around them since they are exclusively urban and land use is strictly segregated.
Unequal Local Access to New Cities
Over the last 15 years, New Cities have only been affordable for upper-middle income Egyptians, where land prices in the Greater Cairo region spiked 16-fold in ten years, and continue to rise. Land distribution studies have shown huge disparities between the amount of land designated for upper-class developments compared to the bottom three deciles. In New Cairo 94 percent of land has been designated to the top two income quintiles who form only 40% of the Egyptian population.
New Cities have also had very little or no mass transit solutions, whether considered in terms of the inter-city level between them and the nearest existing settlements, or in terms of the intra-city networks within them. People moving there have had to rely on private cars which only 6.3 percent of urban households have access to (11.1 per cent urban, 2.4 per cent rural)[33], or are forced to spend large portions of their income and time on a mix of informal and formal mass transit options, where they exist, to get to and from work[34].
The result is that New Cities have served mostly speculative interests, where vacancy rates have averaged 58.6%, or twice the national average, with 281,379 residential units vacant (see Annex: Statistics of Vacant units in Egypt). New Tiba in Luxor represents the highest vacancy, a staggering 86.7% As for 15 May, which is the least vacant, it has a 31.6% vacancy rate, which is higher than the national average.
3. Conclusions & Recommendations
After six decades of basing built environment policy on the urgent need to exit a supposedly overcrowded Nile Valley, and invade the desert through failed mega projects, the valley is neither overcrowded, nor the mega projects properly planned. Mega land reclamation and New City projects have been based on unrealistic and even inaccurate population growth targets, while their regional or local concentration as well as exclusivity has been an obstacle to their social success. Planning on a regional level, and not on a governorate level, has prevented any integrated plans from being implemented, as regional administration has not been enacted in Egypt (Hendawy, 2015).
With yet a new mega land reclamation project launched recently, the 1.5 Million Feddan Project, as well as construction work starting on at least six New Cities, an overhaul of the planning regime in Egypt is badly needed if we are to address urban growth, food sovereignty and economic stability concerns in an efficient and effective manner.
3.1 Land-use Mismanagement and not Overcrowding
The above analysis has shown that the Nile Valley and Delta are not overcrowded. Many of their governorates can accommodate population growth within their desert lands. On the human settlement level in cities and villages, BUA densities were good with a median of just under 12,000 people/km2, with only five governorates having BUA densities of or over 20,000 people/km2.
So where is the problem? Land-use mismanagement at both the governorate and/or the human settlement level. Density in and of itself is not a significant issue if managed correctly. Some cities can be dense and maintain a high quality of life, Singapore being one such example[35]. Overcrowding does not necessarily mean over population[36], as higher densities do not necessarily translate into a lower quality of life. They do require planned and appropriate solutions though that includes high-rise building and integrated public transport- all solutions with their own technological and cost limitations[37]. However, mismanaged densities like we have in Egypt, with huge contrasts within one built-up area, lead to spatial inequity. All this favours redirecting the debate from one focussed on the urgency to leave the Valley, which has proven to not be a solution in and of itself, to one cantered on the need for just and effective land-use planning and management of the built environment[38].
3.2 Political and Financial Targets of National Projects Overrule Social Targets
With both mega land reclamation schemes and large-scale New Cities consistently missing their grand population targets over the last five decades, one can only conclude that they were never intended to do so. This research has shown how most projects led the (generally flawed) national strategic plans and not the other way around, where inaccurate population targets were based on false planning standards or overambitious growth rates, or both. Economically only New City projects may have been profitable for the government, and only recently,[39] while mega land reclamation schemes have put government agencies into billions of pounds of debt.[40] National Projects on the whole seem to have been extremely expensive government propaganda.
3.3 Recommendations; Bespoke Small-scale Local Urban Planning Strategies
It is an obvious fact that corruption and administrative ineptitude must be addressed and political agendas kept at bay for strategic urban development plans to have a chance to right Egypt’s urban ills. These recommendations however assume that the right administrative framework exists, and focus solely on the planning aspect, where strategic plans would be better off studied for each governorate – rather than region, have flexible short, medium and long term strategies designed and implemented through small scale local solutions using meaningful participation by the residents.
By using the density data presented here, we can divide the governorates into four groups of similar short-term intervention, or mix of interventions, based on correlations between the gross to inhabited area ratios and the BUA densities.[41] The real and imminent threat of seal level rise and risk of storm surges (tsunamis) to parts of six governorates with urbanised coastal zones are also taken into consideration (Table 3).[42]
Group One: Expansion and Land Use Management (LUM)
Qalubia is the only governorate where on the short-term, expansion of its boundaries and LUM is recommended as it has a gross to inhabited area ratio of 1:1, as well as high BUA density. Therefore the priority is for the annexation of New Obour city (under the jurisdiction of NUCA), which has tens of thousands of under-utilised desert land, and the quick and efficient LUM of it to protect agricultural land and ease BUA density.
Group Two: Densification and population growth diversion/adaptation
These four Delta governorates have both low gross to inhabited area ratios (very little to no vacant desert land), medium to low BUA densities (less than 25,000 people per square kilometre) and threat of sea level rise. It is therefore a priority that threatened areas must be identified and population growth there discouraged and diverted to neighbouring medium density areas than can be densified, while strategies are put in place for adaptation to seal-level rise and tsunami warnings and evacuation plans. On the medium and long term, most of these governorates will need population growth diversion plans to other governorates in order to prevent urbanisation on agricultural land or in areas which are in danger of sea-level rise.
Group Three: Densification, population growth diversion and Land Use Management (LUM)
These two largely urban and coastal Delta governorates have both high gross to inhabited area ratios, as well as low overall BUAs. However they have high density coastal cities that will require population growth there to be discouraged and diverted to existing low density areas within the governorate than can be densified, and/or adaptation strategies to seal-level rise including tsunami warnings and evacuation plans. They also have enough vacant desert land where LUM can allow for short and medium-term population growth, where long term the governorates’ area maybe expanded at the expense of neighbouring desert governorates to accommodate population growth.
Group Four: Densification and Land Use Management (LUM)
These twelve Nile Valley and Delta governorates all have BUA densities less than 15,000 people per square kilometre, as well as vacant or under-utilised desert land. It would be efficient to densify existing built up areas, while at the same time planning for and implementing horizontal urban expansion for near term urban growth before BUA densities get out of hand or urban expansion threatens agricultural land.
Group Five: Land Use Management (LUM)
These ten governorates are both Nile Valley and Desert governorates that have either very high or very low BUA densities, while at the same time have plenty of vacant desert land. Therefore it is not recommended that they are densified; they are either already very dense (over 25,000 people per square kilometre), or have low densities because of their cultural and geographical contexts. And so, only well planned LUM is needed, on one hand to ease high densities, but also to better serve ultra low density communities.
Table 3 Recommended urban strategies for each governorate
| Region | Governorate | Gross : Inhab.Density Ratio | Built-up Area Density (Pax/km2) | Land locked
|
SLR Risk
|
Recommended Intervention | |||
| Short-term | Medium-term | Long-term | |||||||
| Delta | Qalubia | 1.0 | 21,935.2 | Expansion/ LUM | LUM | LUM | |||
| Delta | Gharbia | 1.0 | 18,650.3 | YES | Dens./Div. | Diversion | Diversion | ||
| Delta | Daqahlia | 1.0 | 12,295.6 | YES | YES | Dens./Div.-Adap | Diversion | Diversion | |
| Delta | Kafr el-Sheikh | 1.2 | 7,402.3 | YES | YES | Dens./Div.-Adap | Diversion | Diversion | |
| Delta | Damietta | 1.4 | 11,852.7 | YES | YES | Dens./Div.-Adap | Diversion | Diversion | |
| Delta | Menufia | 1.0 | 4,759.0 | Dens./ LUM | Expansion | LUM | |||
| Delta | Sharkia | 1.1 | 9,476.0 | Dens./ LUM | Expansion | LUM | |||
| Delta | Alexandria | 1.4 | 12,394.2 | YES | Dens./ LUM/Ad | Expansion | LUM | ||
| Delta | Beheira | 1.6 | 5,806.8 | YES | Dens./ LUM | LUM | Expansion | ||
| Delta | Port Said | 2.2 | 1,624.3 | YES | Dens./ LUM | LUM | LUM | ||
| Desert | Ismailia | 2.3 | 3,372.4 | Dens./ LUM | LUM | LUM | |||
| Valley | Cairo | 3.6 | 13,643.3 | Dens./ LUM | LUM | LUM | |||
| Valley | Giza | 5.8 | 14,914.3 | Dens./ LUM | LUM | LUM | |||
| Valley | Suhag | 6.9 | 5,900.9 | Dens./ LUM | LUM | LUM | |||
| Valley | Qena | 6.9 | 12,450.8 | Dens./ LUM | LUM | LUM | |||
| Valley | Beni-Suef | 8.3 | 14,521.0 | Dens./ LUM | LUM | LUM | |||
| Valley | Aswan | 62.4 | 4,184.4 | Dens./ LUM | LUM | LUM | |||
| Valley | Fayoum | 3.3 | 30,843.8 | LUM | LUM | LUM | |||
| Valley | Luxor | 3.7 | 20,837.4 | LUM | LUM | LUM | |||
| Desert | Suez | 15.2 | 25,392.2 | LUM | LUM | LUM | |||
| Valley | Menia | 15.2 | 18,541.1 | LUM | LUM | LUM | |||
| Valley | Asyout | 16.6 | 18,298.7 | LUM | LUM | LUM | |||
| Desert | Matrouh | 42.5 | 150.4 | LUM | LUM | LUM | |||
| Desert | North Sinai | 46.4 | 1,451.0 | LUM | LUM | LUM | |||
| Desert | South Sinai | 127.5 | 677.0 | LUM | LUM | LUM | |||
| Desert | Wadi Al-Gadid | 1,029.7 | 5,235.3 | LUM | LUM | LUM | |||
| Desert | Red Sea | 1,675.1 | 4,907.0 | LUM | LUM | LUM | |||
Bibliography
Morse, A., & Mosher, S. (2013, 9 30). Debunking the Myth of Overpopulation. Retrieved 5 24, 2016, from Population research institute: https://www.pop.org/content/debunking-myth-overpopulation
Abdel-Nasser, G. (1958, 12 23). Khitab al-Raeis Gamal Abdel-Nasser fi Port Said fi Zikra Youm al-Nasr . Retrieved 08 10, 2016, from President Gamal Abdel Nasser Archive: http://nasser.bibalex.org/Speeches/browser.aspx?SID=695&lang=ar
Boyko, C. (2014, 7 29). Misunderstanding density: why we are building the wrong sort of cities. Retrieved 4 24, 2016, from the guardian: http://www.theguardian.com/housing-network/2014/jul/29/cities-density-building
CAPMAS. (2008). 2006 General Census for Population and Living Conditions, Final Results. CAPMAS.
CAPMAS. (2014). 2012/2013 Household Income, Expenditure and Consumption Survey. V2 Household Characteristics. Cairo: CAPMAS.
CAPMAS. (2016). Egypt in Figures 2016. CAPMAS.
Fecteau, A. (2012). On Toshka New Valley’s mega-failure. Retrieved 3 23, 2016, from Egypt Independent: http://www.egyptindependent.com/news/toshka-new-valleys-mega-failure
GOPP. (1998, 06). Kharitat al-Tanmiya wal-Ta’mir li-Gumhureyat Misr al-‘Arabeya 2017. Retrieved 02 10, 2016
GOPP. (2005). Khitat Tanmiyat Muhafzat al-Qahira wal-Giza wal-Qalubia. Cairo: GOPP.
GOPP. (2008). Istratigiyat al-Tanmiya li-Muhafazat al-Gumhureyya; Iqlim Qanat al-Suways. Cairo: GOPP.
GOPP. (2014, 01). Al-Mukhatat al-Istratigi al-Qawmi lil-Tanmiya al-‘Omraneya. Retrieved 02 10, 2016, from GOPP: http://gopp.gov.eg/plans/
GOPP. (2015). Khara’et al-Faqr li-Iqlim al-Delta. Cairo: GOPP.
GOPP. (2015). Khara’et al-Faqr li-Iqlim al-Iskanderiya. Cairo: GOPP.
GOPP. (2015). Khara’et al-Faqr li-Iqlim Shamal al-Sa’id. Cairo: GOPP.
GOPP. (2015). Khara’et al-Faqr li-Iqlimi Assuit wa Ganub al-Sa’id. Cairo: GOPP.
Hendawy, M. (2015). Connecting Urban Policy Making and Implementation. Case of Maspero, Cairo, Egypt. MSc. IUSD.
Lennard, S. H. (n.d.). The High Density Livability Question. Retrieved 4 24, 2016, from http://www.livablecities.org/articles/high-density-livability-question
Mitchell, T. (2002). Rule of Experts: Egypt, Techno-Politics, Modernity. Berkley CA: University of California Press.
Mitchell, T. (2014). Foreword. In D. Sims, Egypt’s Desert Dreams: Development or Disaster? Cairo: American University in Cairo Press.
MoH. (n.d.). Mashru’a Qura al-Thahir al-Saharawi. Retrieved 02 24, 2013, from Ministry of Housing, Utilities & Urban Development:
MoP. (2016). Istratigeyat al-Tanmiya al-Mustadama Masr 2030 – Thalithan: al-Bu’d al-Be’ei. Retrieved 03 28, 2016, from MoP: http://mop.gov.eg/MOP/SDS_.aspx
Patel, S. B. (2011). Analyzing urban layouts – can high density be achieved with good living conditions? ENVIRONMENT & URBANIZATION -International Institute for Environment and Development (IIED), 23(2), 583–595.
Rageh, A. Z. (2008). Al-Umran Almasri. Cairo.
Sadat, A. (1974). The October Working Paper. Cairo: State Information Service.
Shawkat, Y. (2013). Al-‘Adala Al-Ijtima’eya Wal-‘Omran, Kharitat Misr. Cairo: Shadow Ministry Of Housing.
Shawkat, Y., & Khalil, A. (2016). The Built Environment Budget 2015/16, An Analysis of Spatial Justice in Egypt. Cairo: The Built Environment Observatory.
Sims, D. (2014). Egypt’s Desert Dreams: Development or Disaster. Cairo and New York: The American University in Cairo press.
Sowers, J. (2011). Remapping the Nation Critiquing the State. Environmental narratives and Desert Land Reclamation in Egypt. In D. K. Davis, & E. Burke III, Environmental Imaginaries of the middle East and North Africa (pp. 158-191). Athens: Ohio: Ohio University Press.
ULI-CLC. (2013, 01). 10 Principles for Liveable High Density Cities: Lessons from Singapore. Retrieved 06 15, 2016, from Urban Land Institute & Centre for Liveable Cities: http://uli.org/press-release/10-principles-singapore/
Wahdan, D. (2007, December). Socio-technical Comparison of Unequal Urban Mass-transit Systems in Gurgaon (India) and Sitta October (Egypt). Retrieved from http://www2.unine.ch/repository/default/content/sites/inequality08/files/shared/documents/papers/Wahdan.pdf
Wahdan, D. (2013, April). Planning Egypt’s New Settlements: The Politics of Spatial Inequities. Cairo Papers, 32(1).
World Bank. (2012). Reshaping Egypt’s economic geography : domestic integration as a development platform : Main report. Retrieved 04 26, 2016, from World Bank: http://documents.worldbank.org/curated/en/2012/06/16514619/egypt-arab-republic-reshaping-egypts-economic-geography-domestic-integration-development-platform-vol-1-2-main-report
Notes
[1] For more on the political economy of desert expansion as a solution to overcrowding see (Mitchell, 2002, pp. 212-213), (Mitchell, 2014, p. xix) and (Sowers, 2011).
[2] (World Bank, 2012)
[3] See (Shawkat & Khalil, 2016)
[4] (Sims, 2014, p. 37)
[5] (Abdel-Nasser, 1958)
[6] (Wahdan, 2013)
[7] (Sadat, 1974, p. 77)
[8] (GOPP, 1998, p. 115)
[9] (MoH, n.d.)
[10] (GOPP, 2014)
[11] (MoP, 2016, pp. 188-190)
[12] In the 1950s habitable land mass was around 3 percent of Egypt’s total area, while in 2016 is 4.8 percent (see Figure 8).
[13] (CAPMAS, 2016)
[14] (Sims, 2014, p. 38)
[15] (Fecteau, 2012)
[16] (CAPMAS, 2008)
[17] See next section.
[18] (MoH, n.d.)
[19] “Al-Ashbah taskun qarat al-zahir al-sahrawi bil-mahamid”, Al-Ahram, 19.05.2011 http://www.masress.com/ahram/78864
[20] “Qura al-Minya al-namuzageyya.. buyut ashbah”, al-Masry al-Youm, 13.07.2016 http://www.almasryalyoum.com/news/details/978421
[21] “Al-Muhasbat: Ihdar 500 milion geneih fi al-Zahir al-Sahrawi”, al-Masry al-Youm, 23.03.2015 http://www.almasryalyoum.com/news/details/687309
[22] For many more reports on how these villages are abandoned ghost villages see Arshif al-‘Omran Qura_zahir_sahrawi https://www.diigo.com/user/arshifalomran/%D9%82%D8%B1%D9%89_%D8%B8%D9%87%D9%8A%D8%B1_%D8%B5%D8%AD%D8%B1%D8%A7%D9%88%D9%89
[23] The 2006 Census for Madinet Toshka al-Gadida in Aswan, showed only 2655 people all living in masakin ‘amma (CAPMAS, 2008).
[24] (GOPP, 1998, pp. m-2)
[25] Almost all official remarks on jobs generated by the Toshka project pointed to a ratio of one job opportunity per feddan. For example see (Al-Ahram: http://www.ahram.org.eg/Archive/2005/3/3/FRON3.HTM)
[26] The Minister of Agriculture recently announced a plan to reclaim 200,000 feddans and resettle one million people, meaning a ratio of five people to every feddan, or one typical household Invalid source specified..
[27] (CAPMAS, 2008)
[28] Architecture students were given these planning standards at Cairo University.
[29] (Sims, 2014, p. 111)
[30] For research on the politics behind the failure of Toshka see (Deputy 2011)
[31] (GOPP, 1998, pp. 115-116)
[32] (Shawkat, 2013)
[33] (CAPMAS, 2014)
[34] (Wahdan, 2007)
[35] (Lennard; ULI-CLC, 2013)
[36] ( Morse & Mosher, 2013)
[37] (Patel, 2011)
[38] (Boyko, 2014)
[39] The vice Housing Minister and director at the New Communities Authority (NUCA) claimed that the agency responsible for New Cities has not had to borrow from the National Investment Bank since 2008 (Sada al-Balad. (2015, 09 15). Na’eb wazir al-iskan: Tawaqafna ‘an al-iqtirad min al-istithmar al-qawmi min 2008… wa ‘awaed al-taswiyat 3 milyar genieh. Retrieved 07 21, 2016, from Sada al-Balad: http://www.elbalad.news/1706979), indicating that NUCA is profitable or at least covering its costs.
[40] The General Authority for Reclamation Projects and Agricultural Development (GARPAD), the agency responsible for implementing land reclamation projects in Egypt and selling the land owes EGP 33 Bn in debt to the National Investment Bank, electricity companies and various other government entities (Al-Mal. (2016, 03 19). al-tanmiyya al-zira’eyya tas’a li-isqat 33 milyar genieh madyuneyya mutarakema. Retrieved 07 21, 2016, from Al-Mal: http://www.almalnews.com/Pages/StoryDetails.aspx?ID=275277)
[41] These interventions include:
Land Use Management (LUM): (Re)planning current use of low density or vacant land to accommodate population growth.
Densification: vertical expansion and/or utilisation of vacant housing units
Diversion: New households encouraged to form in other human settlements or governorates.
Expansion: Extending administrative boundaries of a governorate adjacent to desert governorates with surplus vacant land.
[42] There is some official recognition of this threat, for example see (GOPP, 2015, p. 74)