- Published on 05 March 2020
As more and more new housing is built in remote areas, leading residents to rely ever more on transport, the Built Environment Observatory looks at the facts and figures around road safety in Egypt, with a particular focus on pedestrians.
Making Sense of Available Statistics
Accurate figures for road deaths in Egypt are hard to find, as various agencies collect data using significantly different methods, while some data is not collected at all. One CAPMAS report states 5343 deaths in 2016.[1] Another CAPMAS report, also from 2016, states 8211 deaths.[2] Reading into the methodologies, one finds that the former report relies on Ministry of Interior crash reports that mention deaths at the scene, whereas the latter report relies on Ministry of Health data on causes of death collected from local health units that issue death certificates. Using these figures, the World Health Organization (WHO) pushes up the latter estimate to 9287 deaths a year,[3] making up for possible under-reporting. And yet again, using 2016 figures, the World Bank’s statistical analysis pushes the Ministry of Health figure further up to 26,925 deaths a year.[4]
Internationally: Where does Egypt Stand?
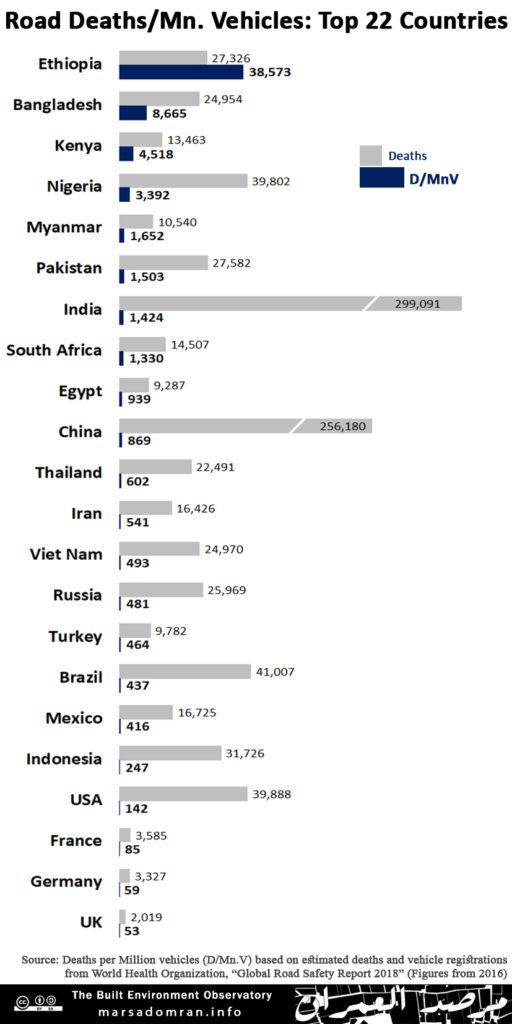
Using the only internationally comparable data, which is from the WHO, it puts Egypt in the 19th position out of the 22 countries with highest number of road deaths, just ahead of France, and just behind Turkey (Figure 1).[5] However, to see this figure in context, researchers usually compare it to number of kilometres driven, and not population, since the incidence of deaths needs to be compared to road use for accuracy. But since this data is not available for most countries, another comparable would be the number of vehicles on the road. In this case, Egypt would jump to 9th worldwide with 939 deaths per million vehicles (D/MnV). This puts it ahead of countries like China, which witnesses an atrocious quarter of a million deaths each year on its roads, but has almost 30 times the number of vehicles that Egypt has. And while South Africa has a similar number of vehicles to Egypt, it sees 50% more road deaths.
Figure 1
Locally: Statistics by Governorate
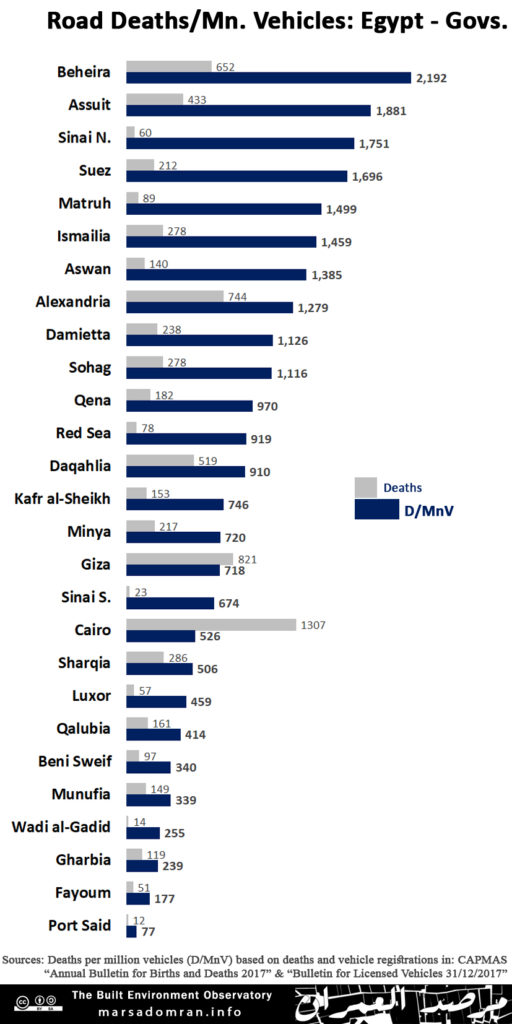
Using the latest local statistics disaggregated by governorate, according to the Ministry of Health, 7370 people were killed on Egypt’s roads in 2017.[6] And while Cairo saw the largest number of deaths (1307), followed by Giza (821), again these numbers need to be put in context. With 2.5mn vehicles on its roads, Cairo had 526 D/MnV putting it in 18th place among Egypt’s 27 governorates (Figure 2). The most dangerous governorate was Beheira with 2192 D/MnV, almost three times the national average of 745, followed by Assiut, North Sinai, Suez, Matruh and Ismailia which were all more than the national average, pitting them against the top five most dangerous countries in the world (Figure 1).
Of course, these figures still need further analysis to present a clear picture as to the nature of the deaths and which type of transport systems need to be addressed, as they represent vehicle crashes on all sorts of roads, from inner city streets, to regional highways.
Figure 2
Road Deaths by type of Road User
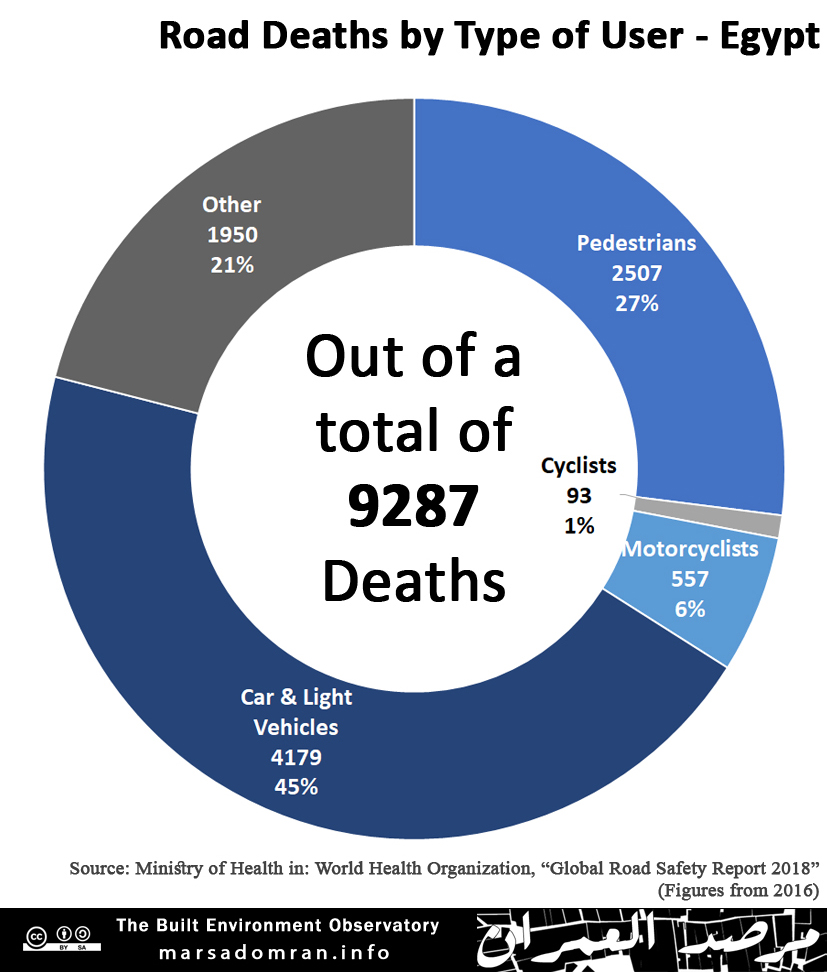
Using Ministry of Health data from 2016, the WHO report estimates that drivers and passengers of vehicles make up almost half of road deaths in Egypt (Figure 3). The second largest fatalities are those of pedestrians, constituting 27% of those killed. It is worth noting that a fifth of deaths have not been properly identified by type (the category ‘other’), and thus the named categories are significantly under-represented.
Figure 3
[1] CAPMAS, “Annual Bulletin of Car and Train Accidents 2016” (Cairo: Central Agency for Public Mobilization and Statistics (CAPMAS), July 2017).
[2] CAPMAS, “Annual Bulletin of Births and Deaths Statistics 2016” (Cairo: Central Agency for Public Mobilization and Statistics (CAPMAS), July 2017).
[3] WHO, “Global Status Report on Road Safety 2018” (World Health Organization, 2018), 138, https://www.who.int/violence_injury_prevention/road_safety_status/2018/en/.
[4] World Bank, “Guide for Road Safety Opportunities and Challenges: Low- and Middle-Income Countries Country Profiles” (Washington D.C.: World Bank, 2019), 167, https://www.worldbank.org/en/news/press-release/2020/02/19/first-road-safety-profile-report-to-help-save-lives-on-the-road.
[5] WHO, “Global Status Report on Road Safety 2018.” All data on deaths and vehicles registrations are from this report. Deaths per Million Vehicles calculated by the BEO.
[6] CAPMAS, “Annual Bulletin of Births and Deaths Statistics 2016,” 171. It is worth noting that these statistics are based on cause of death reports collected nationwide from the Ministry of Health’s local units. Other CAPMAS reports, for example Egypt in Figures, collect data from police reports, which cite deaths at the scene, and are thus lower. The WHO reports on the other hand contain higher figures based on its own methodology factoring in other causes of death related to road crashes.