As part of the BEO’s State of Rent 2017 series, this fact sheet presents a current overview of rental housing in Egypt. It covers primarily New Rent (market rent),[1] while it also includes information on Old Rent (rent control),[2] Furnished Rent (a category based on the now redundant Old Rent law, and very much now part of market rent), and In-kind benefit, which is usually accommodation in housing owned by an employer, whether as a government or company employee (sakan idari, lit. Administrative housing), or a bawab (porter).
Part one shows the scale of rent, as well as its trend over the last three decades. While part two presents costs and affordability by governorate, including time trends, and part three outlines security of tenure.
1 Scale of Rental
1.1 Current Snapshot
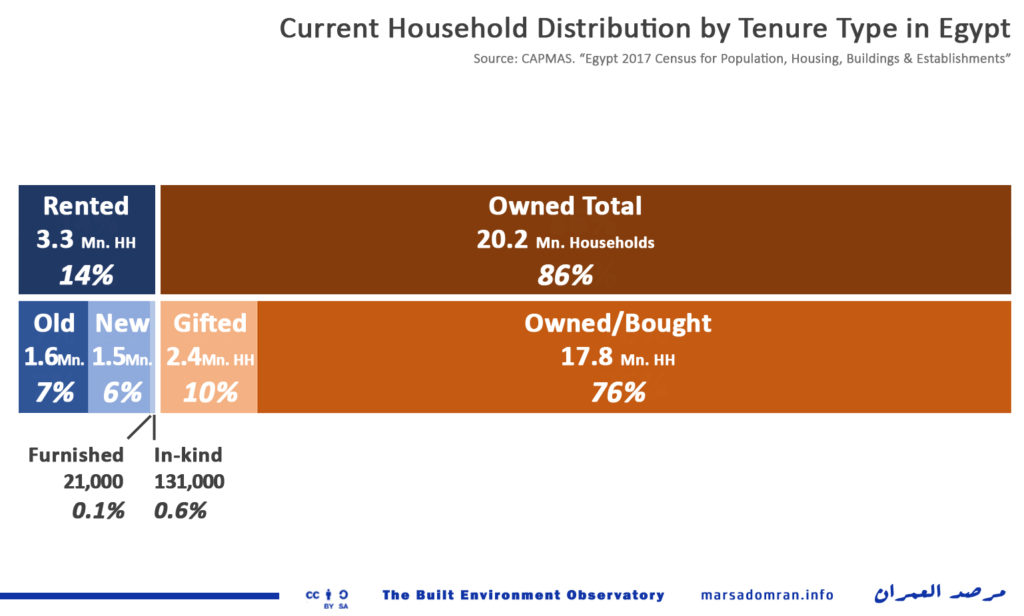
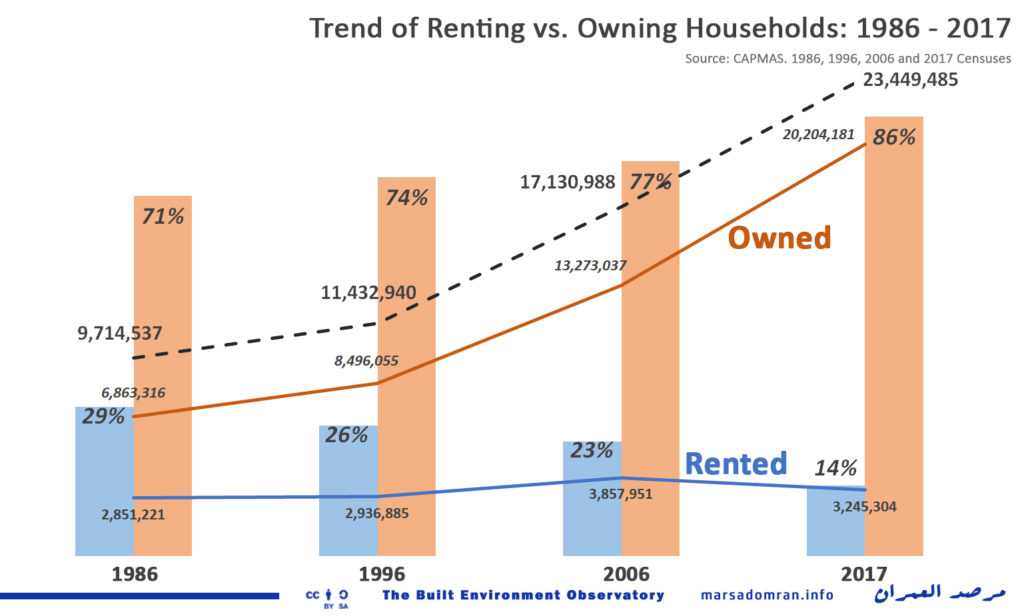
According to the latest 2017 Census, only 3.3 million households were in rented homes, comprising a mere 14% of all households. The rest owned their dwellings (Figure 1). Rent included four forms of tenure identified by the census as non-owners; Old Rent, which was slightly the largest form of rent, housing 1.6 million households; New Rent, the second largest with 1.5 million households, In-kind Benefit, which was 0.6% of households; and finally Furnished Rent, the least popular at only 0.1% of households.
For more on “In-kind Benefit”, see “A Tied Life: The Rise and Fall of Company Town Housing in Egypt”
Ownership on the other hand included only two forms of possession; Owned/Bought (through building, buying or inheritance) with 17.8 million households representing 76% of all households, was the largest form of tenure by far; and Gifted (usually from parents) at 10% of households.
Figure 1
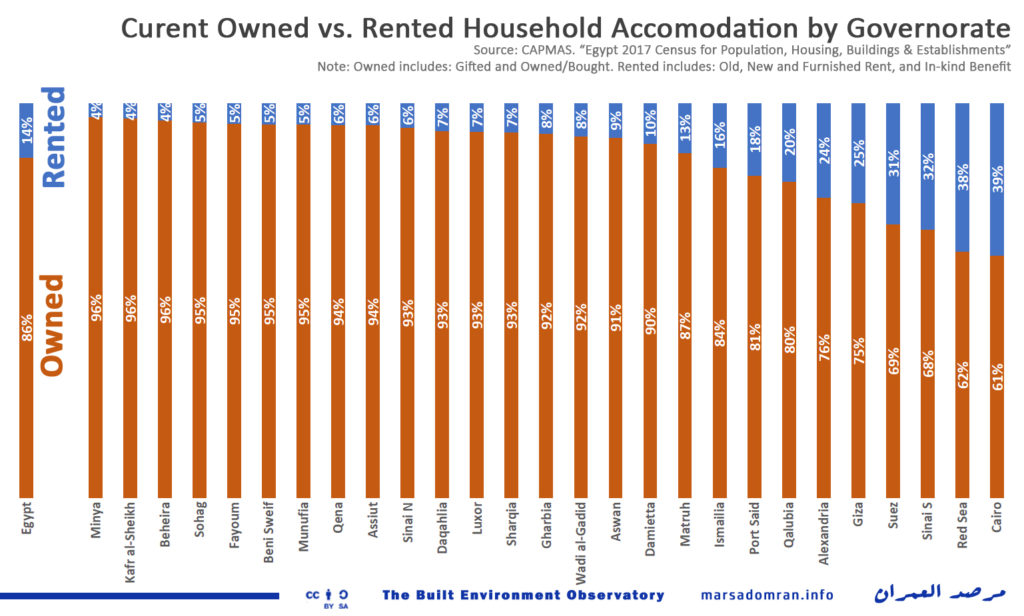
Regionally, it was surprising to see a mix of urban and desert governorates in the top ten, where renting households ranged from a high of 39% in the city-governorate of Cairo, to a low of 13% in the desert governorate of Matruh (Figure 2). The top ten included Greater Cairo region’s other two governorates; Giza and Qalubeyya, as well as Alexandria, Egypt’s second largest city, and the Suez Canal three (Port Said, Ismailia and Suez). But it was surprising to see the tourism-oriented desert governorates of the Red Sea and South Sinai come second and third with 38% and 32% of households renting respectively.
Outside of the top ten, the less urban Upper Egyptian and Delta governorates saw 10% or less of their households renting, where the bottom seven had 5% of households or less renting.
Figure 2
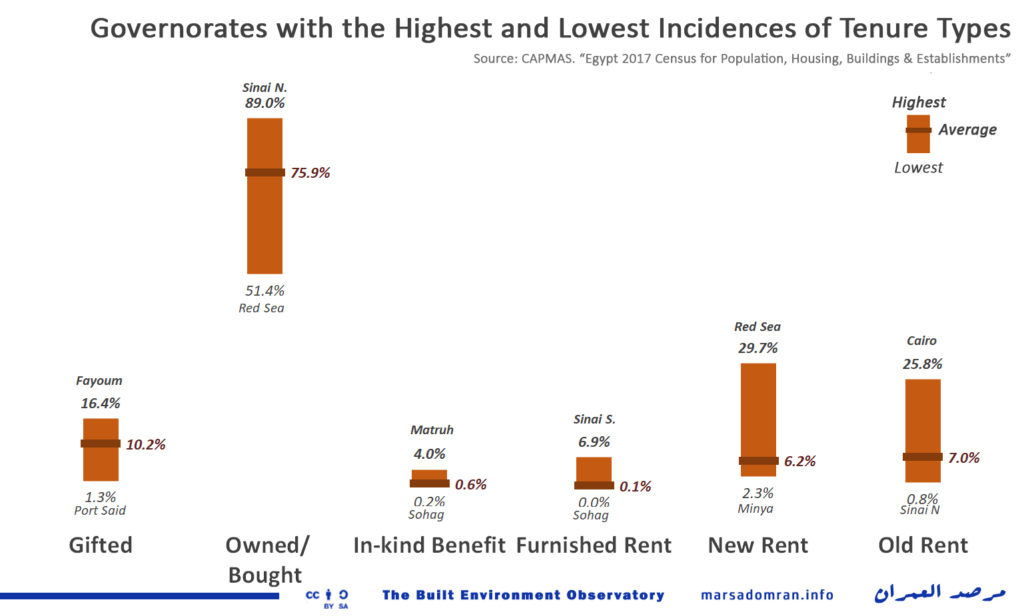
It was also interesting to see the regional variations in the tenure sub-types (Figure 3). Cairo for example had the highest percentage of households living in Old Rent (25.8%), while North Sinai had the least (0.8%). New Rent was highest in the Red Sea governorate with almost one third of households there using it. While it was lowest in the Upper Egyptian governorate of Minya, with less than 3% of households. Even though the national average for Furnished Rent was lest than half of one percent, almost 7% of households in South Sinai used it (most probably clustered in the resort town of Sharm al-Sheikh), as opposed to none in Sohag. In-kind use was highest in Matruh at 4%, and lowest again in Sohag, at 0.2%.
For owned units, North Sinai had the highest percentage of households who Owned/Bought their homes (98%), while in the Red Sea it was only a little more than half of the households. Fayoum saw the highest incidence of Gifted homes (16.4%), while Port Said had the least (1.5%).
Figure 3
1.2 Thirty-year Trend
Both the percentage and the number of renting households is the lowest it has been in the last three decades, dropping from a high of 29% in 1986, to a little less than half that in 2017 (Figure 4). But the worst downward trend was over the last decade, with an incredible 40% drop in share between 2006 and 2017, with almost 610,000 households abandoning renting altogether.
Figure 4
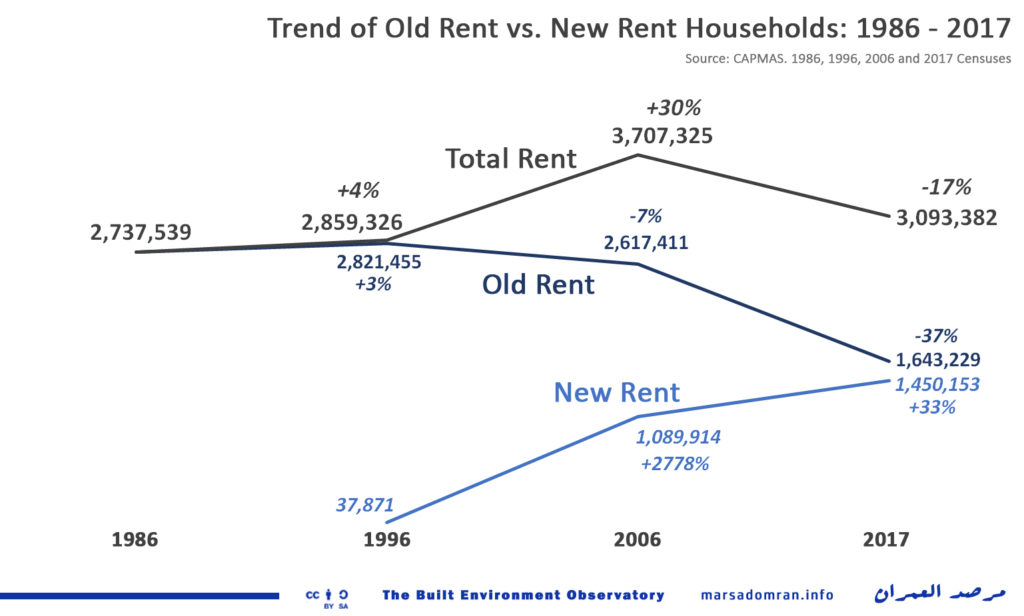
Change in legislation is partly to blame, with the introduction of New Rent (market rent) in lieu of Old Rent (rent control) in 1996. While New Rent enjoyed an initial acceptance adding slightly over a million households in its first decade, it has since slowed down, adding almost one third of that number during this last decade (Figure 5). However, in that same decade Old Rent lost almost one million households, leading to a net loss of renters of 17%. This could partly be explained by the ever-increasing cost of New Rent rendering it prohibitive for low and even middle-income households (More on that in the next section). Either way, these statistics show that the deregulation of rent controlled housing has not led in any way to the growth of market rental. But in fact, the majority has been re-purposed as owned; whether through their use by the original owners, their sale to third parties, or, their demolition and rebuilding as new units for sale, or that are kept vacant.
Figure 5
2 Costs & Affordability
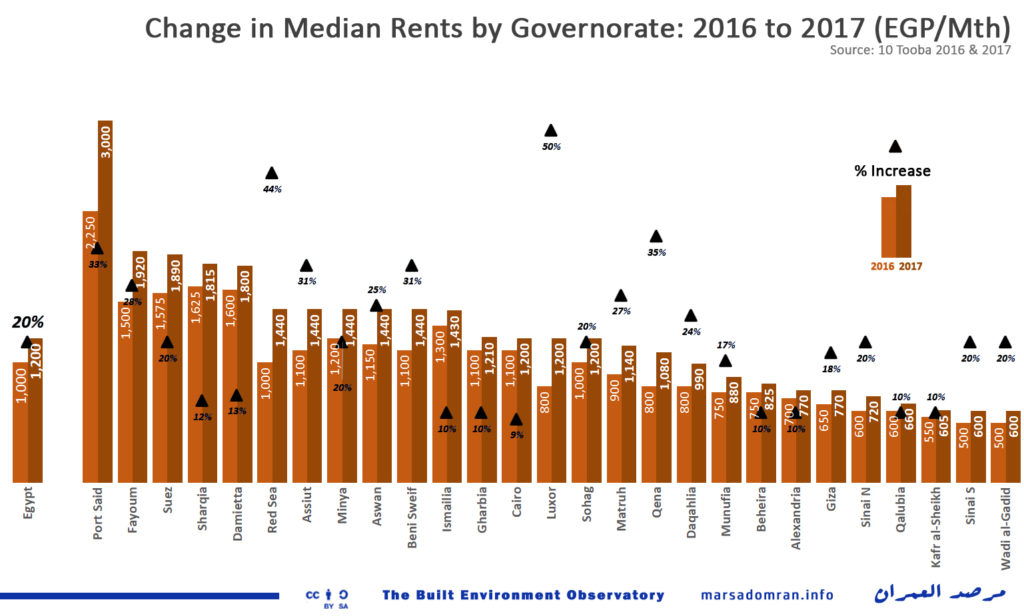
In 2017 the median New Rent in Egypt was EGP 1200, up a phenomenal 20% on the previous year (Figure 6)(See Methodology), though still lower than official inflation which soared to 30% after a back-breaking devaluation of the Egyptian Pound in November 2016, a move that saw it lose more than half its value against the US Dollar.[3] Port Said was the most expensive city at two-and-a-half times the national median and jumping by 33% over the previous year’s value. At the other end of the Scale, the desert cities of Kharga (New Valley) and al-Tor (South Sinai), had the lowest rents, at half the national median. Sohag in Upper Egypt saw the biggest increase of 50% over last year, while Cairo saw the lowest at 9%.
Figure 6
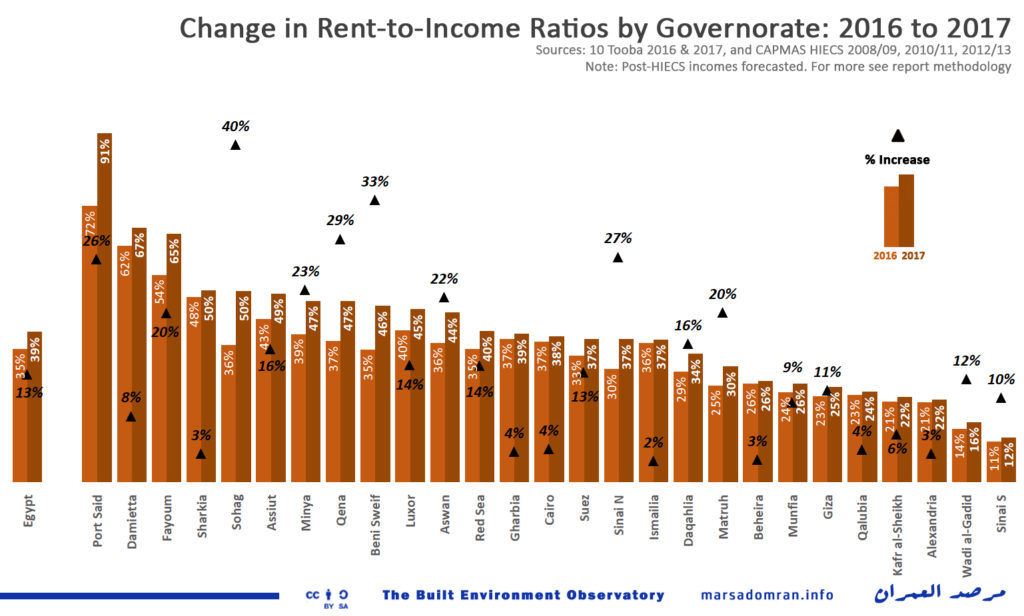
As a result of these increasing rents, affordability took a big hit, where the already high national rent-to-income ratio jumped by 13% (Figure 7). On average, Egyptians now have to spend a full 39% of their income on rent (See Methodology), excluding other housing costs such as utilities and maintenance, which are also rising phenomenally.[4] Again, Port Said was the least affordable city to rent in, where medina rent represented an incredible 91% of median income. In all, people had to spend close to or more than half their income on rent in six cities, all of which were in Upper Egypt or the Delta, with the exception of Port Said. On the other hand, only eight cities were considered affordable where rents were near to or less than 25% of income. They included Egypt’s second biggest city, Alexandria, and Greater Cairo’s two more rural cities of Giza and Shubra al-Khayma (Qalubeyya).
In addition to the high monthly rents, about one third of Egyptians are expected to pay between 25 – 50% of the total contract amount up-front.[5] This is in addition to a deposit, which is at least one month’s rent. In many cases the deposit is not returned at the end of the lease. All of this increases the already high burden of renting.
To see how households have coped with rising New Rents, click here
Figure 7
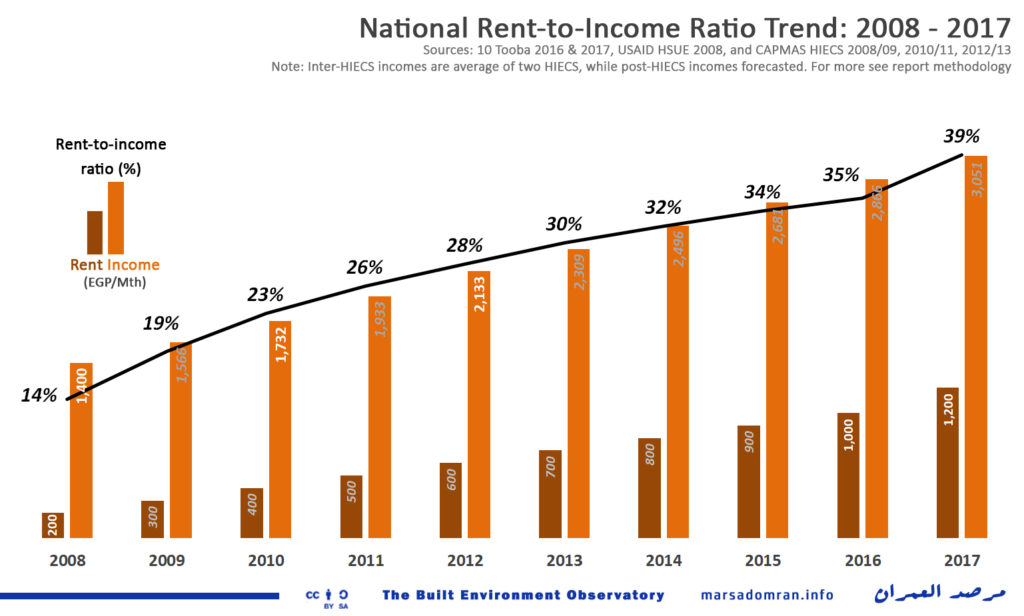
This increase in rents and the erosion of affordability can be traced back over the last nine years, where today’s median rent is a full six times higher than in 2008 (Figure 8). Incomes though have not increased anywhere near that rate, resulting in an almost three-fold decrease in affordability where the national rent-to-income ratio has jumped from 14% in 2008, to 39% in 2017.
Figure 8
3 Tenure Security
In contrast to Old Rent contracts, which have terms equal to the life of the tenant and can be inherited by first degree family members for their lifetime, New Rent contracts are for short, to medium-length durations. The most popular term is between one and three years (41.7%), while contracts between four and five years are second most popular (36.1%), and those over five years accounting for less than a third of contracts.[6]
Old Rent contracts can only be ended after an agreement between the landlord and the tenant and involves the payment of kheliw rigl (key money),[7] or, the condemnation of the building and the need to demolish it. This latter form of eviction has evolved into a phenomenon of its own, where 29% of all building collapses in Egypt were found to be of old, dilapidated buildings, that could have been repaired.[8] Much of this is the result of the lax implementation of the law that requires any damaged building to be repaired, even if the owner cannot afford it or refuses to. On the other hand, many owners cannot afford the repairs dues to the low rents. More ominous though was the collapse of structurally sound buildings due to an internal or external action that violated its structural integrity, leading to 15% of building collapses. Many of these cases are blamed on landlords looking to evict rent controlled buildings.[9]
This may change soon though, as over the last two years the Parliamentary Housing Committee has been discussing the imminent deregulation of Old Rent, though has yet to produce a final draft of the required legislation, nor announce when such a draft would be available.[10]
In New Rent a “break-clause” exists in most standard contracts and usually stipulates the need of one party to inform the other of the wish to end the contract in writing. The length of notice given is left to the parties to the contract to agree.
There is little if any data on security of tenure for tenants, as there are no government or non-government agencies that monitor or regulate rent. While almost all Old Rent contracts are registered, a nation-wide study in 2008 found on New Rent found that only 15.2% had registered or endorsed contracts, out of 94.3% that had written contracts.[11] However, the 6.7% of tenants that do not have a contract equate to about 100,500 households that have precarious tenure. While an untold number of those who do have contracts, have (to their knowledge, or unbeknownst to them) inadequate or illegal contracts that may waive their tenure rights.
So-called istidafa (hosting) contracts, have no legal coverage, and do not stipulate any exchange of money between the parties. They are used widely in thousands of social housing apartments as a loop-hole because owners of are not allowed to rent them out, as legislation restricts the rental or sale of subsidized government housing by beneficiaries.[12] Paying tenants can be evicted at any time, and may end up losing a lot of money, as in practice the value of the entire duration is paid up front.
Illegal evictions are known to happen, as do illegal occupations, whether non-payment of tenants, or their occupation of a unit after the end of the contract. One case of mass eviction by individuals of private tenants was recorded in February 2011, where hundreds, if not thousands of tenants in the Nahda housing estate, north east of Cairo, were evicted by their private landlords during the police vacuum in the wake of the January 2011 revolution, fearing the local government would notice that they were illegally renting out their apartments.[13]
For more detail on “New Rent” contracts click here
…and for “In-kind Benefit”, click here
4 Conclusion: Dying Rent Increases Inadequate Housing
As Old Rent is phasing itself out, while New Rent is not growing quickly enough, renting as an income-based as opposed to wealth-based option for low and middle-income households in Egypt is fast disappearing, as viable option for adequate housing. The current complete deregulation of rent prices has meant that it is increasingly unaffordable. While the deregulation of house prices has meant that owners rely on the appreciation of the value of their property, rather than on rent as a return on investment. Property taxes also remain low and largely under-collected. This has lead to record high vacancy rates, where millions of second and third homes stand empty, and off the rental market.
Another important aspect is the overall lack of confidence in the rule of law in Egypt.[14] This has also meant that owners are ever less inclined to rent out their properties, fearing government inaction to evict non-paying tenants. Or, when they do, higher upfront payments and deposits are demanded, further erdoing the affordability of rent. Landlords also discriminate in favour of family, friends, or foreigners, over strangers, which in turn has led to less accessibility for most.
With house prices even more out of reach, and formal social self-build almost unattainable, more households than at any point in history are forced to live in inadequate shelter that is crowded, unsafe, or lacks proper tenure security, water or sanitation.[15]
5 Methodology
5.1 Scale of Rent
Census statistics have been used, focusing on only on those found in the Census for Population and Living Conditions sections of the 1986, 1996, 2006 and 2017 CAPMAS censuses, as they record housing tenure by households, which is more relevant to this study. Another publication, the CAPMAS Census for Buildings also offers statistics for housing tenure, though by housing units and not households, thus giving a different scale. This latter version has not been used as it partially includes non-residential units in its residential units’ section, while for 2017, dis-aggregated information for either residential or non-residential units is yet to be released.
5.2 Costs
Rent prices for 2016 and for 2017 are for residential New Rent properties in urban Egypt only, and are based on a market survey implemented for 10 Tooba | Applied Research in the Built Environment by statistician Mohamed al-Hadad on the capital cities of all 27 governorates, including both formal and informal neighbourhoods in each city. The surveys were conducted in June of each year to give a mid-year average and involved 616 statistically distributed samples in 2016 and 516 in 2017.
Rent prices for 2008 are based on the USAID Housing Study for Urban Egypt that involved 1420 samples that rented between 2003 and 2008 in settlements designated as urban (cities and towns) in 22 of Egypt’s 27 governorates. The study excluded the frontier or desert governorates of South Sinai, North Sinai, Red Sea, New Valley and Matruh.[16] Therefore the median rent given is an average over five years, and not a definitive figure for 2008 alone.
Overall, these sample sizes are small compared to the size of Egyptian households, however these are the largest available data sets on rent prices in Egypt, and the researchers know of no other available or accessible datasets.
5.3 Income
Data form the CAPMAS Household Income, Expenditure and Consumption Surveys (HIECS) of 2008/2009, 2010/2011 and 2012/2013 has been forecast to establish median income for each of the 27 governorates, and then for the national median income. Datasets are based on 50% of the original CAPMAS dataset (which involve around 20,000 households) and were obtained from the ERF based on a data request.[17] Even though a 2015 HIECS and has been made available, it has not been used in this projection as a change in methodology has given s different range of results that has made it inaccurate to use as a basis for forecasting.
5.3 Affordability
The rent to income ratio (RI) as the “ratio of the median annual rent of a dwelling unit and the median annual household income.”[18] Defining at which ratio rents (or mortgage installments) are affordable, a benchmark based on the maximum accepted proportion of a households’ income spent on housing should be used.[19] This benchmark varies between countries (Table 1). Based on this, we have chosen to use a benchmark of 25% for Egypt where household spending on basics such as food, health and education is high compared to the other countries in the table.
| Country | Housing cost should not exceed (x)% of the households’ income |
| United States[20] | 30% |
| Canada[21] | 30% |
| New Zealand[22] | 25% – 30% |
| India[23] | 40% |
| Egypt[24] | 35% – 40% |
Table 1: Comparison of National Acceptable Rent-to-income Ratios
Acknowledgments
Primary Researcher: Yahia Shawkat
Assistant Researcher: Safaa Yousef
Main Image: Typical “bookshop” contract
Notes
[1] After decades of rent control laws stretching back to 1941, Law 4/1996 was issued to free all new housing from 1996, or that preceding to that but vacated after 1996, from rent control. The law deferred all rental agreements to the Civil Code, Law 131/1948, Articles 558 – 635.
[2] All legal information on Old Rent here is based on the last issue of the law, Law 49/1977 and a major amendment to it, Law 136/1981. Various other laws and legislation exist from the 1940s and apply to buildings and their units depending on the time they were issued.
[3] Jul 2016 to June 2017 Year on year inflation was 29.7%. Central bank of Egypt. “Inflation Historical”. Website, n.d. Accessed 02.02.2018 http://www.cbe.org.eg/en/EconomicResearch/Statistics/Pages/Inflationhistorical.aspx
[4] Last year electricity prices rose by 27% on average, representing 4.7% of household expenses. See: Yahia Shawkat. “Electricity Facts 2017/2018 | Price Hikes Continue”, Built Environment Observatory, 13.11.2017 http://marsadomran.info/en/policy_analysis/2017/11/1266/
[5] USAID. Housing Study for Urban Egypt, p43
[6] USAID. Housing Study for Urban Egypt, 2008. p42
[7] While ruled illegal in the rental law, it is a widely used practice to evict a rent control tenant, where the money they receive amounts to almost half the market value of the flat, and is usually paid upon a sale of a unit to a third party, as they landlord in most cases cannot afford to buy his or her apartment back from the tenant.
[8] Shadowministrofhousing.org, EIPR and TTC. Why do Buildings Collapse in Egypt? 2014. https://egyptbuildingcollapses.org/
[9] See this investigative report on one such case: Rowan el-Shimi, “10 Nabrawy Street, in danger again, points to web of interests behind demolitions”, Mada Masr, 14.07.2016 https://www.diigo.com/cached?url=https%3A%2F%2Fwww.madamasr.com%2Fen%2F2016%2F07%2F14%2Ffeature%2Fculture%2F10-nabrawy-street-in-danger-again-points-to-web-of-interests-behind-demolitions%2F
[10] “Raeis Iskan al-Nuwwab Yukshif ‘an Ta’dilat Qanun al-Igar al-Qadim“, Masrawy, 14.11.2017
[11] USAID. Housing Study for Urban Egypt, 2008. p42
[12] Social Housing Law 33/2014 restricts the resale or rent of units without the prior approval of the Social Housing Fund (art.4).
[13] Amr Abotawila. “Understanding Egyptian Social Housing Squatting Phenomenon Post January 2011: The Production of Space in Elmouhtalla.” Unpublished Master’s Thesis. Ain Shams University and University of Stuttgart. July 2017. p59-62
[14] The World Bank and the World Justice Project have ranked Egypt very low in their Rule of Law indicies (121/193 countries in the former, 110/113 countries in the latter). See: Rule of law – Country Rankings 2015, The World Bank, in: TheGlobalEconomy.com, http://www.theglobaleconomy.com/rankings/wb_ruleoflaw/ and: The World Justice Project. “Egypt, World Justice Report 2017-2018.” http://data.worldjusticeproject.org/#/groups/EGY
[15] About one third of Egyptians live in inadequate shelter. 10 Tooba. “Built Environment Deprivation Index (BEDI)”. September 2016. http://10tooba.org/bedi/en/
[16] USAID. Housing Study for Urban Egypt, 2008. p1-2, and 42
[17] Egypt – Household Income, Expenditure and Consumption Survey, HIECS 2008/2009 OAMDI, 2014. Harmonized Household Income and Expenditure Surveys (HHIES),http://erf.org.eg/data-portal/. Version 2.0 of Licensed Data Files; HIECS 2008/2009 – Central Agency for Public Mobilization and Statistics (CAPMAS). Egypt: Economic Research Forum (ERF).
Egypt – Household Income, Expenditure, and Consumption Survey, HIECS 2010/2011 OAMDI, 2014. Harmonized Household Income and Expenditure Surveys (HHIES).http://erf.org.eg/data-portal/. Version 2.0 of Licensed Data Files; HIECS 2010/2011 – Central Agency for Public Mobilization and Statistics (CAPMAS). Egypt: Economic Research Forum (ERF).
Egypt – Household Income, Expenditure, and Consumption Survey, HIECS 2012/2013 OAMDI, 2014. Harmonized Household Income and Expenditure Surveys (HHIES),http://erf.org.eg/data-portal/. Version 2.0 of Licensed Data Files; HIECS 2012/2013 – Central Agency for Public Mobilization and Statistics (CAPMAS). Egypt: Economic Research Forum (ERF).
[18] UNHABITAT. “Urban Indicators Guidelines, Monitoring the Habitat Agenda and the Millennium Development Goals”. Nairobi, August 2004.
[19] Robinson, M., Scobie, G. M., & Hallinan, B. “Affordability of Housing: Concepts, Measurement and Evidence”, New Zealand Treasury, March 2006.
[20] U.S. Department of Housing and Urban Development, http://portal.hud.gov/hudportal/HUD?src=/program_offices/comm_planning/affordablehousing/
[21] Canada Mortgage; Housing Corporation (28 September 2011)
[22] Robinson, M., Scobie, G. M., & Hallinan, B. “Affordability of Housing: Concepts, Measurement and Evidence”, New Zealand Treasury, March 2006..
[23] Hulchanski, J. D. (1995). The concept of housing affordability: Six contemporary uses of the housing expenditure to-income. Housing Studies: 10(4), p471.
[24] National Bank of Egypt, Central Bank Initiative for Low and Middle-income Mortgages, n.d. http://www.nbe.com.eg/Default.aspx?AID=5&CID=7 Accessed 18.09.2016