- Published on 13 November 2017
The Egyptian government has pushed ahead with increases to the price of electricity for all consumption brackets for the sixth year in a row, without taking into consideration the effect that record inflation rates have had on living costs, particularly for low-income households, during the past year.
This report examines the effects that these increases have had on poor and middle-income households, questioning the justifications given for these price hikes, and concluding with a number of recommendations which would limit the burden on these households, introduce transparency and restructure financial management within the electricity sector.
The income groups referred to in this report are based on data from the Central Agency for Public Mobilization and Statistics (CAPMAS) on monthly electricity consumption by income quintile (Appendix 2).
Major increases on all consumption brackets
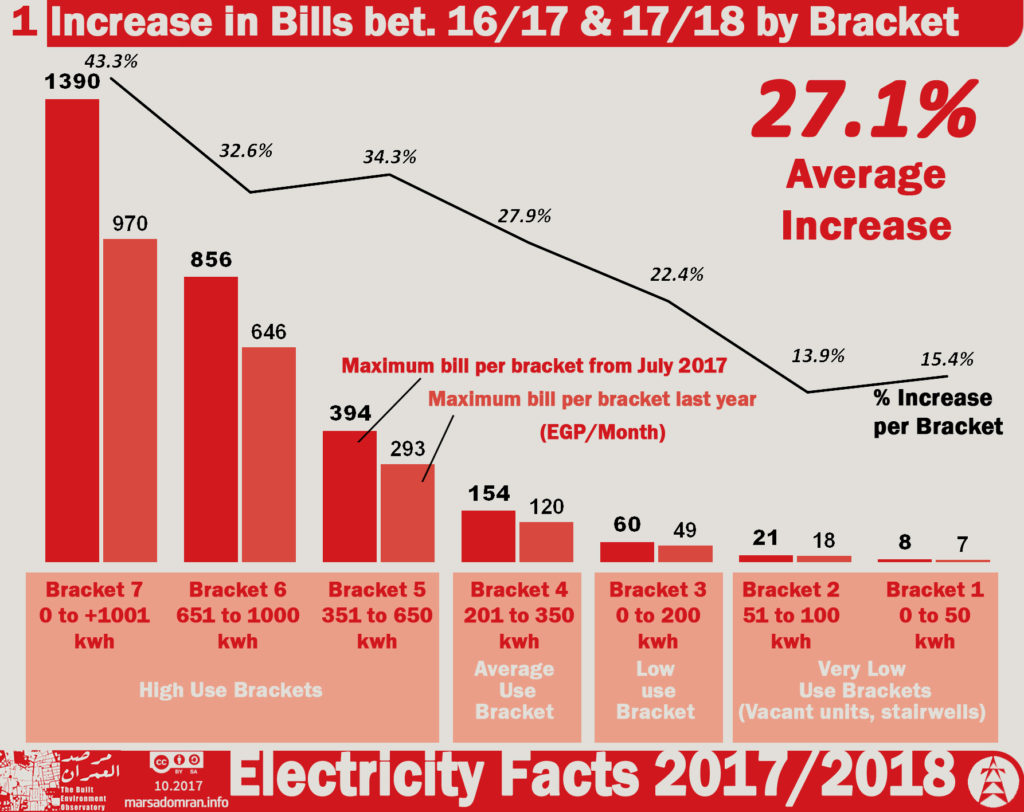
After electricity bills increased by an average of 33% last year (2016/2017), the minister of electricity issued decree 312/2017, which pushed bills up by an average of 27% for the current fiscal year, 2017/2018 (Figure 1). Increases ranged from 15.4% for the first consumption bracket to 43.3% for the seventh, a slight improvement on the previous year, which saw the greater proportion of increases affecting the lowest consumption brackets. The third and fourth brackets, however — corresponding to the extremely-poor and middle-income households — saw major increases, at 22.4% and 27.9% respectively.
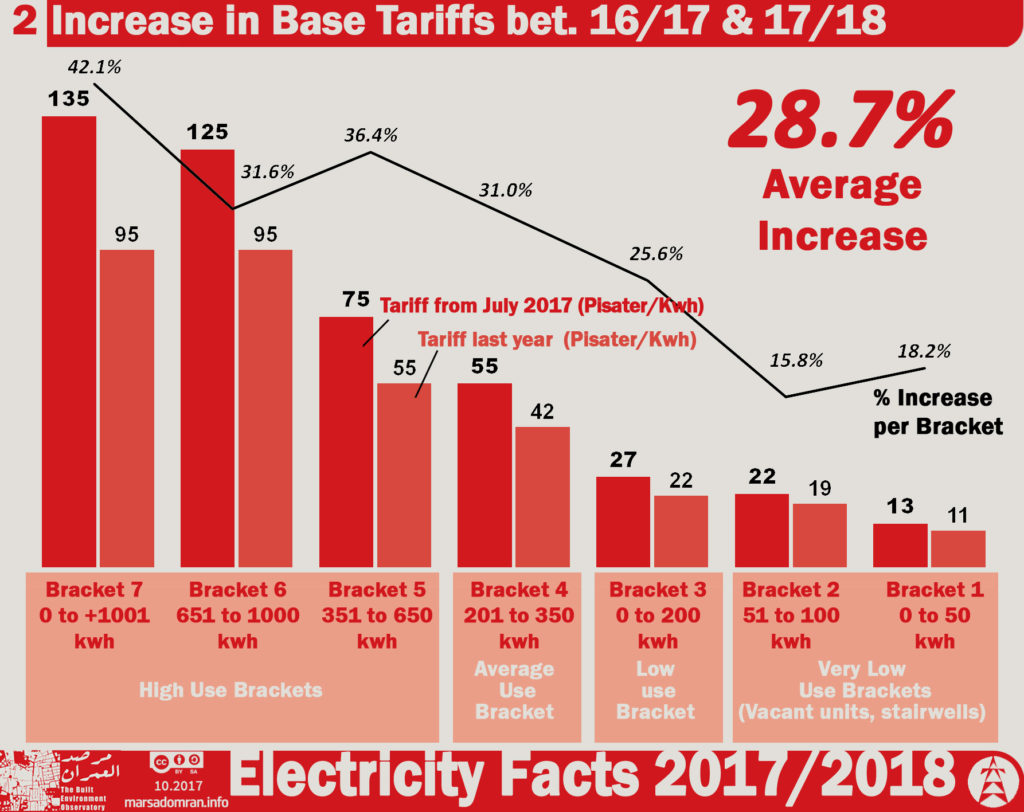
The increase affected two items used to calculate electricity bills: the “electricity consumption tariff” and the “service fee,” an item introduced in 2015. The tariff increased by an average of 28.7% on last year for all consumption brackets, ranging from 18.2% to 42.1% (Figure 2). It should also be noted that the tariff increased by 25.6% and 31% for the extremely-poor and middle-income households (the third and fourth consumption brackets respectively).
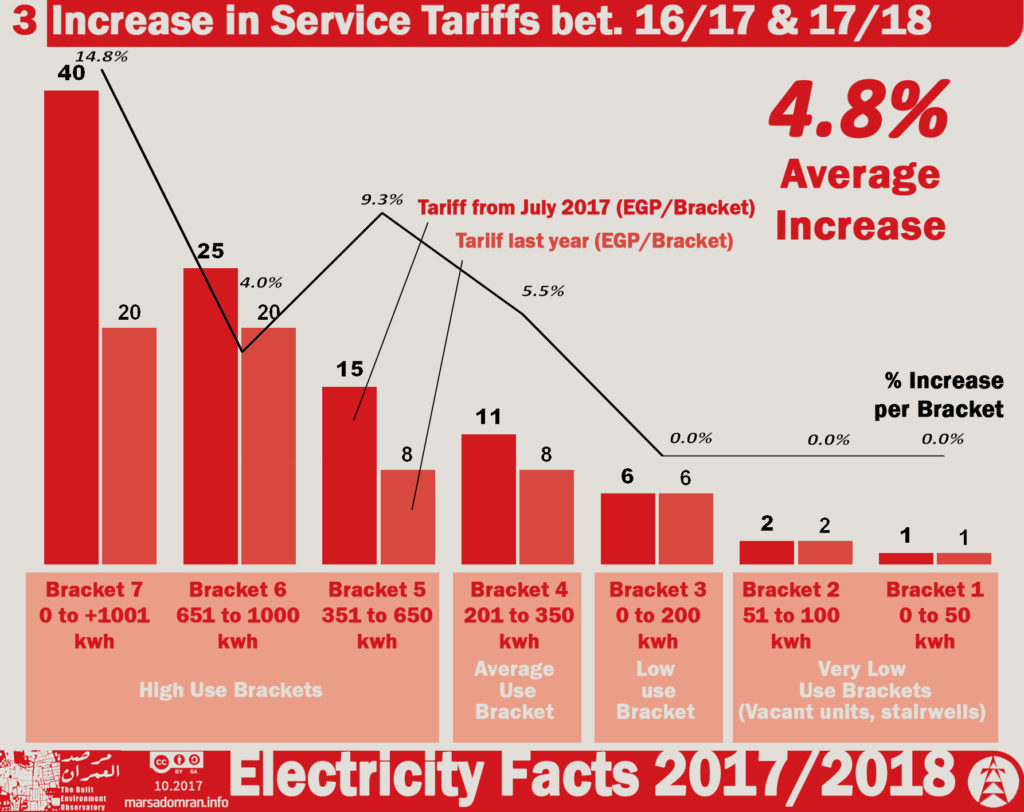
The “service fee” item remained unchanged for the first three consumption brackets, increasing between 5.5% and 14.8% for consumption brackets four to seven (Figure 3). The increases were distributed differently to last year’s increases, which did not affect higher consumption brackets.[1]
Increases in bills were not “negligible” for low- and middle-income households
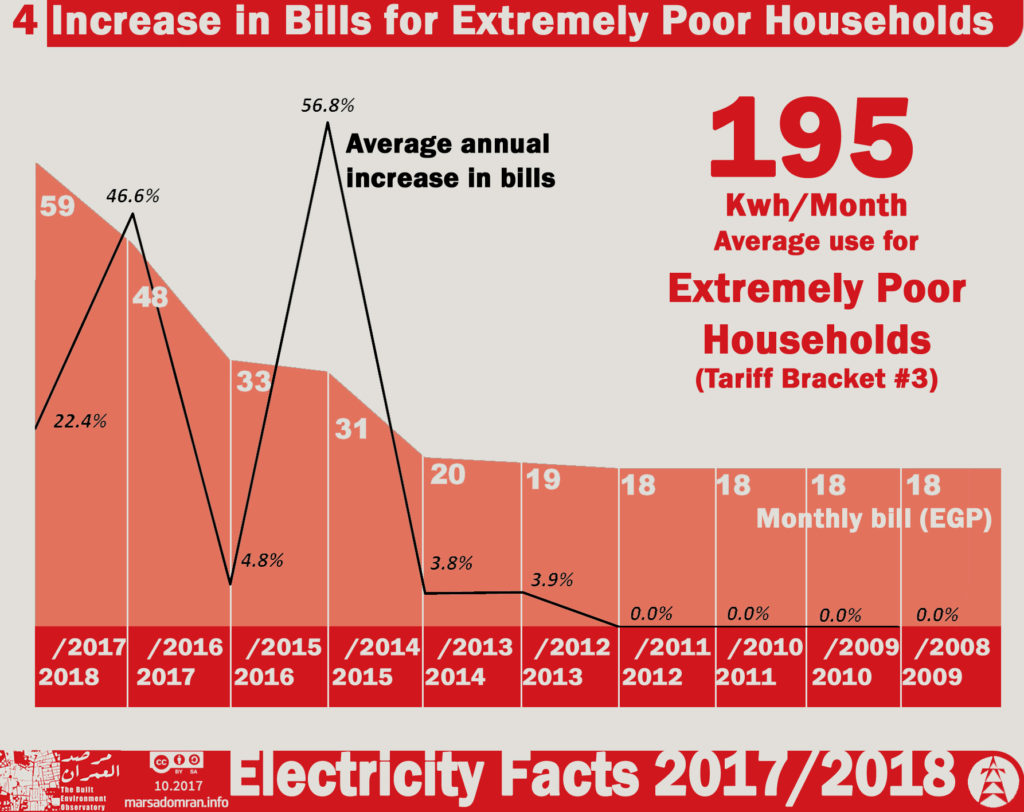
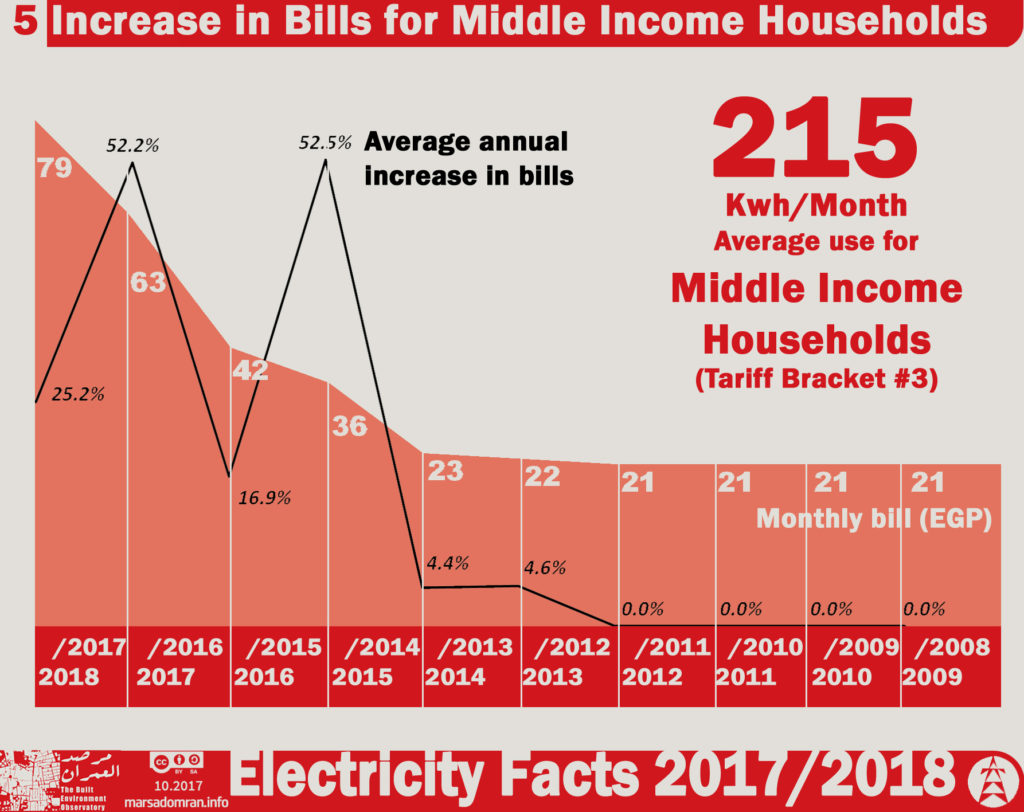
In contrast to statements made by Electricity Minister Mohamed Shaker claiming that increases for low-income households would be “negligible,”[2] bills for the extremely-poor and middle-income households have increased by 22.1% and 25.2% respectively over the last year (Figures 4 and 5). This represents a cumulative increase of 218% and 271% for the two income groups since 2011.
Egypt among states failing to deliver justice in household electricity expenditure
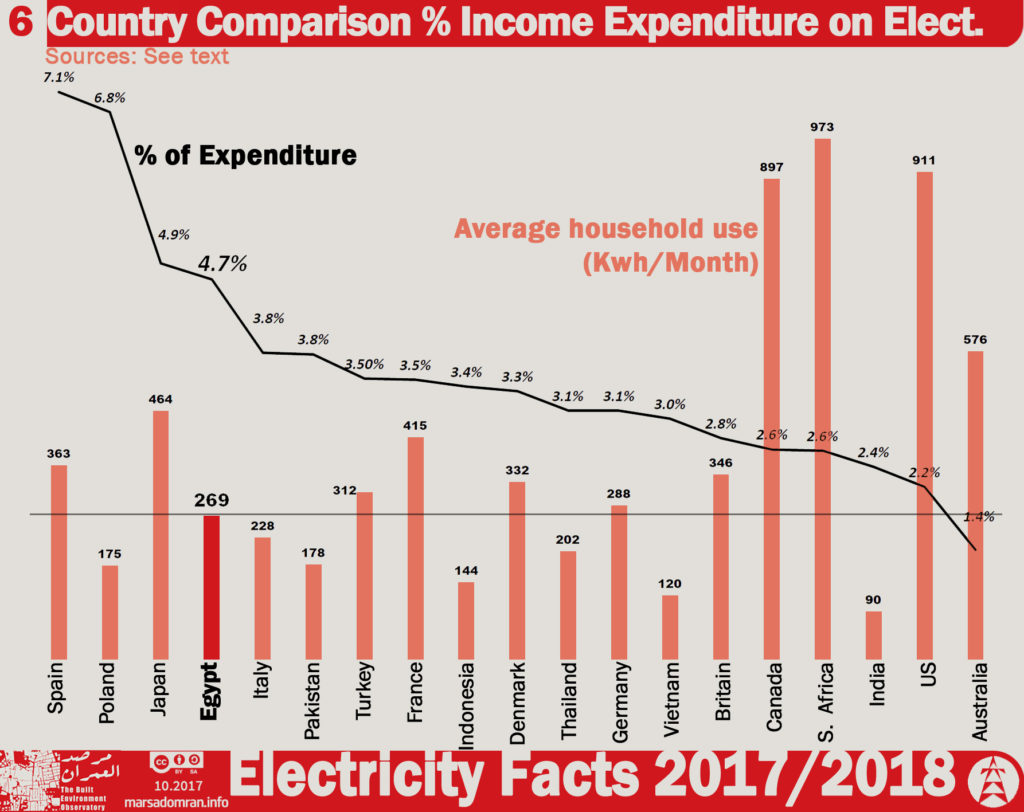
Price hikes have increased the burden of energy costs on Egyptian households, whereby over 4.5% of total household expenditure of extremely-poor and middle-income households went towards electricity, an increase of about 25% on last year.[3] Egypt is now among a number of states failing to deliver justice in household electricity expenditure, with Egyptians now spending twice as much on electricity, as a proportion of monthly expenditure, as households in Australia, the United States, South Africa and Canada, despite the fact that electricity consumption in these countries is two to three and a half times that of Egyptian households (Figure 6).[4]
Subsidies for the rich four times subsidies for the poorest
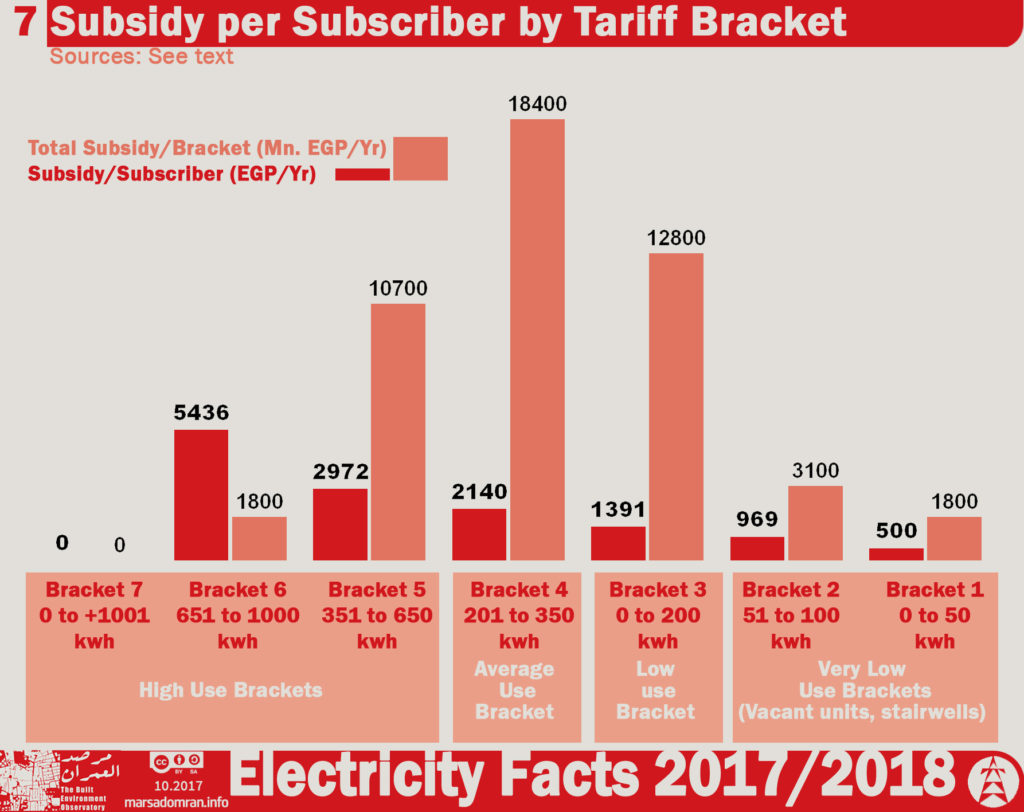
The government allocated LE48.6 billion to subsidize increases in the prices of fuel used to generate electricity for domestic purposes, distributed across the first six consumption brackets, but not the seventh. The subsidies increased gradually across the first four brackets, decreasing for the fifth and sixth brackets.[5] However, calculating the actual subsidy received by each subscriber reveals that the higher the consumption bracket, the higher the subsidy, not the opposite — meaning that a consumer in the sixth bracket receives four times the subsidy received by a consumer in the third bracket, the extremely poor(Figure 7).
Flawed consumption brackets
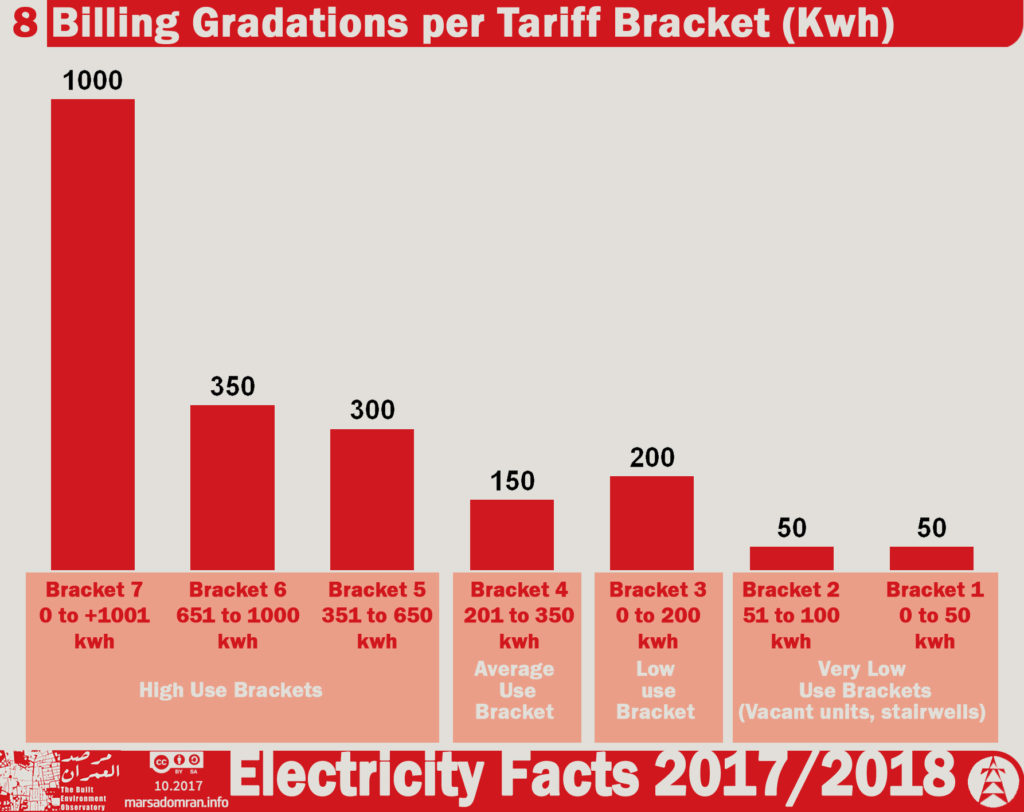
Consumption brackets are defined inconsistently, with the first bracket representing the first 50 kWh consumed per month (Figure 8), and the second representing consumption from 50-100 kWh (i.e. another 50 kWh increment). The third bracket, however, covers all consumption up to 200 kWh, thereby removing progressive charging, whilst the fourth bracket covers consumption of 150 kWh over the 200 kWh limit; this increment is doubled to 300 kWh for the fifth bracket, and increased to 350 kWh for the sixth bracket. The seventh bracket breaks with the principle of progressivity still further, with the 1000 kWh rate applied to the full amount consumed, and not only consumption over this limit. The distribution of consumption brackets can only be described as flawed, given that they neither reward lower consumption nor encourage electricity saving, except for at the highest bracket, and unfairly at that.
Billions in “electricity subsidies” go toward unjustified costs
Billions of pounds accounted for by the government as “electricity subsidies” are actually used for subsidizing unjustified investments in the electricity sector rather than the costs of operating the electric utility Running costs only make up 17% of the total costs of the Egyptian Electricity Holding Company (EEHC), or less than a fifth of what subscribers pay in their monthly bill goes toward electricity services, with two-thirds of the bill going toward construction of new power plants and electricity grids, and the remaining fifth being used to service the company’s debts (Figure 9). [6]
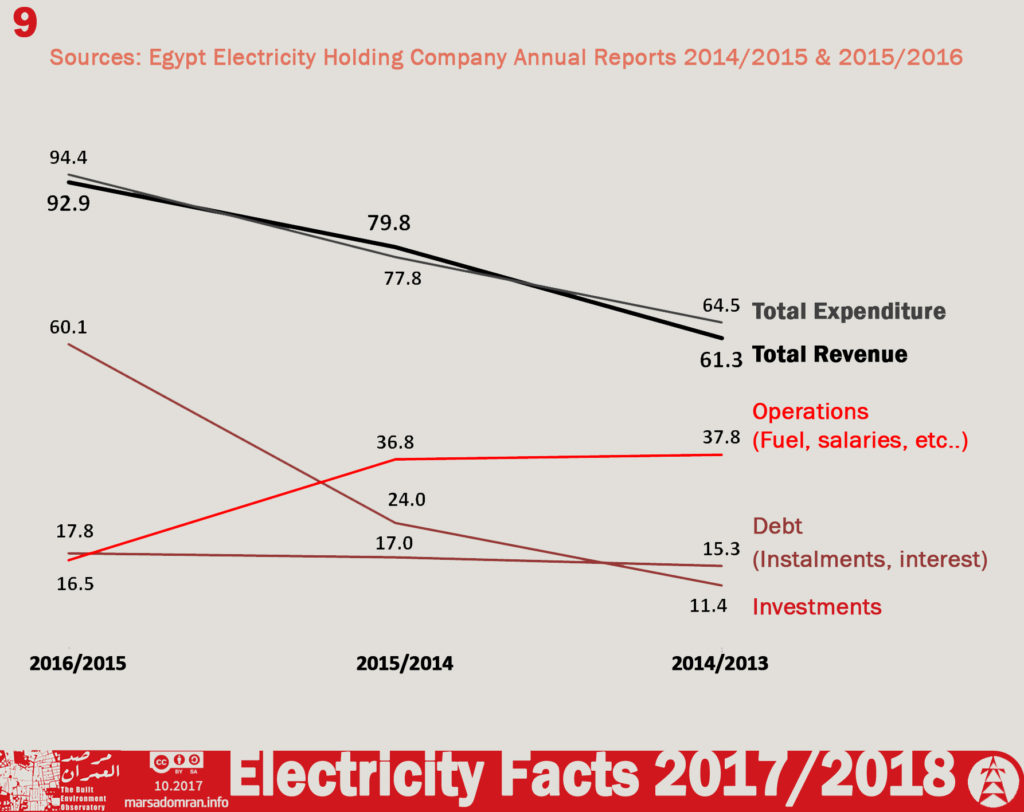
This has not been the case in the past, with operating costs accounting for 59% and 47% of total costs in the 2013/2014 and 2014/2015 fiscal years. The EEHC has forced subscribers to bear the burden of its inflated investment budget — which has increased approximately six fold between 2013/2014 and 2015/2016 — earmarked for building several large plants in order to increase the nominal generating capacity by 80% compared to 2013/2014 levels by the 2017/2018 fiscal year. The justification given was that this would improve the service and avoid having to resort to power cuts to reduce the load on the grid.
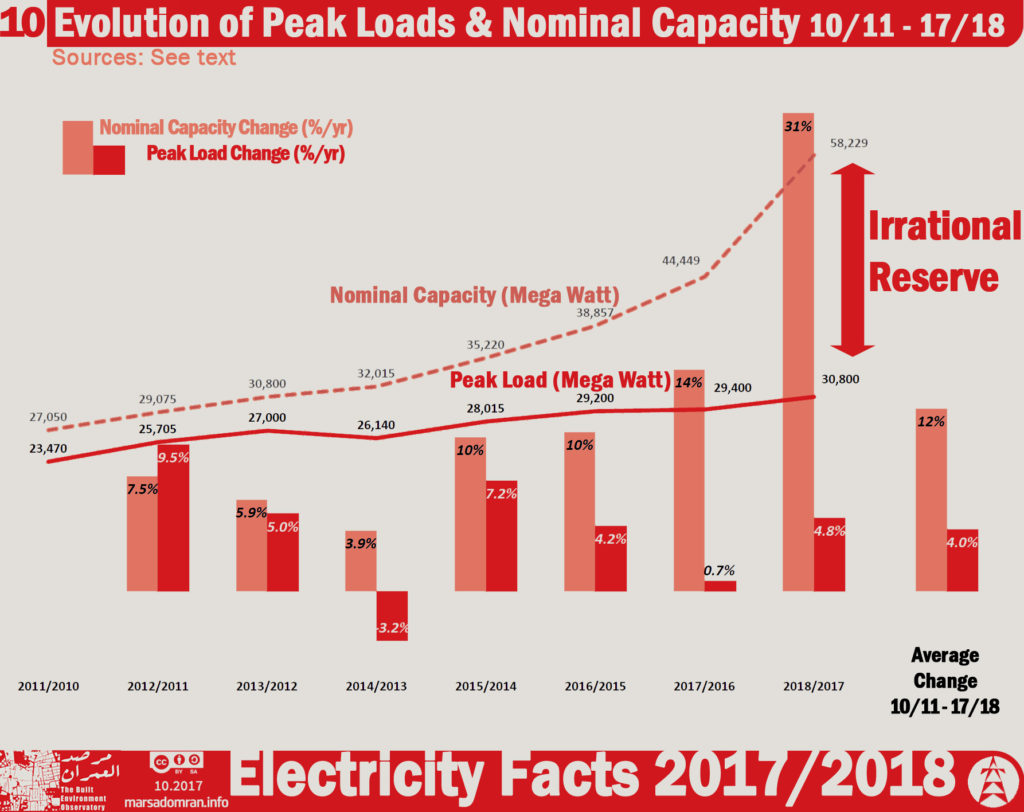
But electricity consumption in Egypt does not justify this increase in production. The peak load on the grid — the main indicator of the amount of electricity required for consumption — has experienced a 4% annual increase over the past seven years (Figure 10). The EEHC, on the other hand, increased the nominal capacity (the maximum rated electrical power output) by 12% annually over this period — three times the increase required for consumption. This increase went toward raising the operating reserve to 89%. The unreasonably high operating reserve is unjustified, as official figures show that the network can operate efficiently with a 14% operating reserve. Moreover, electricity generation shortages — which have resulted in frequent, widespread power cuts over the past few years — were not caused by a compromised generation capacity, but rather by inconsistent fuel availability and grid inefficiency, as the graph shows that the peak load in 2013/2014 decreased by 3.2% compared to the previous year, while the nominal capacity increased that same year by 3.9% compared to the previous year, with the operating reserve reaching approximately 23% (Figure 10).
Inaccurate official data, basic information withheld
The EEHC does not provide an accurate or complete picture of its financial data to subscribers. The most important information in this regard is the cost of operating the electric utility, which subscribers pay as part of monthly electricity bills. According to the minister of electricity, generating costs have reached 95.3 piasters per kWh, whereby the mean sale rate is 50 piasters per kWh[7] with a subsidy of up to 48%. These figures however, are highly implausible. Dividing the EEHC’s revenue by the amount of electricity sold shows that one kWh is sold at approximately LE1 on average[8] — a higher price than the generating cost that the minister used. This revenue has also come despite huge arrears of unpaid electricity bills, especially by government agencies, which amount to LE25 billion.[9]
Delays in the timely release of the EEHC’s annual report means that the latest official data on the electricity sector is currently more than 16 months old.. CAPMAS, the government statistics office, is equally late in releasing its annual Electricity and Energy Report, which in turn is always on the previous year, in this case the 2015/2016 fiscal year.
The Egyptian Electric Utility and Consumer Protection Regulatory Agency (EgyptERA)— which is responsible for providing information to subscirbers and raising awareness — has not properly fullfilledt its duties in this regard on the updated price hikes and how bills are calculated. But more importantly, it has not taken any steps to question the increase in prices paid by subscribers, nor has it clarifiedwhether any measures were taken to limit these increases or substantiate justifications provided by the electricity ministry regarding the increases in tariffs and the how they affect different consumption brackets in order to protect subscribers, especially the extremely poor to middle income households.
Recommendations
Develop a fair, transparent electricity policy
- Improve electricity sector transparency for subscribers
The electricity sector’s transparency must be improved immediately, and subscribers must be provided with detailed data regarding the prices at which they buy electricity:- Provide the Electric Utility and Consumer Protection Regulatory Agency with complete autonomy from the Ministry of Electricity, reinforce its role in protecting subscribers and overseeing the ministry and electricity companies — especially through blocking unjustified increases in the prices of electricity and developing more programs and tools that contribute to educating subscribers about electricity data, particularly those related to costs and pricing.
- Streamline the process by which bills are calculated by removing the “service fee” or incorporating it to the main electricity tariff, improve the efficiency of the meter-reading process, and indicate arrears on electricity bills more clearly.
- Release electricity statistics in a timely manner and make greater efforts to publish detailed and accessible information about electricity costs for subscribers.
- Ease the burden on extremely poor to middle income subscribers
- A minimum amount of energy must be provided for the extremely poor and poor households (in which lie 40% of the poorest households), which is 200 kWh per month for each household, so that these households do not have to spend more than 2.5% of their monthly incomes (between LE30 and LE40) on electricity.
- A reasonable amount of energy must be provided for the middle and upper-middle income households, which is 300 kWh per month for each household annually, so that these households do not have to spend more than 2.5% of their monthly incomes (between LE40 and LE50) on electricity.
- The seven consumption brackets must be redefined in rational increments rather than the current erratic ones — the third bracket should be defined as consumption between 100 and 200 kWh rather than 0 to 200 kWh, and the seventh bracket should be defined as consumption over 1,000 kWh rather than between 0 and 1,000 kWh.
- Devise a program to increase energy efficiency of buildings and appliances
A national program that aims to increase the energy efficiency of buildings and appliances in the following ways must be devised:
- Decrease the power consumed for cooling and heating new buildings by setting carefully considered thermal efficiency requirements for all new residential, administrative and commercial units as specified in the Egyptian Code and Standards of thermal insulation of buildings and stipulating them as a requirement for obtaining building permits.
- Encourage owners of existing residential, administrative and commercial property to improve the thermal efficiency of their buildings through proper insulation as part of a national program to enhance the development of existing units.
- Decrease average electricity consumed by electric appliances through incentivizing the production or import of the more electricity-efficient appliances (following an international electricity consumption efficiency benchmark, such as the EU’s for example) by reducing taxes and customs on these appliances, increasing taxes and customs on less electricity-efficient appliances and imposing additional fees on high consumption appliances such as electric heaters, households appliances and air conditioners (provided that recommendations 3.1 and 3.2 are implemented).
Appendices
Appendix 1: Electricity consumption based on income groups
| Expenditure quintile | Year | 08/09 | 09/10 | 10/11 | 11/12 | 12/13 | 13/14 | 14/15 | 15/16 | 16/17 | 17/18 |
| 0-20% (i.e. lowest expenditure):
Extremely Poor |
Electricity bill (LE) | 18 | 18 | 18 | 18 | 19 | 20 | 31 | 33 | 48 | 59 |
| Yearly increase | 0.0% | 0.0% | 0.0% | 0.0% | 3.9% | 3.8% | 56.8% | 4.8% | 46.6% | 22.4% | |
| Monthly income | 1141 | 1146 | 1150 | 1171 | 1191 | 1200 | 1214 | 1228 | 1241 | 1254 | |
| % of income | 1.6% | 1.6% | 1.6% | 1.6% | 1.6% | 1.7% | 2.6% | 2.7% | 3.9% | 4.7% | |
| 20-40%:
Poor |
Electricity bill (LE) | 21 | 21 | 21 | 21 | 22 | 22 | 34 | 40 | 61 | 77 |
| Yearly increase | 0.0% | 0.0% | 0.0% | 4.4% | 4.2% | 53.6% | 17.4% | 51.5% | 25.0% | ||
| Monthly income | 1391 | 1404 | 1416 | 1435 | 1453 | 1467 | 1483 | 1499 | 1515 | 1531 | |
| % of income | 1.5% | 1.5% | 1.5% | 1.4% | 1.5% | 1.5% | 2.3% | 2.7% | 4.0% | 5.0% | |
| 40-60%: Middle income | Electricity bill (LE) | 21 | 21 | 21 | 21 | 22 | 23 | 36 | 42 | 63 | 79 |
| Yearly increase | 0.0% | 0.0% | 0.0% | 0.0% | 4.6% | 4.4% | 52.5% | 16.9% | 52.2% | 25.2% | |
| Monthly income | 1,543 | 1,540 | 1,538 | 1,577 | 1,616 | 1,626 | 1,648 | 1,668 | 1,689 | 1,709 | |
| % of income | 1.4% | 1.4% | 1.4% | 1.4% | 1.4% | 1.4% | 2.2% | 2.5% | 3.7% | 4.6% | |
| 60-80%: Upper-middle income | Electricity bill (LE) | 24 | 24 | 24 | 24 | 25 | 26 | 39 | 45 | 70 | 88 |
| Yearly increase | 0.0% | 0.0% | 0.0% | 5.0% | 4.8% | 49.6% | 15.3% | 54.0% | 25.7% | ||
| Monthly income | 1723 | 1728 | 1733 | 1785 | 1838 | 1857 | 1890 | 1921 | 1952 | 1983 | |
| % of income | 1.4% | 1.4% | 1.4% | 1.3% | 1.4% | 1.4% | 2.1% | 2.4% | 3.6% | 4.4% | |
| 80-100%: High income | Electricity bill (LE) | 39 | 39 | 39 | 39 | 41 | 44 | 62 | 68 | 109 | 139 |
| Yearly increase | 0.0% | 0.0% | 0.0% | 6.7% | 6.3% | 40.2% | 9.7% | 61.0% | 27.6% | ||
| Monthly income | 2447 | 2563 | 2679 | 2647 | 2615 | 2689 | 2717 | 2753 | 2787 | 2821 | |
| % of income | 1.6% | 1.5% | 1.4% | 1.5% | 1.6% | 1.6% | 2.3% | 2.5% | 3.9% | 4.9% | |
| General mean | Electricity bill (LE) | 25 | 25 | 25 | 25 | 26 | 27 | 40 | 46 | 70 | 88 |
| Yearly increase | 0.0% | 0.0% | 0.0% | 4.9% | 4.7% | 50.5% | 12.8% | 53.0% | 25.2% | ||
| Monthly income | 1649 | 1676 | 1703 | 1723 | 1743 | 1768 | 1790 | 1814 | 1837 | 1860 | |
| % of income | 1.5% | 1.5% | 1.5% | 1.4% | 1.5% | 1.5% | 2.3% | 2.5% | 3.8% | 4.7% | |
| Note 1: Bills for each group were calculated using consumption data from Appendix 2 and consumption bracket prices according to official tariff increases.
Note 2: Quintile expenditure was calculated by taking the mean of every two consecutive deciles. Monthly expenditure was calculated by dividing annual expenditure by 12. Sources: Income: Years 2008, 2010 and 2012: CAPMAS 2013. Main Indicators of the Household Income, Expenditure and Consumption Survey 2012/2013. Table 17, p. 59. The rest of the years: Projection by forecasting. Electricity prices: prime ministerial decrees 1257/2014 and 2259/2015 and minister of electricity decrees 436/2016 and 312/2017. |
|||||||||||
Appendix 2: Electricity consumption by income quintiles
| Spending quintiles | kWh/month |
| Least spending quintile: Lowest income | 195 |
| 2nd Quintile: Low income | 210 |
| 3rd Quintile: Middle income | 215 |
| 4th Quintile: Upper-middle income | 230 |
| 5th Quintile: High income | 324 |
| Source: CAPMAS. Household Income, Expenditure and Consumption Survey 2004/2005
Found in: World Bank 2005. Egypt — Towards a more effective social policy |
|
Appendix 3: Minimum electricity consumed
| Estimated monthly consumption by a low-income household
with basic appliances owned by more than 85% of the population* |
|||||
| Appliance | Electricity consumption (W/h)** | Number of appliances | Hours of operation | Days of the month | Total (kWh/month) |
| Energy-efficient light bulb | 8 | 4 | 6 | 30 | 5.8 |
| Fridge (12 cu. ft.) | 300 | 1 | 12 | 30 | 108.0 |
| Washing machine | 350 | 1 | 0.5 | 30 | 5.3 |
| Television | 200 | 1 | 6 | 30 | 36.0 |
| Fan | 60 | 1 | 4 | 30 | 7.2 |
| Satellite dish/receiver | 30 | 1 | 6 | 30 | 5.4 |
| Blender/mincer | 600 | 1 | 0.5 | 30 | 9.0 |
| Cell phone (charging) | 29 | 1 | 4 | 30 | 3.5 |
| Total | 180.1 | ||||
| Sources:
*CAPMAS 2013. Household Income, Expenditure and Consumption Survey 2012/2013 **Ministry of Electricity website – Services – Consumption calculator http://moee.gov.eg/test_new/calulate_energy.aspx |
|||||
Appendix 4: The percentages of household income spent on electricity in several countries
| Country | Average Household Consumption (kWh/month) | % of Income | Bill (US dollars) | Income (US dollars) |
| Spain | 363 | 7.1% | 111 | 1567 |
| Poland | 175 | 6.8% | 34 | 505 |
| Japan | 464 | 4.9% | 112 | 2280 |
| Egypt | 269 | 4.7% | ||
| Italy | 228 | 3.8% | 70 | 1824 |
| Pakistan | 178 | 3.8% | ||
| Turkey | 312 | 3.5% | ||
| France | 415 | 3.5% | 80 | 2303 |
| Indonesia | 144 | 3.4% | ||
| Denmark | 332 | 3.3% | 131 | 3909 |
| Thailand | 202 | 3.1% | ||
| Germany | 288 | 3.1% | 112 | 3604 |
| Vietnam | 120 | 3.0% | ||
| UK | 346 | 2.8% | 79 | 2871 |
| Canada | 897 | 2.6% | 96 | 3661 |
| South Africa | 973 | 2.6% | ||
| India | 90 | 2.4% | ||
| US | 911 | 2.2% | ||
| Australia | 576 | 1.4% | 62 | 4499 |
| Sources:
What German households pay for power. Clean Energy Wire 16.02.2017 https://www.cleanenergywire.org/factsheets/what-german-households-pay-power Energy Price Reform and Household Welfare: The Case of Turkey, Fan Zhang 2015 https://www.iaee.org/energyjournal/article/2608 Determinants of residential demand for electricity in South Africa, Jessika Bohlmann 2017 https://www.google.de/url?sa=t&rct=j&q=&esrc=s&source=web&cd=1&ved=0ahUKEwj6rbiP8NzWAhVhM5oKHbOxCRcQFggqMAA&url=https%3A%2F%2F2017.essa.org.za%2Ffullpaper%2Fessa_3519.pdf&usg=AOvVaw0vX3Cohd1e4j3qSZIcdQxE Percentage of Household Income Spent on Electricity by State, Electric Choice 28.11.2016 https://www.electricchoice.com/blog/percentage-income-electricity/ Expenditure of Low-Income Households on Energy, World Bank 2010
Income, receipts and expenditure of households in Germany, DESTATIS 2015 https://www.destatis.de/EN/FactsFigures/SocietyState/IncomeConsumptionLivingConditions/IncomeReceiptsExpenditure/Tables/IncomeExpenditure_D.html Family spending in the UK: financial year ending March 2016, ONS https://www.ons.gov.uk/peoplepopulationandcommunity/personalandhouseholdfinances/expenditure/bulletins/familyspendingintheuk/financialyearendingmarch2016#lower-income-households-continued-to-have-less-money-to-spend-on-non-essential-items |
||||
Appendix 5: Percentage change rate in the grid’s peak load and nominal capacity between 2010/2011 and 2017/2018
| 2011/
2010 |
2012/
2011 |
2013/
2012 |
2014/
2013 |
2015/
2014 |
2016/
2015 |
2017/
2016 |
2018/
2017 |
Mean | |
| Nominal capacity (MW) | 27,050 | 29,075 | 30,800 | 32,015 | 35,220 | 38,857 | 44,449 | 58,229 | |
| Peak load (MW) | 23,470 | 25,705 | 27,000 | 26,140 | 28,015 | 29,200 | 29,400 | 30,800 | |
| Change rate in nominal capacity | _ | 7.5% | 5.9% | 3.9% | 10% | 10% | 14% | 31% | 12% |
| Change rate in peak load | _ | 9.5% | 5.0% | -3.2% | 7.2% | 4.2% | 0.7% | 4.8% | 4.0% |
| Difference between peak load and nominal capacity | 15.3% | 13.1% | 14.1% | 22.5% | 25.7% | 33.1% | 51.2% | 89.1% | 35.5% |
| Sources:
Ministry of Electricity and Renewable Energy. The EEHC. The 2015/2016 and 2013/2014 Annual Reports. http://www.moee.gov.eg/test_new/report.aspx
Egyptian Electric Utility and Consumer Protection Regulatory Agency. Electricity Observatory. August 2016 and August 2017 reports. http://egyptera.org/ar/elec_report.aspx
ارتفاع تكلفة الكيلووات إلى 95.3 قرش – الكهرباء تنفذ مشروعات باستثمارات 82.8 مليار جنيه (Electricity price in LE per kWh increases to 95.3 piasters, electricity ministry invests LE82.8 billion in projects), Ahram, 22.06.2017. http://www.ahram.org.eg/NewsQ/600327.aspx |
|||||||||
Notes
[1] Built Environment Observatory. Electricity Facts 2016/2017. 21.02.2017 http://marsadomran.info/policy_analysis/2017/02/689/
[2] “Electricity Minister to Shorouk: New Price Increases are Negligible and will not be Felt by Low-Income Households.” Al-Shorouk. 15/05/2017 (Arabic): http://www.shorouknews.com/news/view.aspx?cdate=15052017&id=96f1d6cb-619d-406f-a809-769a9ef0490a
[3] See Appendix 1
[4] See Appendix 4
[5] “Proposed Increases Released, Electricity Minister To Announce Rates Tomorrow for New Consumption Brackets,” Al-Ahram. 05.07.2017. (Arabic): http://gate.ahram.org.eg/News/1549751.aspx
[6] Data from the 2015/2016 fiscal year (latest available data). The Ministry of Electricity and Renewable Energy. The EEHC. The 2015/2016 Annual Report.
[7] “Electricity prices increase to 95.3 piasters per kWh, Electricity Ministry invests LE82.8 billion in projects,” Al-Ahram. 22.06.2017. (Arabic): http://www.ahram.org.eg/NewsQ/600327.aspx
[8] The average sale price was 69.5 piasters per kWh for the 2015/2016 fiscal year (latest available data). Adding the average increase in tariffs for the past two fiscal years (33% then 27%) puts the price at 107.2 piasters. Source: The Ministry of Electricity and Renewable Energy. The EEHC. The 2015/2016 Annual Report.
[9] “Government agencies owe electric company LE25 billion in unpaid bills, water company debt is greatest,” Al-Ahram. 11.07.2017. (Arabic): http://gate.ahram.org.eg/News/1551492.aspx