- Published on 27 November 2024
Following the Supreme Constitutional Court’s recent judgement overturning some articles of the Old Rent law (rent control) in Egypt, interest in this law has increased and questions about its data have arisen. In this fact sheet we publish 7 statistics on old rent contracts, focusing on residential units rented by households for housing purposes, indicating their number, geographical distribution, historical development of their numbers, and price categories of housing units.
1- What are the types and numbers of old rent units?
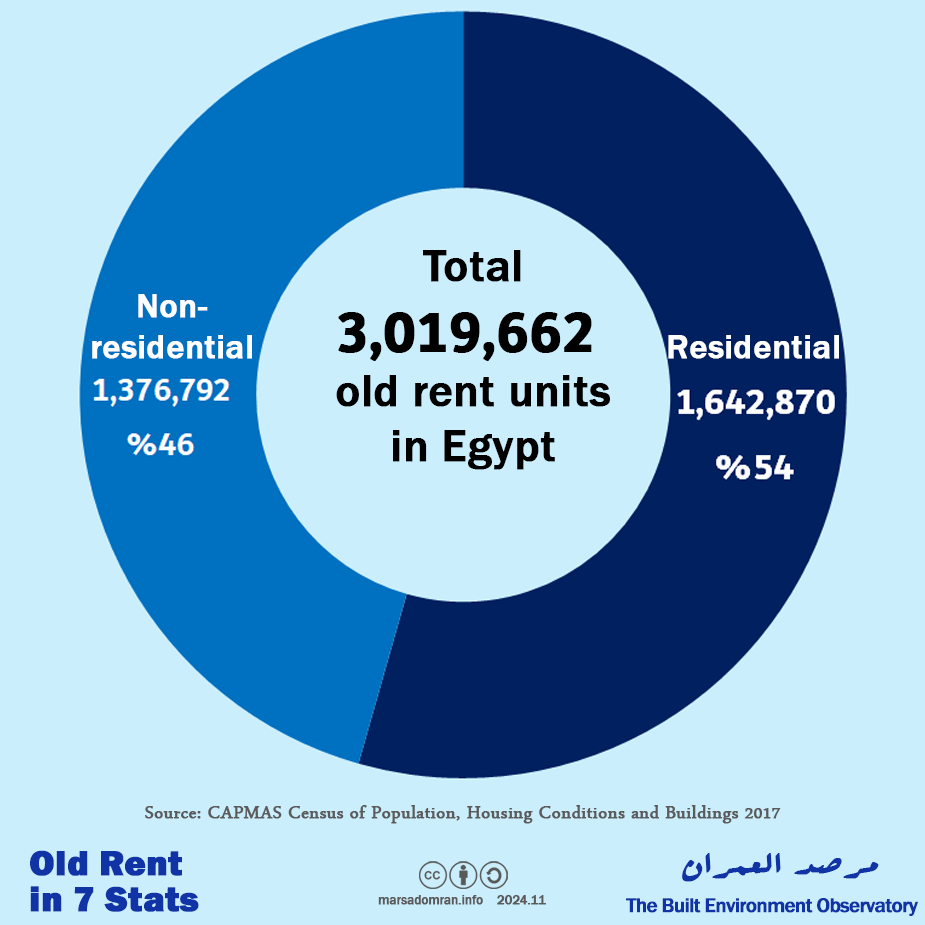
There are 3,019,662 old rent units in Egypt, including apartments, houses, shops and garages, according to the CAPMAS 2017 Census of Population, Housing Conditions and Buildings. More than half, or 1.6 million units, are occupied by households for residential purposes (Figure 1). While 46% of the units were rented out for non-residential purposes, such as: Clinics, administrative offices, government institutions, shops, garages and public housing (incl. hotels, hospitals and shelters).
Figure 1: Distribution of units rented under old rent contracts by use according to the 2017 census (see Appendix 1).
2- How are old rent households distributed across the country’s regions?
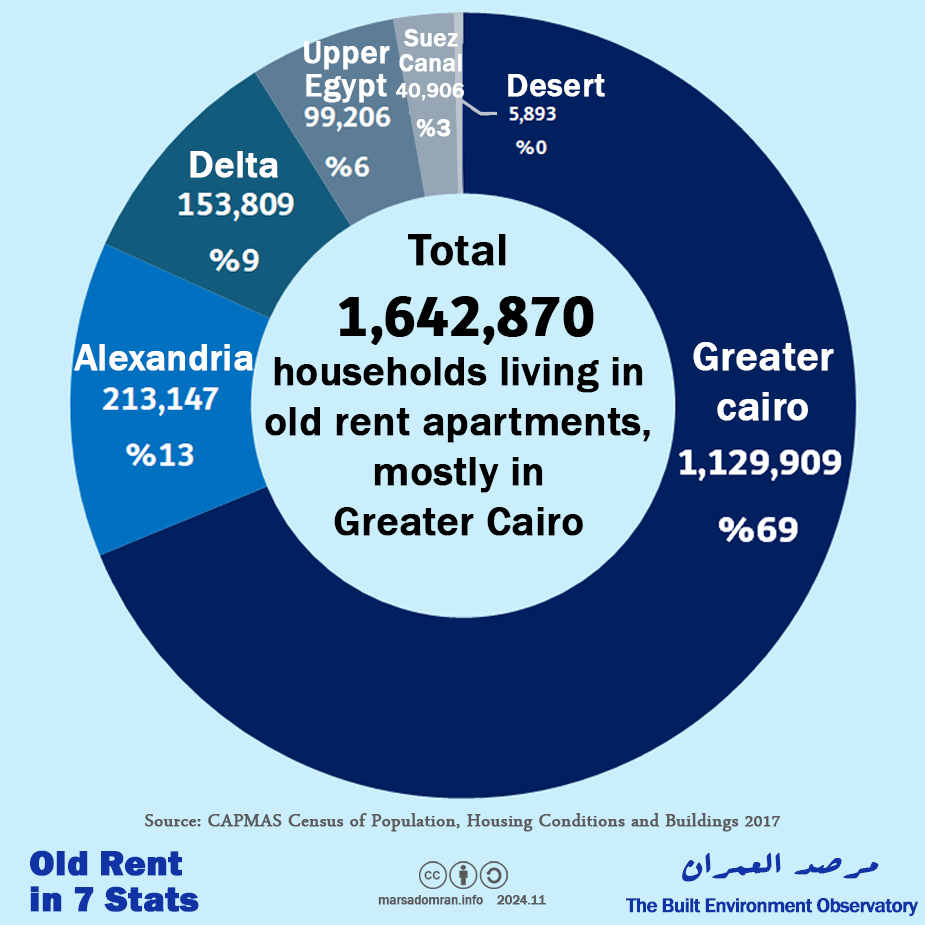
Of the 1.6 million households living in old rent apartments, 1.1 million, or about two-thirds, live in Greater Cairo (Figure 2). The remaining third is distributed among the rest of the regions, with Alexandria accounting for 13 % of old rent households, followed by the Delta region with 9 %, Upper Egypt with 6 %, and the Suez Canal with 3 %. The five desert governorates (Matrouh, New Valley, Red Sea, North and South Sinai) are home to less than 1 % of old rent households.
Figure 2: Distribution of households renting with old rents by regions according to the 2017 census (see Appendix 2)
3- What are the numbers of old rent households at the governorate level?
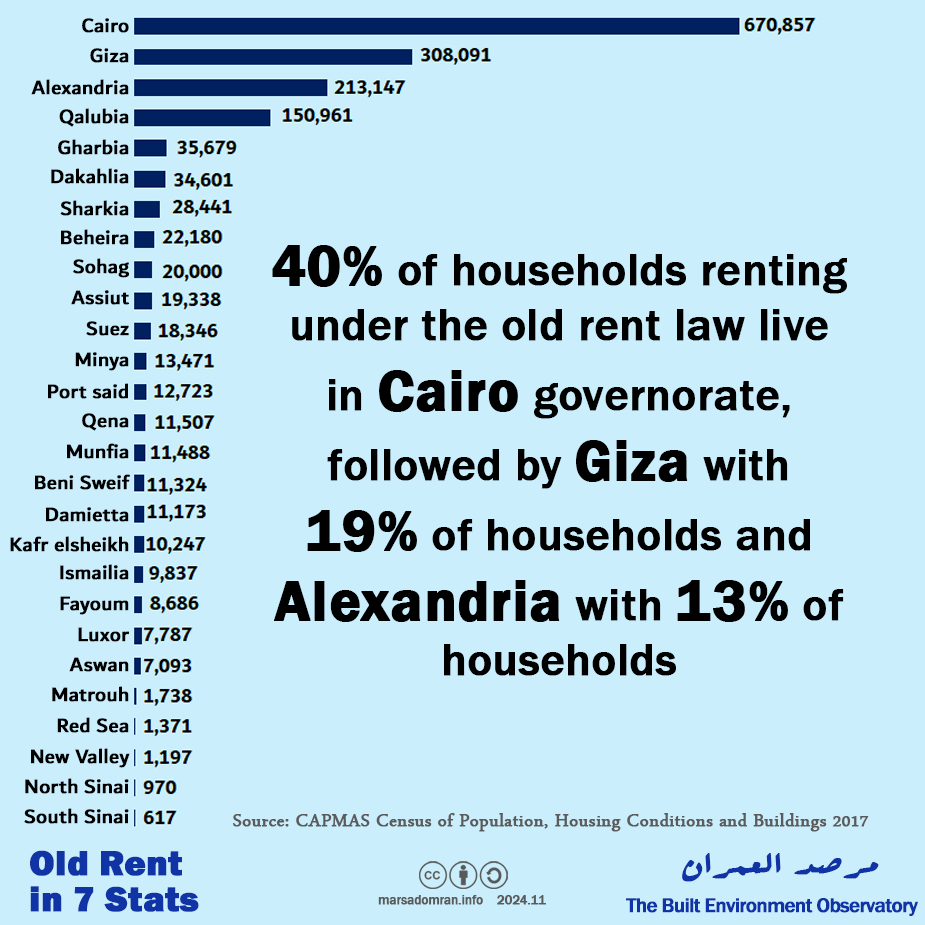
A full two fifths of households renting under the old rent law live in Cairo governorate, representing 670,000 households (Figure 3). This is followed by Giza governorate with 19 % of households (308,000) and Alexandria with 13 % of households (213,000), showing how old rent is an urban phenomenon.
Figure 3: Number of old rent households at the governorate level according to the 2017 census (see Appendix 3)
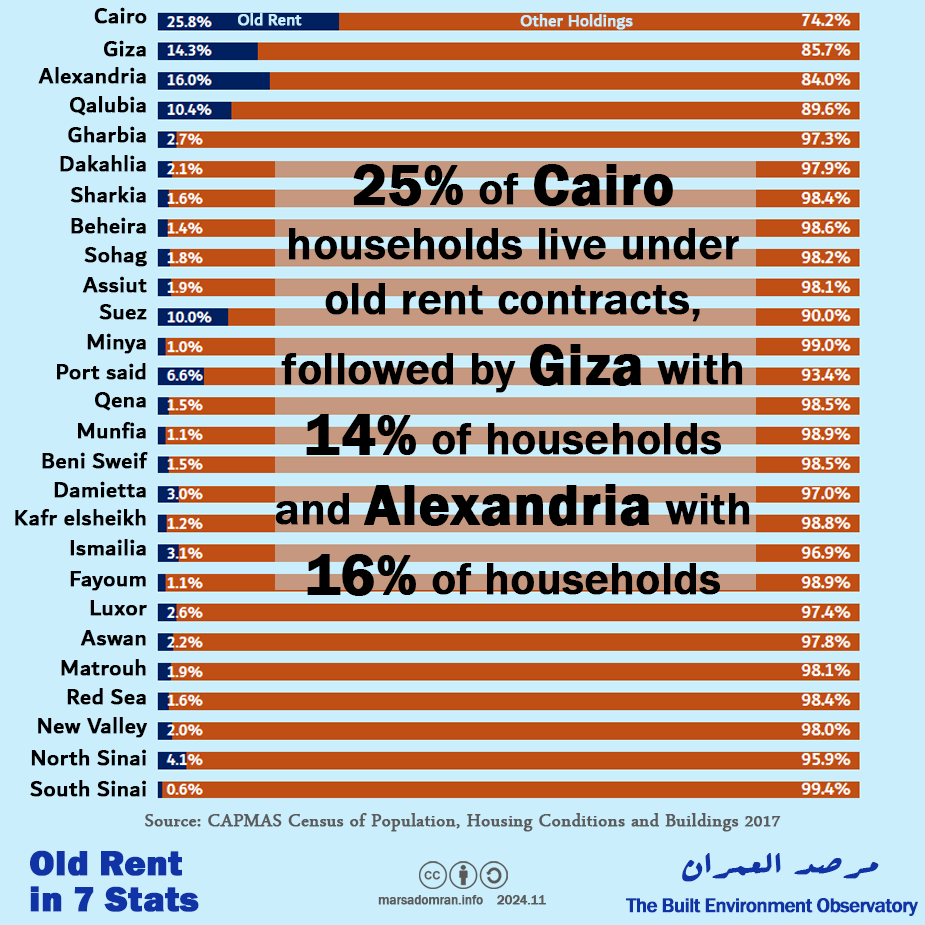
4- What are the proportions of old rent households at the governorate level?
Within Cairo governorate, old rent households represent 25 % of the total households in the governorate, while the rest of the households (75 %) live in new rent (market rent) or own their homes (Figure 4). The proportions of old rent households are also high in Giza (14%), Alexandria (16%), Qalyubia (10%), Suez (10%), and Port Said (7%). The proportions of households renting with old rent contracts compared to the rest of the households in the remaining governorates are low, with an average of 2% of households.
Figure 4: Percentages of old rent households out of the total households in each governorate according to the 2017 census (see Appendix 3)
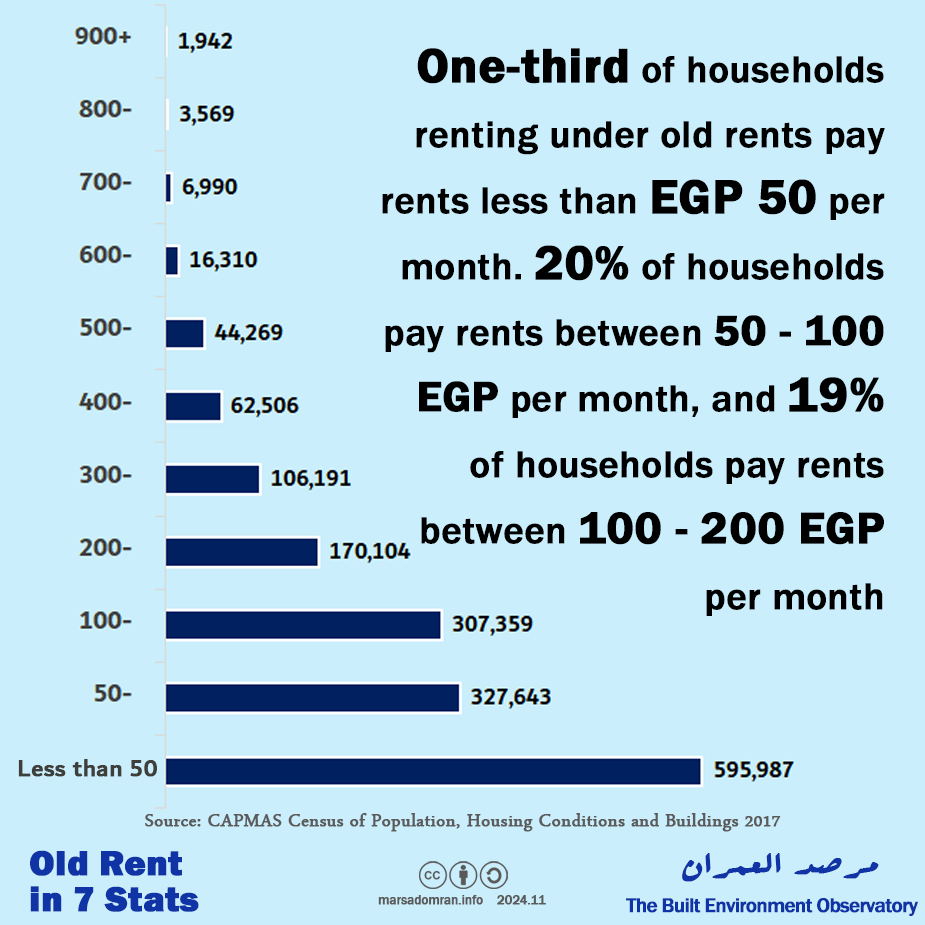
5- What are the values of old rents?
One third of households renting under old rents, or about 600,000 households, pay rents of less than EGP 50 ($1) per month (Figure 5). Twenty percent of households, or 327,000 households, pay rents between EGP 50 and EGP 100 per month. Households whose monthly rents rise to between EGP 100 and EGP 200 represent 19 % of households, or 307,000 households. The remaining third of households pay rents ranging from EGP 200 to more than EGP 900 per month.
Figure 5: Distribution of households by old rent values according to the 2017 census (see Appendix 4)
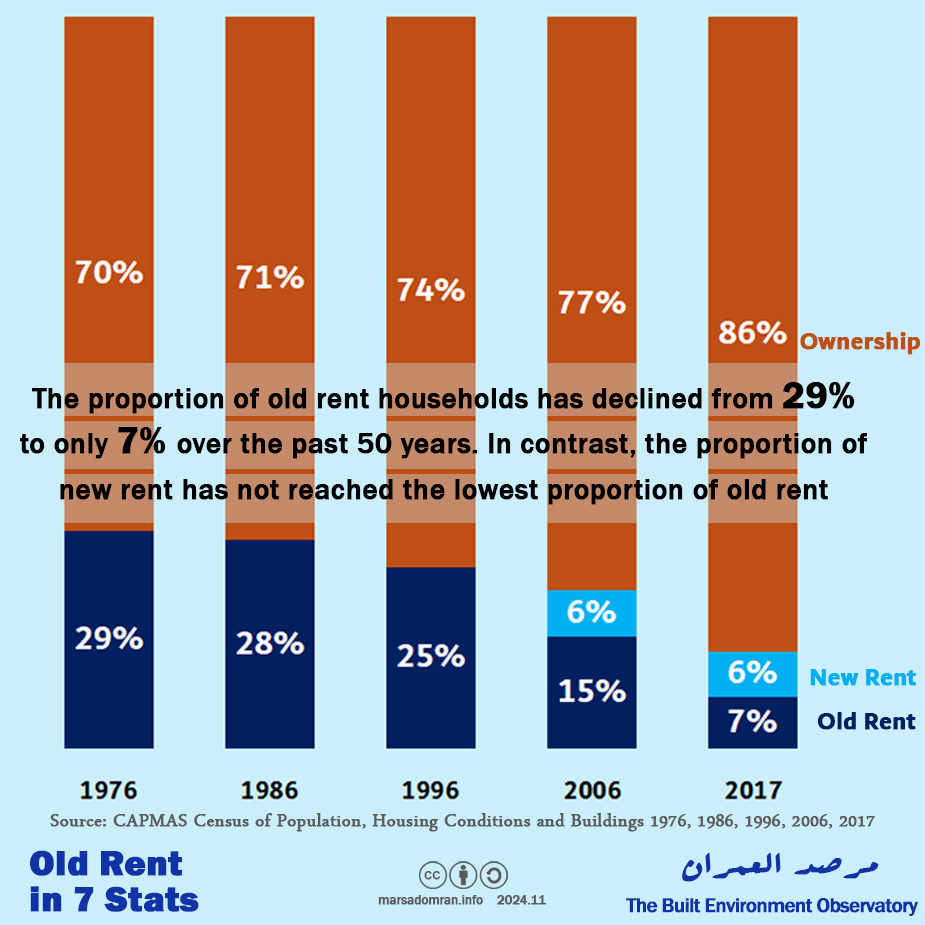
6- How did the proportion of old rent households evolve over the last 50 years?
Old rent households represented 29% of Egypt’s population more than 50 years ago, with the rest owning their own homes (Figure 6). Their percentage remained almost constant in the mid-1980s, before dropping to 25 % of the population in the mid-1990s, showing the expansion of ownership, whether by self-build or purchase, at the expense of renting. In 2006, the proportion of old rent households decreased significantly, showing the impact of the liberalisation of rental contracts with the passage of the New Rent Law in 1996. Those we find in a new category of households in 2006 who represented 6% of households. In the decade between 2006 and 2017, the proportion of old rent households halved to only 7 % of the population as many contracts expired and no new contracts were issued under this system. However, the proportion of new rental households remained constant compared to the previous decade, showing the decline of the rental system in general compared to ownership, through which 86 % of households now live.
Figure 6: Evolution of the proportion of old rent households in total households in Egypt between 1976 and 2017 (see Appendix 5)
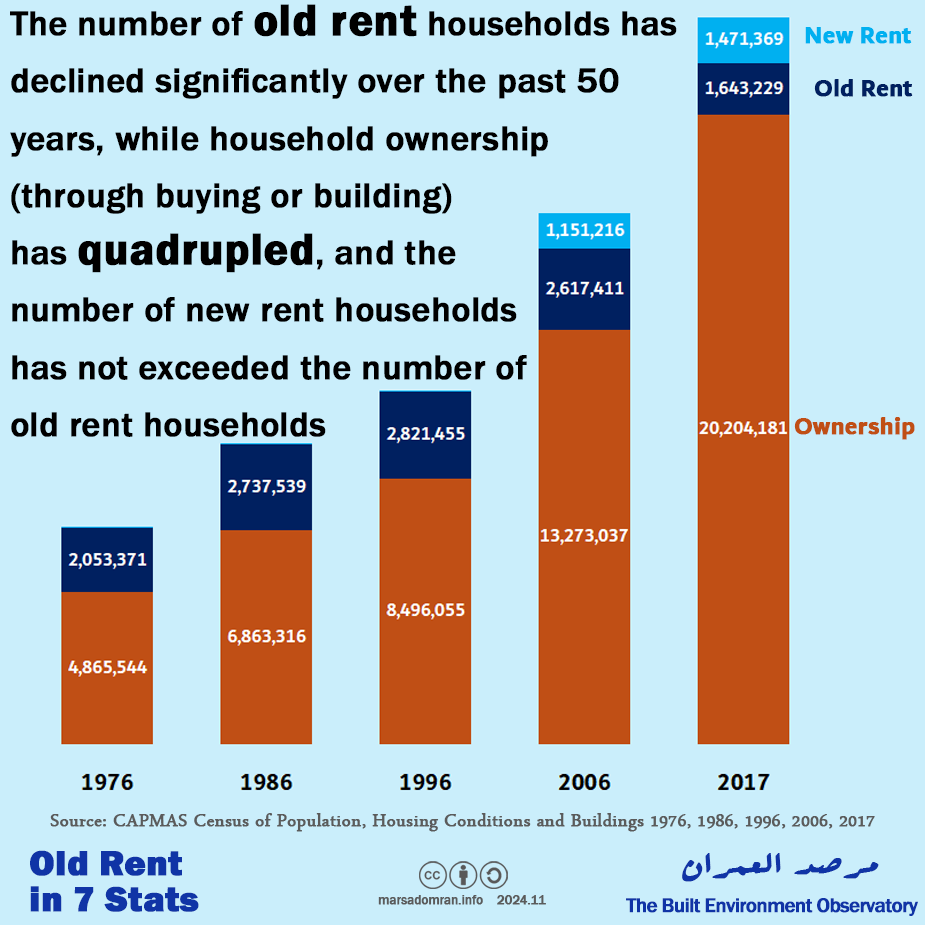
7- How did the number of old rent households evolve over the last 50 years?
The great expansion in home ownership is more evident when we look at the number of households that own their homes and how their number quadrupled in the last 50 years, from 4.9 million households in 1976 to 20.2 million households in 2017 (Figure 7). In contrast, the number of old rent households increased slowly between 1976 and 1996 from 2 million to 2.8 million households, only to decline by 200,000 households in the first decade after the old rent law was passed (1996-2006), and by 1 million households in the following decade (2006-2017), to represent 1.6 million households today.
Figure 7: Evolution of the number of old rent households as a share of total households in Egypt between 1976 and 2017 (see Appendix 5)
Appendices
All information from:
Appendix 1: Units rented under old rent contracts by type and use
| Unit type | *Total Units | **Households | ***Non-residential |
| The entire building | 46,608 | 19,992 | 26,616 |
| Apartment | 2,332,724 | 1,536,072 | 796,652 |
| One or More Rooms | 111,905 | 81,145 | 30,760 |
| One or more floors | 16,216 | 3,749 | 12,467 |
| Public Residence | 320 | 0 | 320 |
| Houseboats | 14 | 2 | 12 |
| Shop | 502,362 | 1,910 | 500,452 |
| Garage | 6,088 | 0 | 6,088 |
| Kiosk | 3,425 | 0 | 3,425 |
| Total | 3,019,662 | 1,642,870 | 1,376,792 |
Sources:
*Central Agency for Public Mobilisation and Statistics (CAPMAS), 2017 Census of Buildings and Units – Table 101
**Central Agency for Public Mobilisation and Statistics (CAPMAS), 2017 Census of Population and Housing Conditions – Table 10
Appendix 2:Regional distribution of residential Old Rent tenants (Households)
| Region | Number of households | Proportion of households per region |
| Greater Cairo | 1,129,909 | 68.80% |
| Alexandria | 213,147 | 13.00% |
| Delta | 153,809 | 9.40% |
| Upper Egypt | 99,206 | 6.00% |
| Suez Canal | 40,906 | 2.50% |
| Desert | 5,893 | 0.40% |
| Total | 1,642,870 | 100.00% |
Sources: See Appendix 3
Appendix 3: Local distribution of residential Old Rent tenants by governorate (Households)
| Region | Governorate | Total number of households | Old Rent | Old Rent Percentage of Total Households |
| Greater Cairo | Cairo | 2,595,977 | 670,857 | 25.80% |
| Greater Cairo | Giza | 2,154,813 | 308,091 | 14.30% |
| Alexandria | Alexandria | 1,331,371 | 213,147 | 16.00% |
| Greater Cairo | Qalubia | 1,447,148 | 150,961 | 10.40% |
| Delta | Gharbia | 1,307,117 | 35,679 | 2.70% |
| Delta | Daqahlia | 1,668,374 | 34,601 | 2.10% |
| Delta | Sharkia | 1,728,093 | 28,441 | 1.60% |
| Delta | Beheira | 1,544,181 | 22,180 | 1.40% |
| Upper Egypt | Sohag | 1,119,424 | 20,000 | 1.80% |
| Upper Egypt | Assiut | 1,001,937 | 19,338 | 1.90% |
| Suez Canal | Suez | 183,962 | 18,346 | 10.00% |
| Upper Egypt | Minya | 1,312,052 | 13,471 | 1.00% |
| Suez Canal | Port said | 191,423 | 12,723 | 6.60% |
| Upper Egypt | Qena | 748,990 | 11,507 | 1.50% |
| Delta | Munofia | 1,046,632 | 11,488 | 1.10% |
| Upper Egypt | Beni Sweif | 739,061 | 11,324 | 1.50% |
| Delta | Damietta | 378,219 | 11,173 | 3.00% |
| Delta | Kafr Al-sheikh | 829,737 | 10,247 | 1.20% |
| Suez Canal | Ismailia | 321,708 | 9,837 | 3.10% |
| Upper Egypt | Fayoum | 821,722 | 8,686 | 1.10% |
| Upper Egypt | Luxor | 295,602 | 7,787 | 2.60% |
| Upper Egypt | Aswan | 329,386 | 7,093 | 2.20% |
| Desert | Matrouh | 90,017 | 1,738 | 1.90% |
| Desert | Red Sea | 87,620 | 1,371 | 1.60% |
| Desert | New Valley | 58,591 | 1,197 | 2.00% |
| Desert | South Sinai | 23,868 | 970 | 4.10% |
| Desert | North Sinai | 98,054 | 617 | 0.60% |
| Total | 23,455,079 | 1,642,870 | 7.00% |
Source: Central Agency for Public Mobilisation and Statistics (CAPMAS), 2017 Census of Population and Housing Conditions – Table 3
Appendix 4: Grouping of residential Old Rent tenants by rent value (LE)
| Price range | Households | Percentage |
| Less than 50 | 595,987 | 36% |
| 50- | 327,643 | 20% |
| 100- | 307,359 | 19% |
| 200- | 170,104 | 10% |
| 300- | 106,191 | 6% |
| 400- | 62,506 | 4% |
| 500- | 44,269 | 3% |
| 600- | 16,310 | 1% |
| 700- | 6,990 | 0% |
| 800- | 3,569 | 0% |
| 900+ | 1,942 | 0% |
| Total | 1,642,870 | 100% |
Source: Central Agency for Public Mobilisation and Statistics (CAPMAS), 2017 Census of Population and Housing Conditions – Table 11
Aknowledgements
Written by: Yahia Shawkat
Infographs: Dina Elmazzahi