- Published on 18 November 2016
*This section is part of BE Budget 2015/2016
Total Sub-national Spending on Water
Public spending on drinking water treatment stations and networks totalled 5.3 Bn EGP. This translates to a total per capita share of 58 EGP per person (Table 18).
Table 18: Total and per capita expenditure on water by administration
| Existing BE | New Cities | Total | |
| Investments (EGP) | 2,671,717,000 | 2,591,087,000 | 5,262,804,000 |
| 50.8% | 49.2% | 100% | |
| Per Capita (EGP/pax) | 30 | 1352 | 58 |
Per capita spending in the Frontier governorates was highest, ranging from a low of 64 EGP per person in North Sinai (just above average) to a national high of 1397 in Matruh, (about 24 times the national average) (fig. 17). Spending in the Greater Cairo region was all just above average and mostly below or even well below average for all the other regions. Some exceptions to this are Sharkia and Damietta in the Delta, Ismailia in the Canal zone, and Sohag in Upper Egypt.
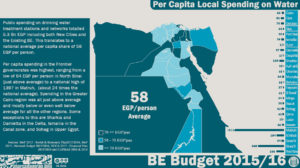
Fig. 17: Total local per capita spending on water
Sub-national Spending on Water in the Existing BE
When isolated, spending on the Existing BE, which was almost identical to spending on New Cities, translated to 30 EGP per person for the latter (fig. 18). For the Existing BE, the Frontier governorates still had the highest spending, though with South Sinai receiving the highest per capita rate at 648 EGP per person. In Greater Cairo spending was almost half the national average for the Existing BE (30 EGP per person), for Cairo and Giza, though almost double that for Qalubia. Spending was mostly below average in the Delta except in Damietta and Munufia, as well as in Upper Egypt, except for Assuit and Sohag.
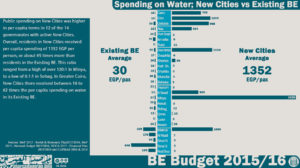
Fig. 18: Per capita spending on water in New Cities and the Existing BE
Sub-national Spending on Water in New Cities
Minya had the highest per capita share of all the New Cities at 3220 EGP per person (fig. 18). The rest of New Cities in Upper Egypt received well below average spending. Greater Cairo received around average spending, while Damietta led the Delta at around average. Sharkia, Munufia and Beheria were well below average. New Burg al-‘Arab in Alexandria received half the average, while New Alamien in its first year of construction brought per capita spending in Matruh to 1068 EGP per person, or around average. This is a stark contrast to the other New Cities still under construction in Port Said, Suez, and al-Wadi al-Gadid. Each of these has a per capita spending of between 2 and 11 EGP per person, or well below average.
Spending on Water; The Existing BE vs New Cities
Public spending on New Cities was higher in per capita terms in 12 of the 14 governorates with active New Cities (fig. 18). Overall, residents in New Cities received per capita spending of 1352 EGP per person, or about 45 times more than residents in the Existing BE. This ratio ranged from a high of over 120:1 in Minya, to a low of 0.1:1 in Sohag. In Greater Cairo, New Cities there received between 16 to 62 times the per capita spending on water in its Existing BE.
*Click here to go back to BE Budget 2015/2016