- Published on 06 February 2026
- Contents
Introduction
1. What type of projects required expropriation?
2. How much land was expropriated?
3. How much agricultural land was expropriated?
4. How many housing units were expropriated?
5. How much compensation was earmarked for expropriation?
6. How many Old Rental properties were expropriated?
Methodology
Team
Appendices - Notes & Sources
Introduction
In Egypt, we often hear about decrees to expropriate property for public benefit (also known as compulsory order or eminent domain), or we read about them in the newspapers, but what do we know about the extent to which the government exercises its constitutional right to forcibly acquire private property for the implementation of projects that benefit the general public?
This study aims to answer this question by analysing the data contained in public benefit decrees and expropriation decrees issued under the Expropriation for Public Benefit Law 10 /1990 (see the expropriation legislation archive). An inventory of these decrees published in the Official Gazette during 2024 revealed that there were 109 public benefit projects that required the expropriation of real estate or land during this period. These projects were not implemented in 2024, but over a period ranging from one to ten years, with a median duration of four years, where 42 projects were new and began in 2024, while 57 projects started earlier and were completed in 2024, and the remaining 10 projects that began before 2024 and were not completed during that year (for more information, see Methodology). Therefore, the analysis represents a snapshot of the total number of ongoing projects that had decrees issued during 2024, and does not represent the annual total projects or their impact in a single year.
Through analysis of the available data in expropriation decrees, as well as some verification through news reports and maps, the study reveals six key statistics showing: the types of projects for which expropriation is used, the total areas expropriated, the agricultural areas affected, the number of residential units demolished, the preliminary value of compensation, and finally, an exceptional statistic on the number of schools leased under Old Rent (rent control) that have been expropriated. In addition, each of the six statistics is shown in relation to the type of project for which expropriation was required, the implementing agency, and the geographical distribution by governorate. The report includes a section on the methodology of data collection and analysis, with appendices of data tables.
1. What type of projects required expropriation?
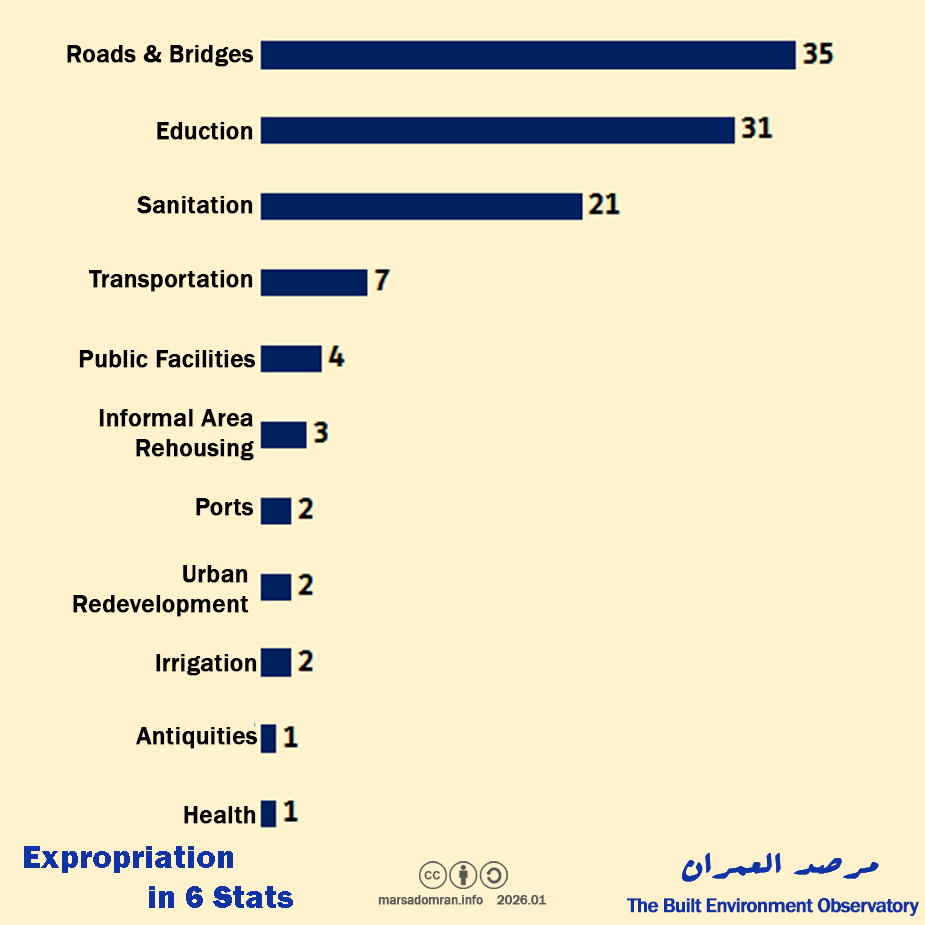
Of the 109 projects for which public benefit decrees were issued, roads and bridges topped the list with 35 projects accounting for 32% of the total (Figure 1, Appendix 1). These included the building of or widening of inner-city and regional highways, and a series of bridges over the Nile in Upper Egypt. This was followed by the education sector with 31 projects (28%), but for the expropriation of existing school premises rather than for new school construction projects (see Statistic 6 for more information). Sewage stations, whether pumping or treatment, came in third place with 21 projects, or 19% of the total number of projects. These stations are mainly implemented in rural governorates. These three project types accounted for about 80% of the total number of projects, while transportation (rail and underground), ports, irrigation, slum-clearance housing, urban redevelopment, car parks and public squares, health, and antiquities’ protection together accounted for the remaining 20%.
Figure 1: Distribution of projects by type (number)
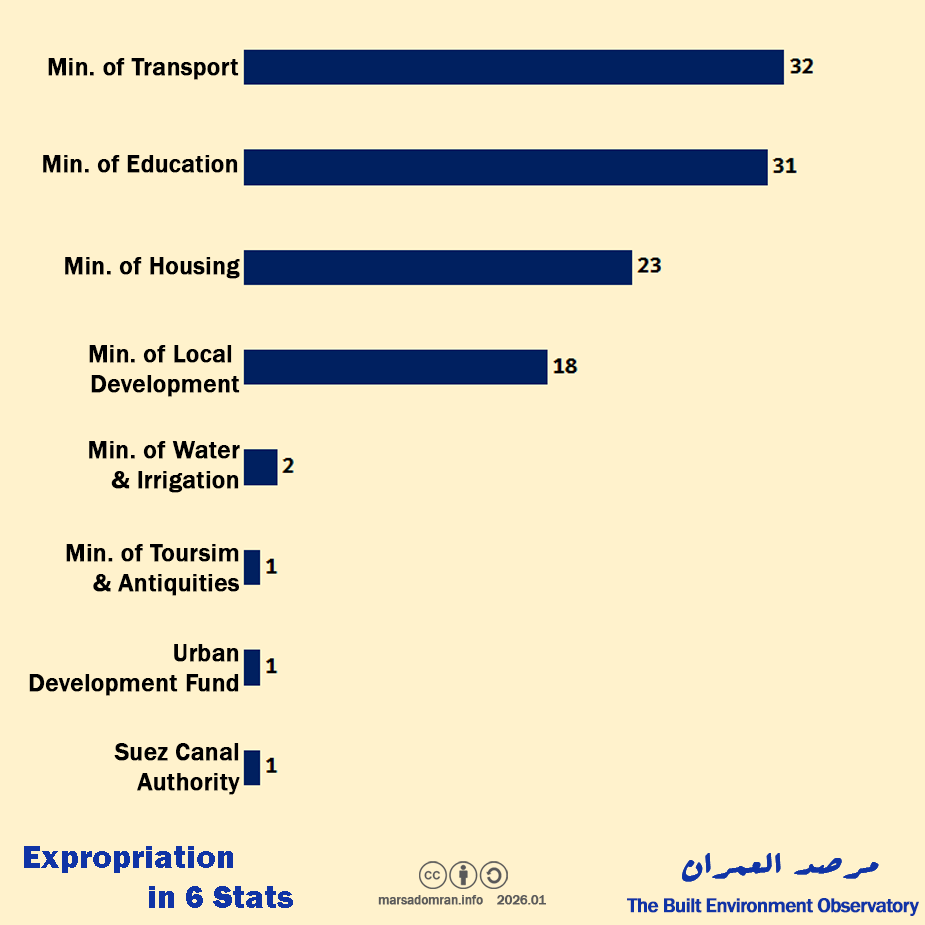
At the agency level, the Ministry of Transport issued the most public benefit and expropriation decrees during the study period, with 32 projects including roads and bridges, transport, and ports (Figure 2 and Appendix 2). It is followed by the Ministry of Education with 31 projects, though not for the construction of new schools (see statistic 6). In third place is the Ministry of Housing, Utilities and Urban Communities with 23 projects, covering roads and bridges (5 projects), and sanitation (18 projects). The Ministry of Local Development expropriated property for 18 projects, having the most diverse portfolio as it represents the governorates (local administration) as the implementing agency. These included alternative housing for sum clearance, improvement of public space (car parks and plazas), urban redevelopment, health, sanitation, and roads and bridges. These four ministries were responsible for 95% of all projects, with the remaining five percent belonging to the ministries of Water Resources and Irrigation, Tourism and Antiquities, as well as the Suez Canal Authority, and the Urban Development Fund affiliated to the Council of Ministers.
Figure 2: Distribution projects by entity requesting expropriation (number)
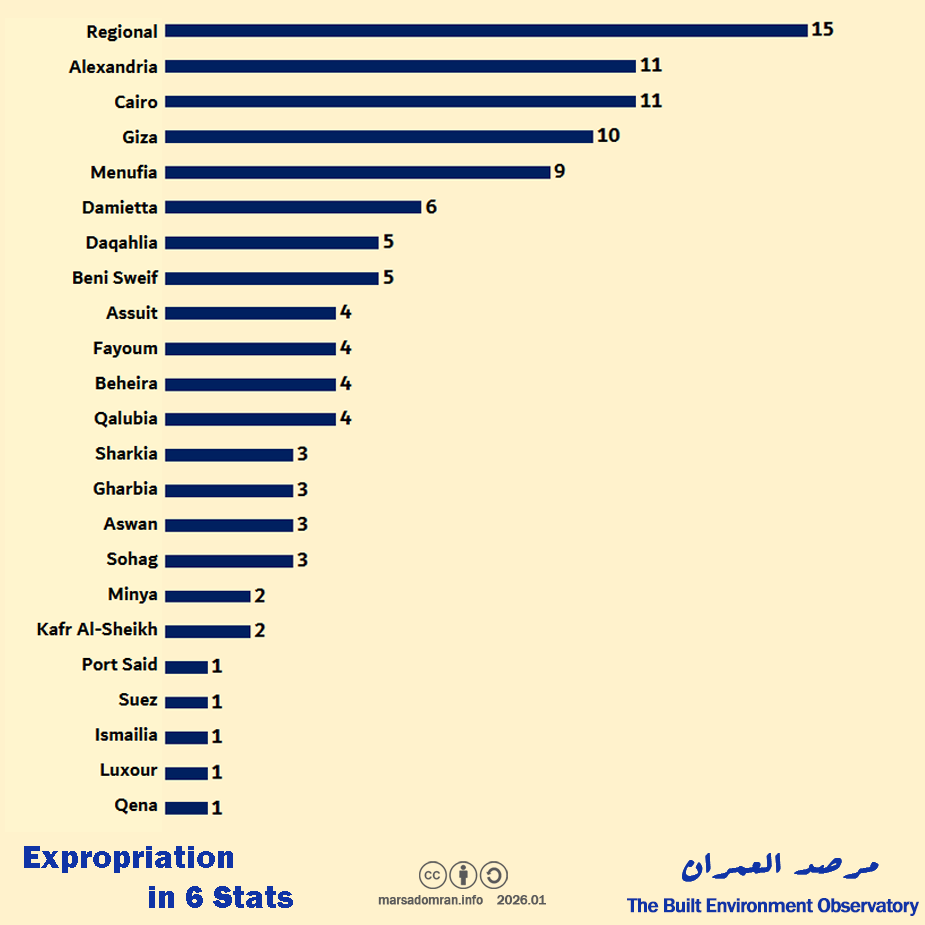
In terms of geographical distribution, the highest number of projects (15) were regional, i.e. inter- governorate, ranging from transport (trains), roads and bridges, and irrigation (Figure 3, Appendix 4). This was followed by projects in Alexandria and Cairo, with 11 projects each. Then came Giza with 10 projects.
Figure 3: Distribution of projects by governorate (number)
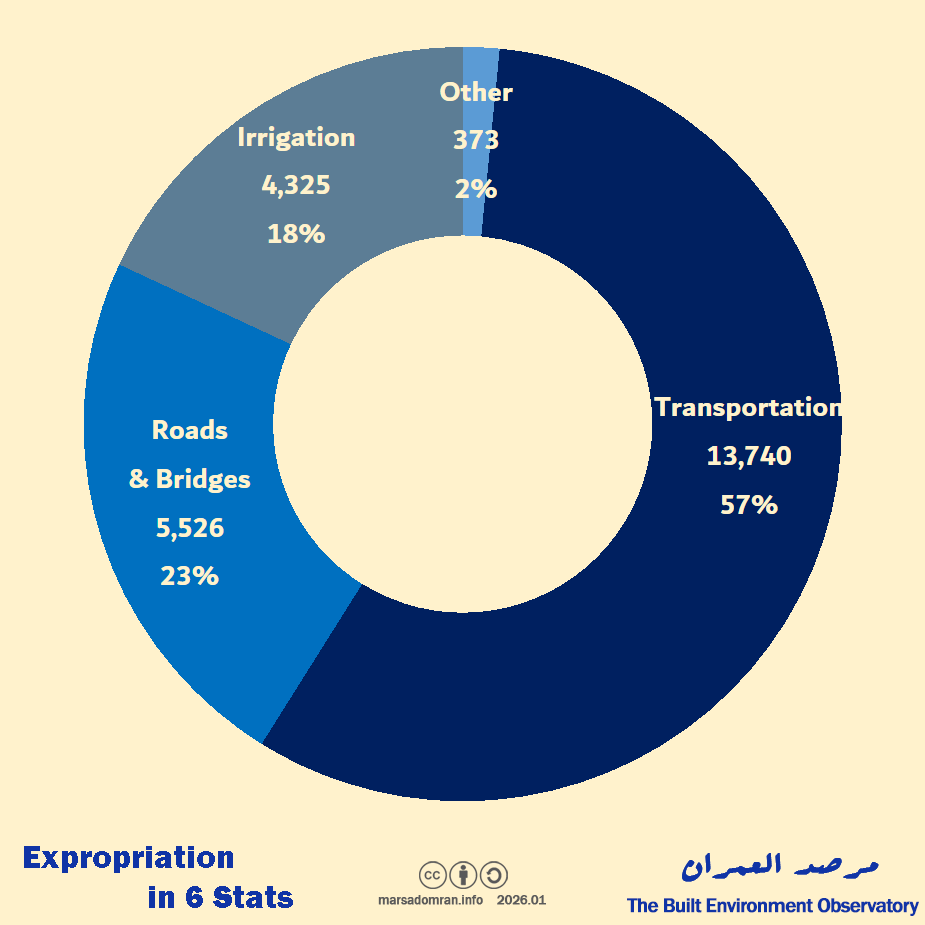
2. How much land was expropriated?
Our inventory revealed that 24,000 feddans (1 feddan = 1.038 acres, 0.42ha), were expropriated within the study period, including both private land transferred to the state via the expropriation powers, as well as land owned by state-affiliated institutions that was reallocated through the transfer of assets without compensation (Figure 4, Appendix 1). Transportation and communications projects topped the list, accounting for approximately 13,700 feddans, or 57% of the total area, with nearly all of it (99.6%) allocated to four projects: The Cairo Light Rail Transit, the two East Nile and West Nile monorail lines connecting Cairo to the New Capital and to 6th of October City, and the first and second lines of the High Speed Railway crossing more than 14 governorates
Roads and bridges required the expropriation of 5,000 acres, or 23% of the total area. Meanwhile, 18% of the total expropriated area went to irrigation (for desert land reclamation), including the New Delta project. Alternative housing for slum clearance projects (Ahalina 6 in Cairo, and Bashayer Al-Khair 5 in Alexandria),1 required the expropriation of 158 acres. For the purposes of urban redevelopment of the Nazlet al-Samman neighbourhood in Giza and areas in Historic Cairo, 104 acres were expropriated.
Figure 4: Distribution of total expropriated area by project type (feddans)
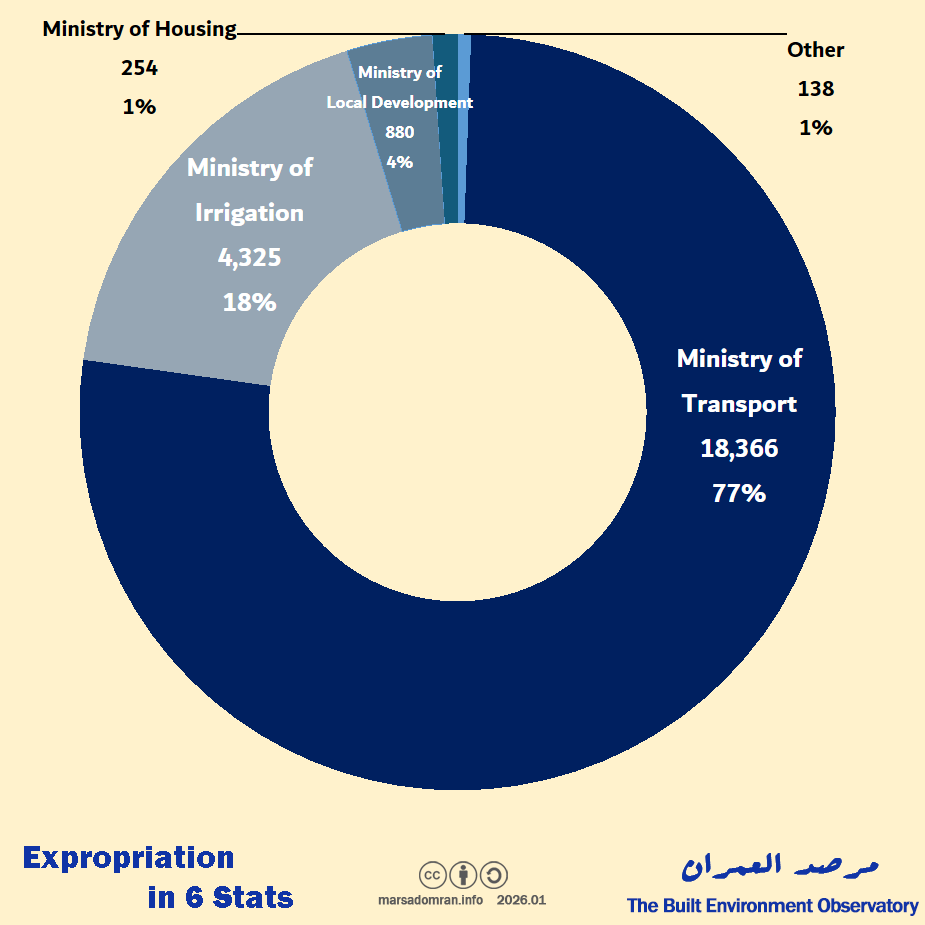
An analysis of the government agencies requesting expropriation showed that the Ministry of Transport was responsible for 77% of the expropriated land (Figure 5, Appendix 2), mainly due to implementing a number of mega projects, foremost among them is the High Speed Railway (lines 1 and 2), and the Greater Cairo Ring Road. Second was the Ministry of Water Resources and Irrigation with only two projects accounting for 18% of the expropriated land; a canal for the New Delta project, and another canal from Bahr al-Baqar drain to the east of the Suez Canal.
Figure 5: Distribution of total expropriated area by agency (feddan)
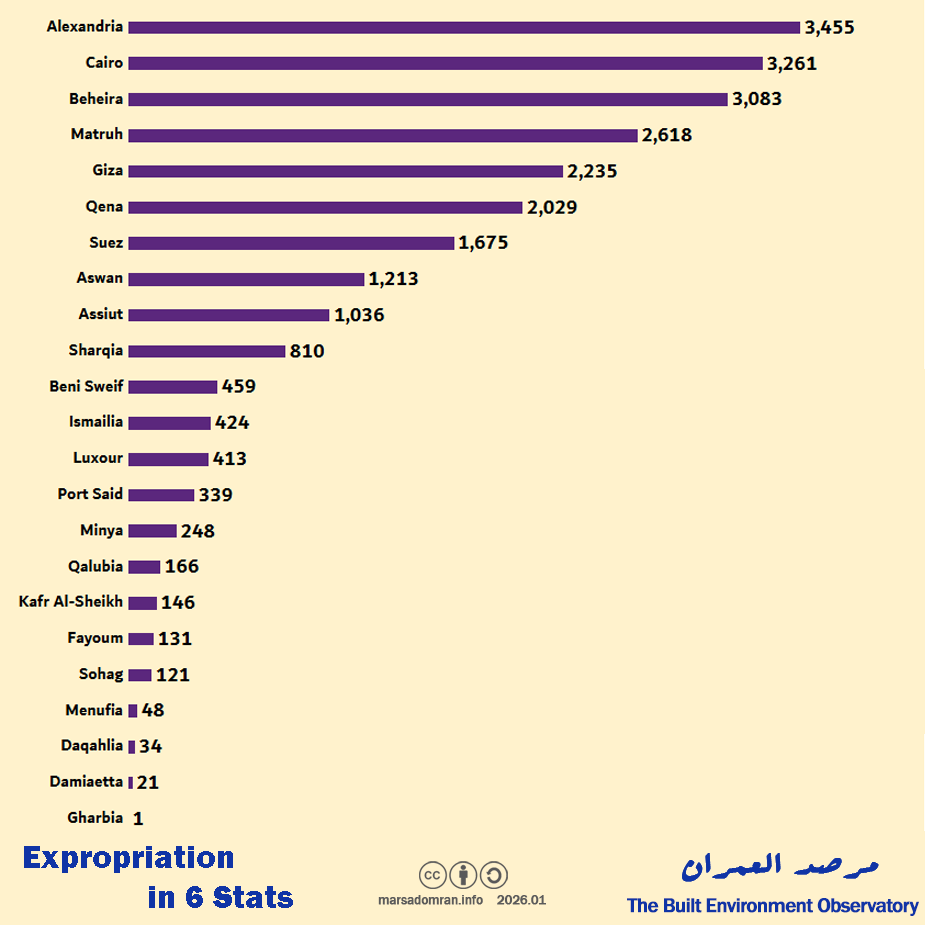
Regionally, the governorates of Alexandria, Cairo, and Beheira, saw the highest expropriations at around 3000 feddans each (Figure 6, Appendix 3). Most of this area was expropriated for the construction of an irrigation canal through Beheira and Alexandria to the New Delta land reclamation project in the Western Desert, and the construction of line one of the High Speed Railway. Meanwhile, 24% of the total area has been expropriated in Upper Egypt, as the second line of the High Speed Railway cuts through all Upper Egypt governorates from Fayoum to Aswan. The Ministry of Transport has also developed a plan to reduce the distances between the transverse axes connecting the road network east and west of the Nile to 25 km instead of 100 km, requiring multiple expropriations.
Figure 6: Distribution of total expropriated land by governorate (feddan)
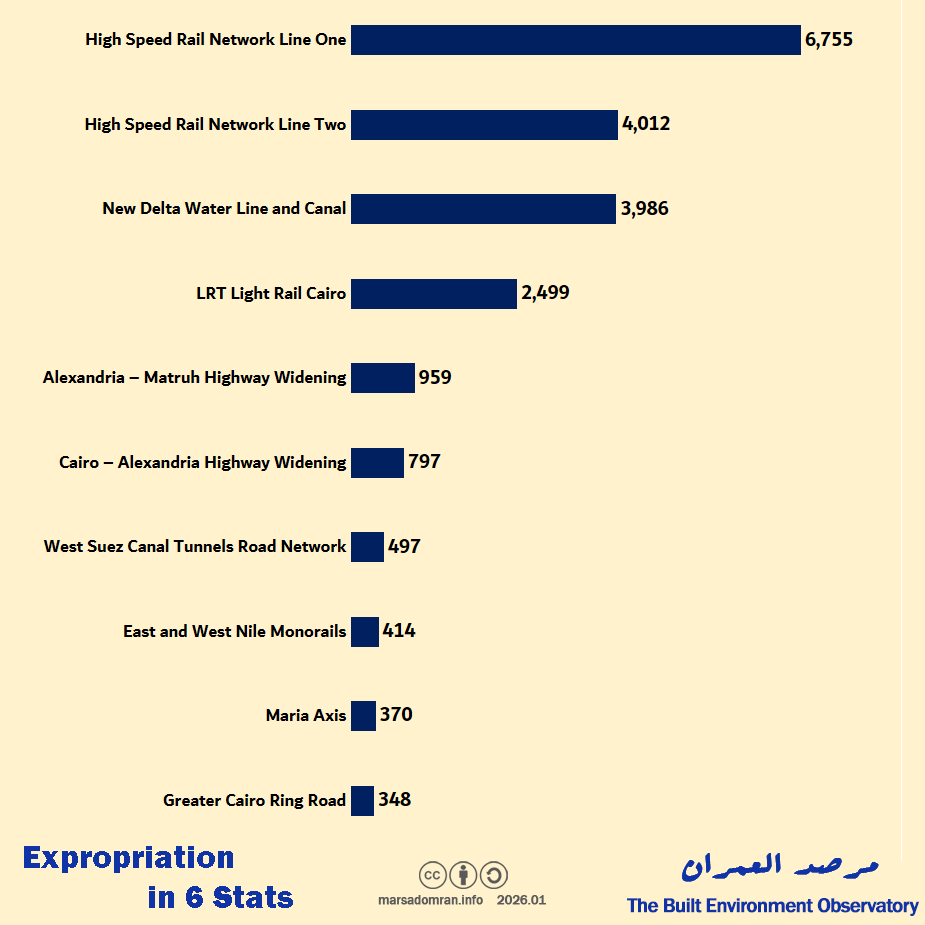
The top ten projects by area represented 86% of the 24,000 feddans expropriated for all 109 projects tallied in this study (Figure 7, Appendix 4). They included only three types of projects: transport, roads and bridges, and irrigation).
Figure 7: Top ten projects in terms of area (feddans)
3. How much agricultural land was expropriated?
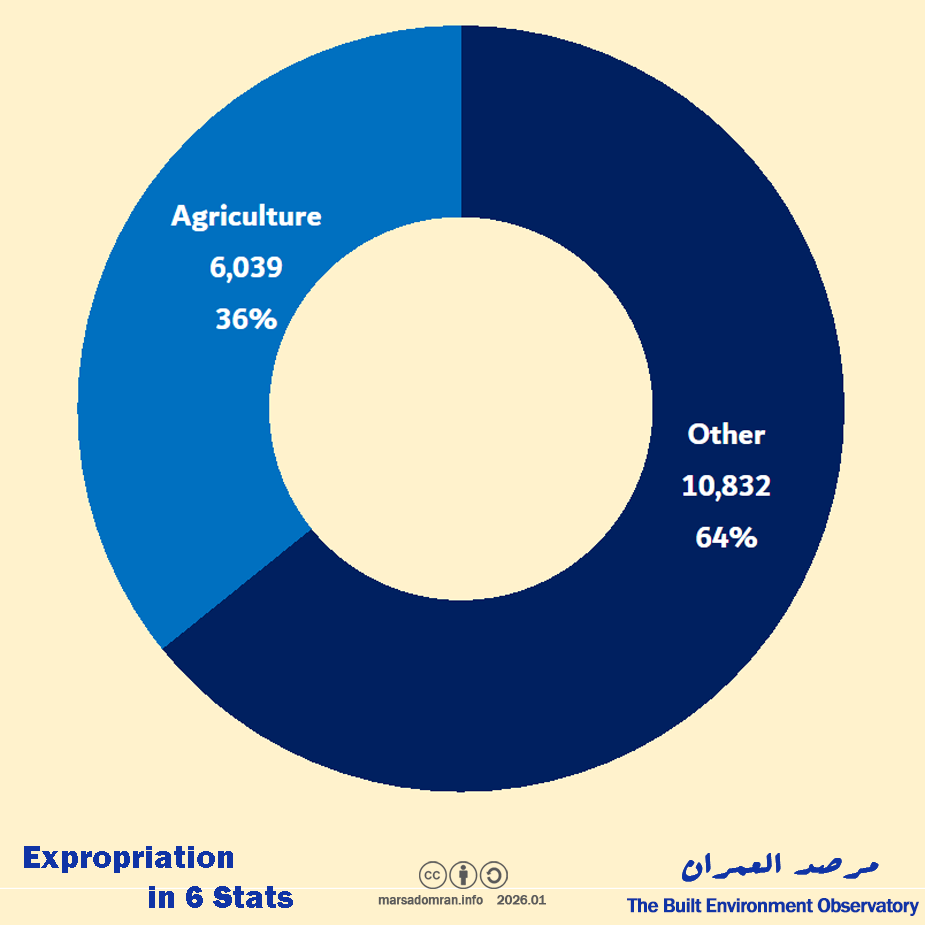
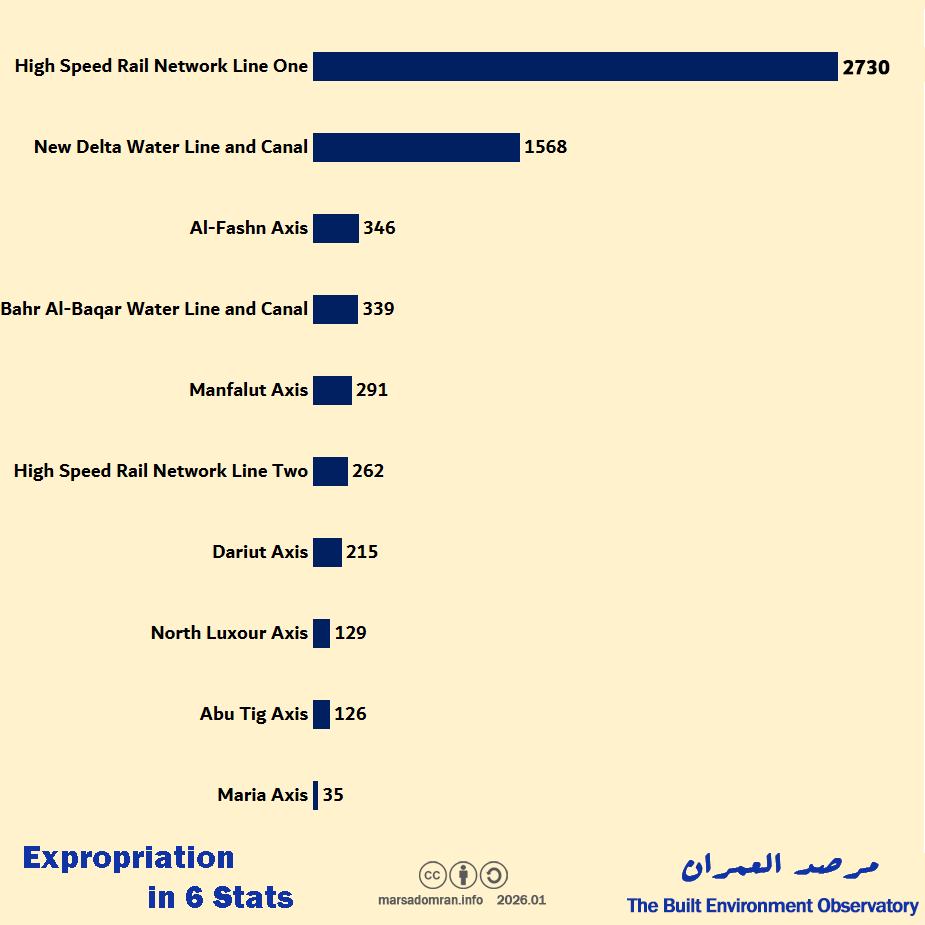
In a case study focusing on agricultural land, we analysed data from the ten largest projects by area that included agricultural land, using maps and aerial photographs for verification (see Methodology). Based on this, we found that 6000 acres of agricultural land were expropriated, representing 50% of the total area expropriated for these ten projects, and a quarter of the total area expropriated (Figure 8 and Appendix 5).
Figure 8: Expropriated agricultural land as a portion of the case study land (Feddans)
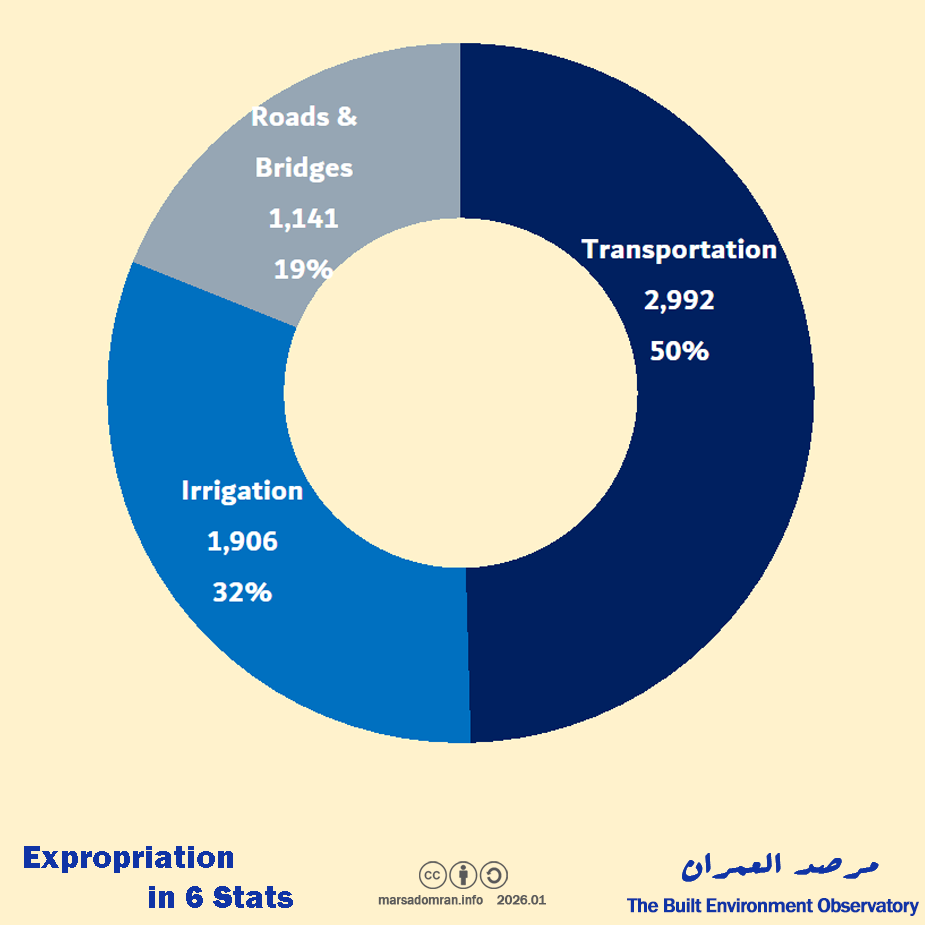
Across the ten projects, transportation projects accounted for 50% of the total agricultural area expropriated, followed by irrigation projects at 32% and roads and bridges at 19% (Figure 9, Appendix 5).
Figure 9: Distribution of agricultural land by project type (Feddans)
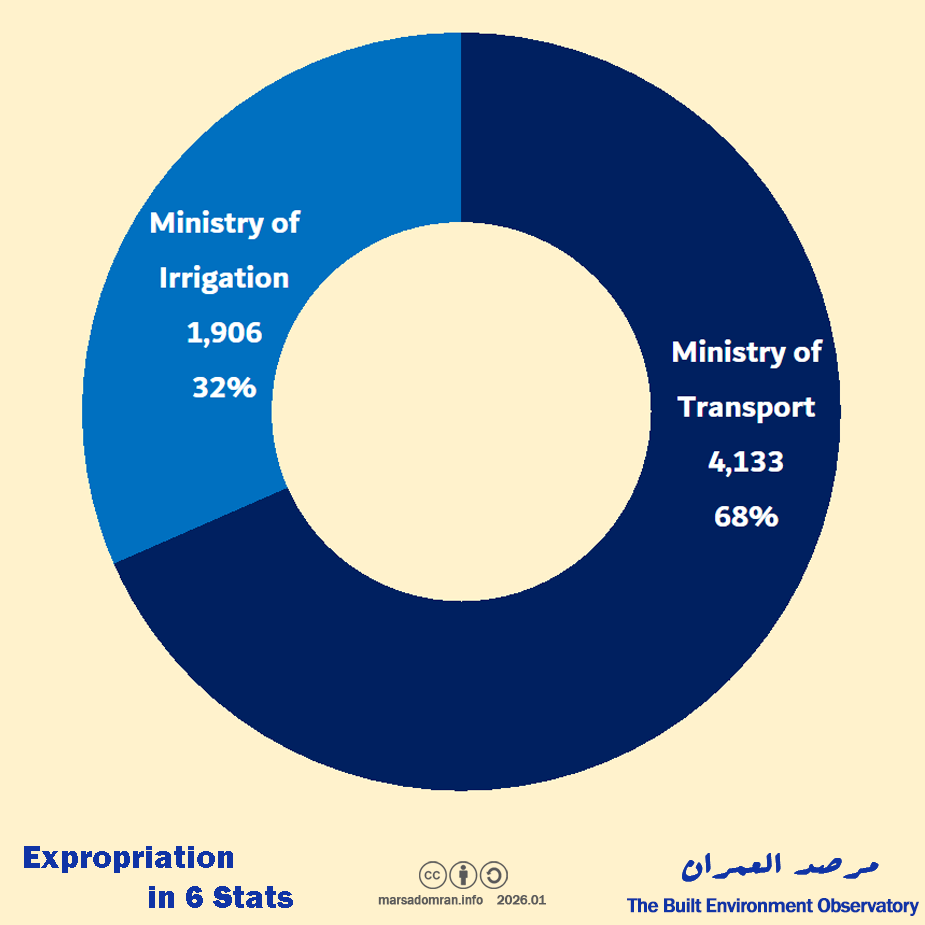
In terms of the agencies that implemented the projects, the agricultural land expropriated for the ten case study projects was distributed between only two ministries, transport, and water resources and irrigation, accounting for 68% and 32% respectively (Figure 10, Appendix 5).
Figure 10: Distribution of agricultural land by agency requesting expropriation (Feddans)
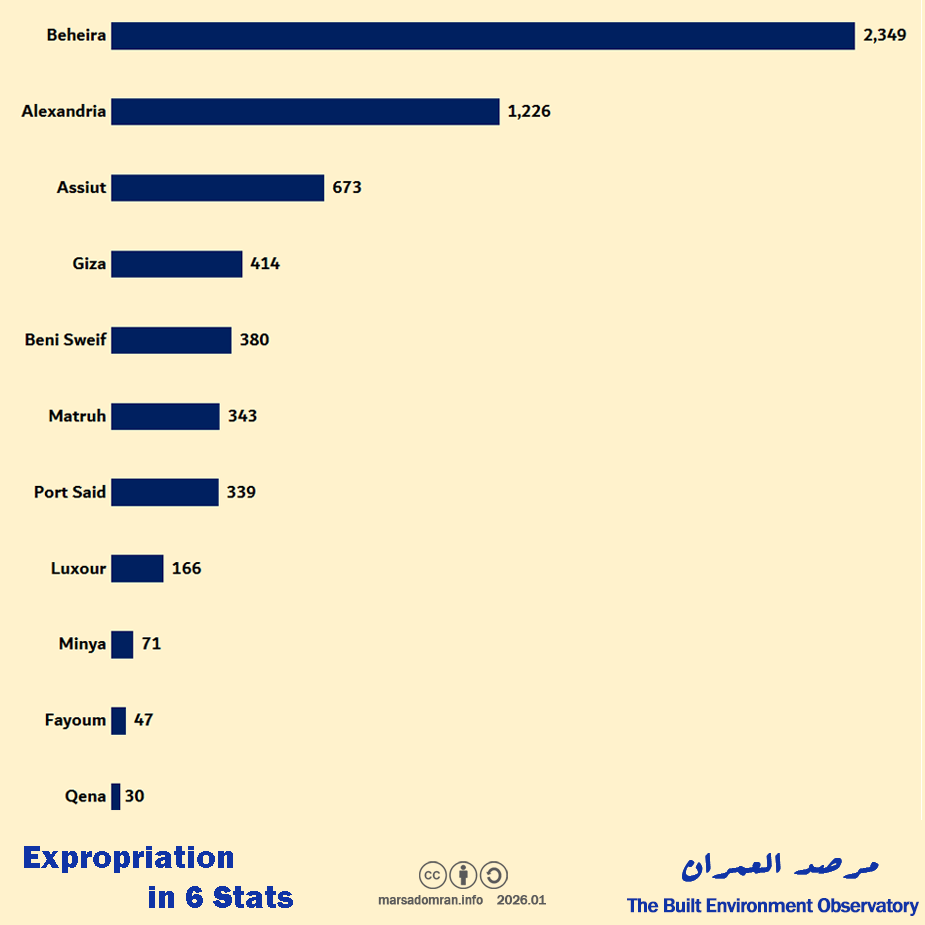
At the governorate level, we found that 2,349 feddans, representing 39% of the agricultural land, were expropriated in the Beheira governorate alone, all of it for two projects: the New Delta canal, and the first line of the High Speed Railway (Figure 11, Appendix 5). This was followed by the governorate of Alexandria with approximately 1,200 feddans, representing 20% of the total agricultural area.
Figure 11: Distribution of expropriated agricultural land by governorate (feddans)
The ten projects shown in (Figure 12, Appendix 5) were selected due to the need to verify and check the areas using maps and aerial photographs, as the decree data did not clearly state the area of agricultural land. The projects were selected according to the total area of the expropriation projects, then projects implemented in clearly urban areas (within cities) and on desert land, and that did not significantly overlap with agricultural land, were excluded. For example, although the light rail and monorail projects are larger in area than the transverse axes on the Nile in Upper Egypt, they were omitted because they primarily cut through desert and multi-use land. However, the agricultural areas affected are not limited to these projects. We found that highways currently under construction in the Delta, such as the Central Delta Axis, the Abu al-Rus Highway, and the East Mamoura Link in Alexandria, are all built on agricultural land; they were omitted because their total area remains smaller than that of the projects described.
Figure 12: The ten projects selected to show the amount of agricultural land expropriated (feddan)
4. How many housing units were expropriated?
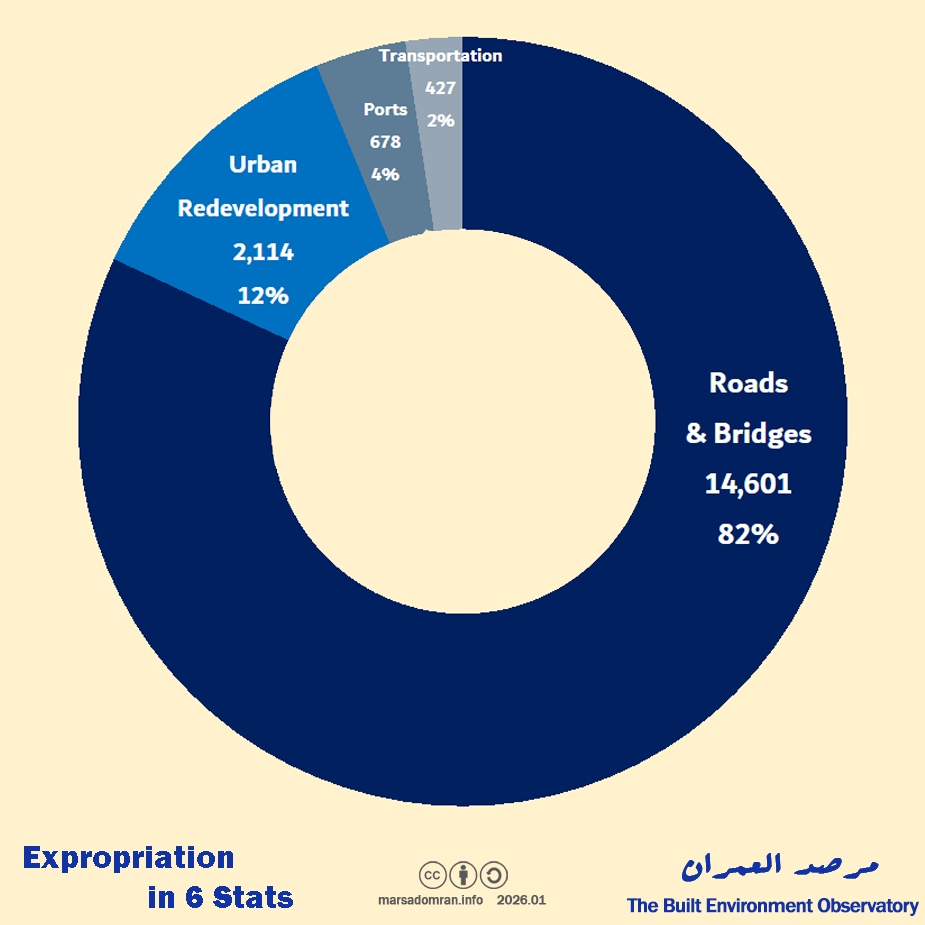
Using another case study, focusing on the top ten projects implemented in predominantly urban areas, we estimated that more than 17,000 housing units were expropriated (Figure 12 and Appendix 6). Roads and bridges, led by the widening of the Greater Cairo Ring Road, were the main reason homes were expropriated, at more than 14,000 housing units, representing 82% of the total. This was followed by urban redevelopment projects, which accounted for more than 2,000 units, or 12% of the total, all of which were in Nazlet al-Samman in Giza. Four per cent of the units were expropriated for port projects, the largest of which was the development of the El-Max in Alexandria, while transportation accounted for the expropriation of 2% of the total units
Figure 13: Distribution of expropriated residential units by project type (Units)
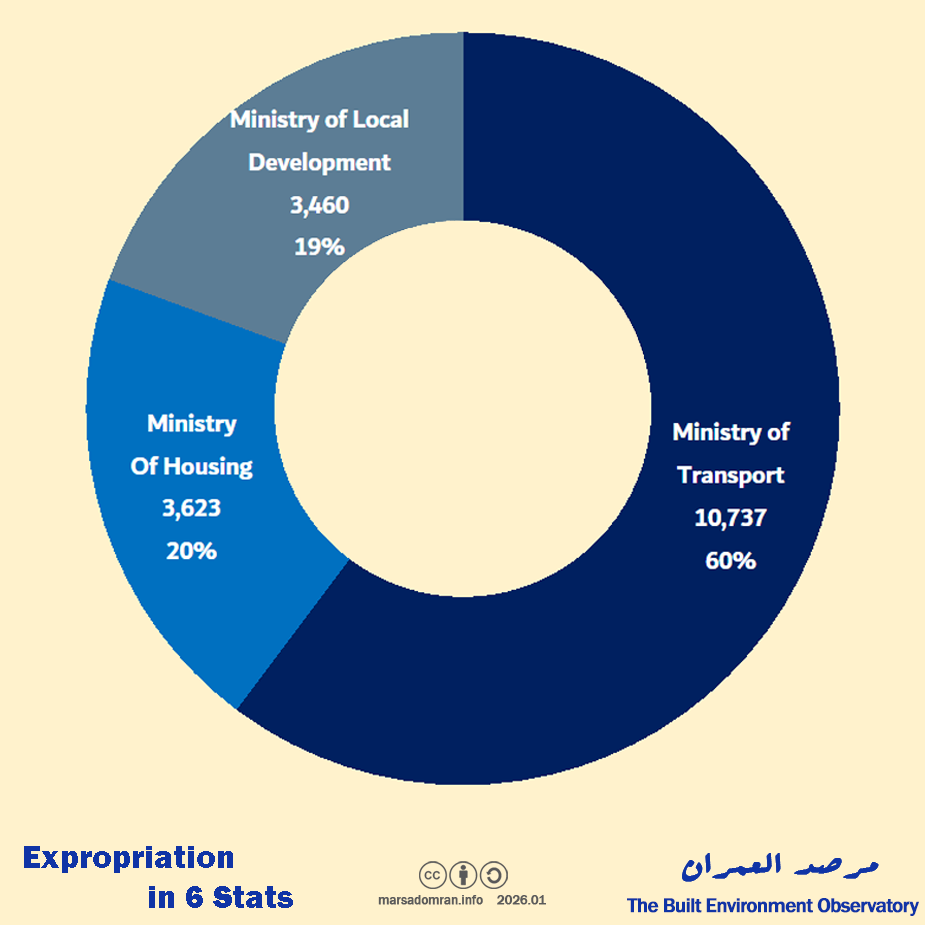
The Ministry of Transport topped the list of agencies requesting the expropriation of residential units, with 60% of the total, followed by the Ministry of Housing, Utilities and Urban Communities with 20.3%, and then the Ministry of Local Development with 19.4% (Figure 13, Appendix 6).
Figure 14: Distribution of expropriated housing units by expropriating agency (Units)
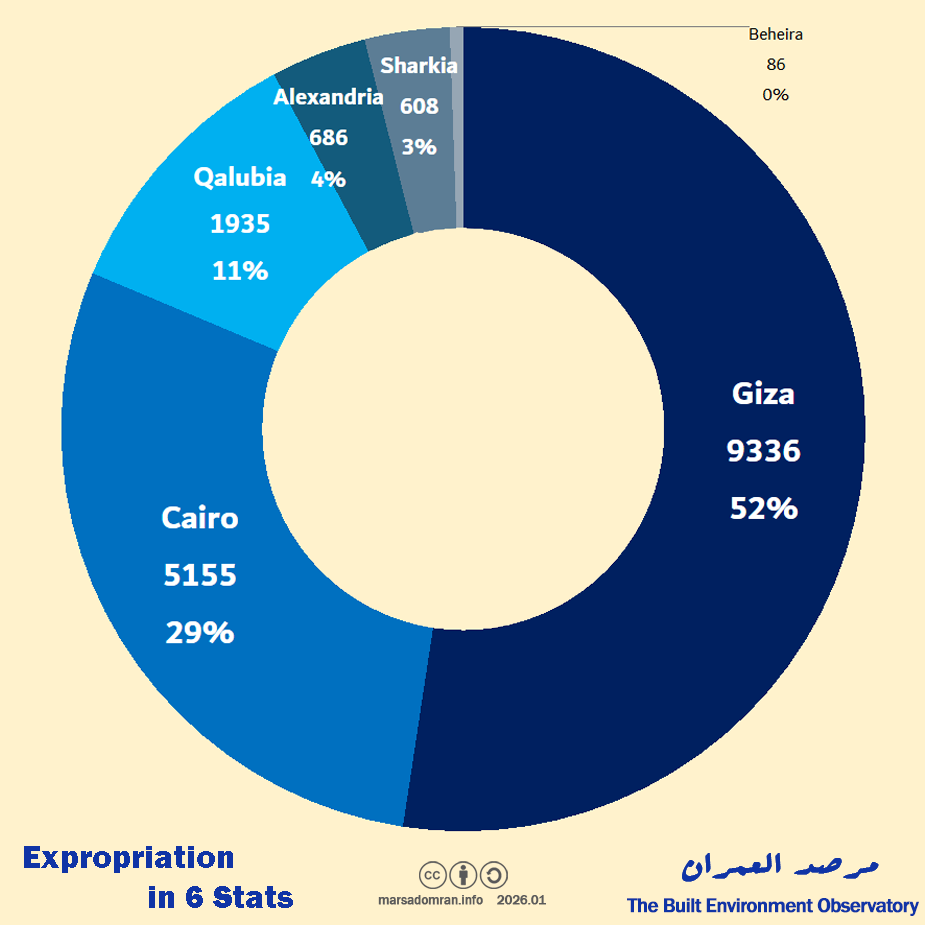
At the governorate level, we found that more than 9,000 units, or 52% of the total, were expropriated in the governorate of Giza alone. This was followed by the governorates of Cairo and Qalyubia, with 29% and 11% of the total, respectively. Thus, the expropriated housing units in these three governorates represent 92% of the total units, mainly due to the development and expansion of the ring road around Greater Cairo (Figure 14, Appendix 6).
Figure 15: Distribution of expropriated residential units by governorate (Units)
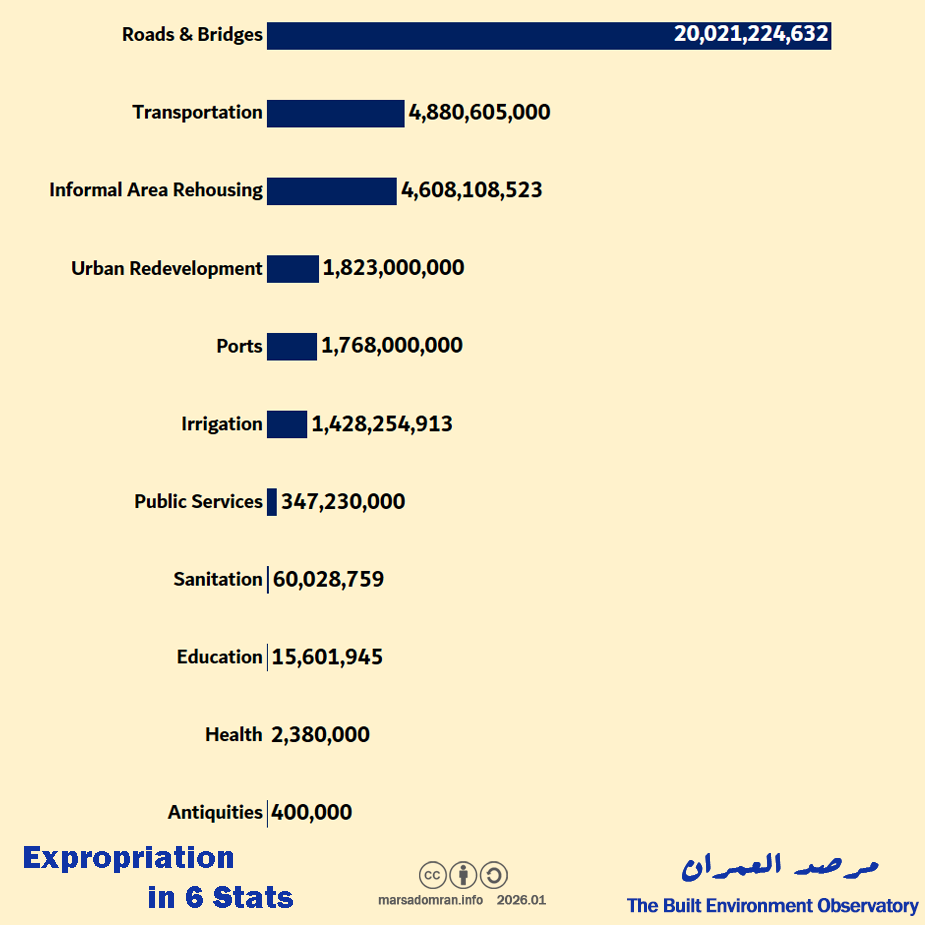
5. How much compensation was earmarked for expropriation?
The total preliminary compensation earmarked for expropriation amounted to EGP 35 billion during the study period (Figure 15, Appendix 1). More than half of the compensation was allocated to road and bridge projects, amounting to EGP 20 billion, while EGP 4.8 billion was allocated to transportation projects, and EGP 4.6 billion to alternative housing for informal settlements. It is worth noting that a portion of this compensation is paid out in-kind rather than cash, where for example, the decrees of the Ahalina 6 rehousing project showed that the Ministry of Housing (represented by the New Urban Communities Authority) offered land plots in new cities as compensation for the land expropriated in the Al-Salam neighbourhood.2
Figure 16: Distribution of compensation value by project (EGP)
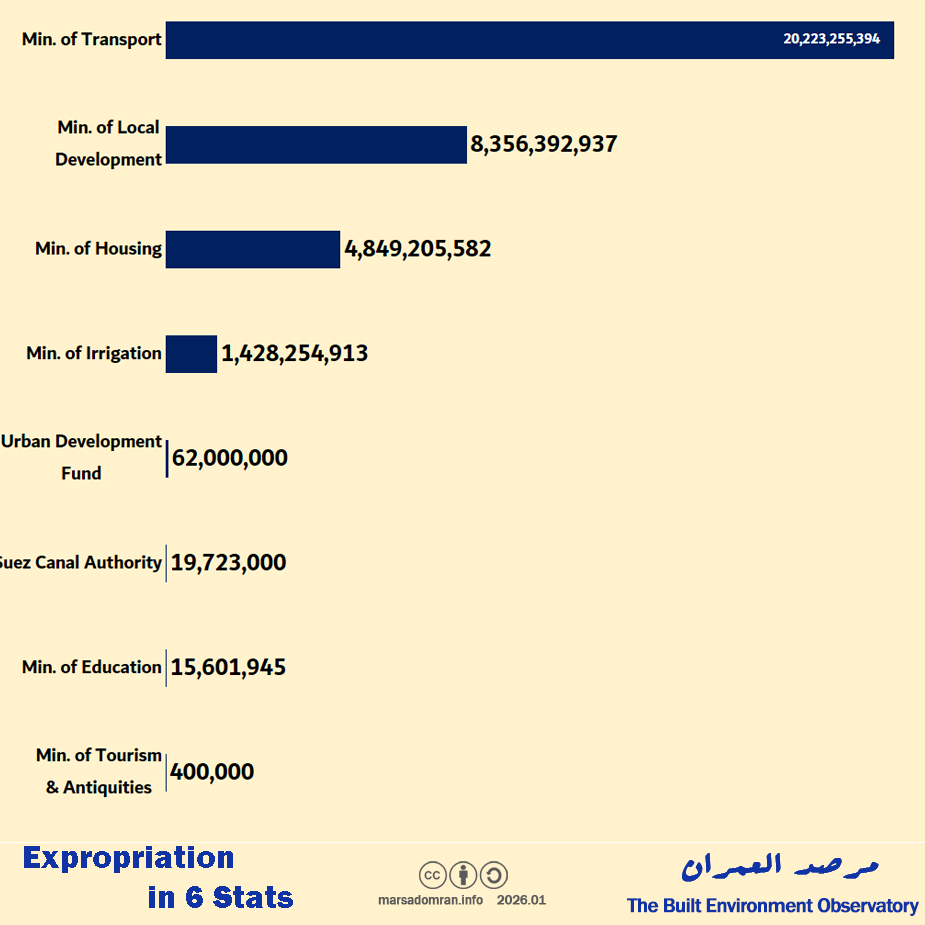
Looking at the implementing agencies, the preliminary compensation for Ministry of Transport projects was the highest, exceeding EGP 20 billion for 32 projects (Figure 16 and Appendix 2). This was followed by the Ministry of Local Development with EGP 8.4 billion, then the Ministry of Housing, Utilities and Urban Communities due to pay out 4.8 billion pounds.
Figure 17: Compensation values by expropriating agency (EGP)
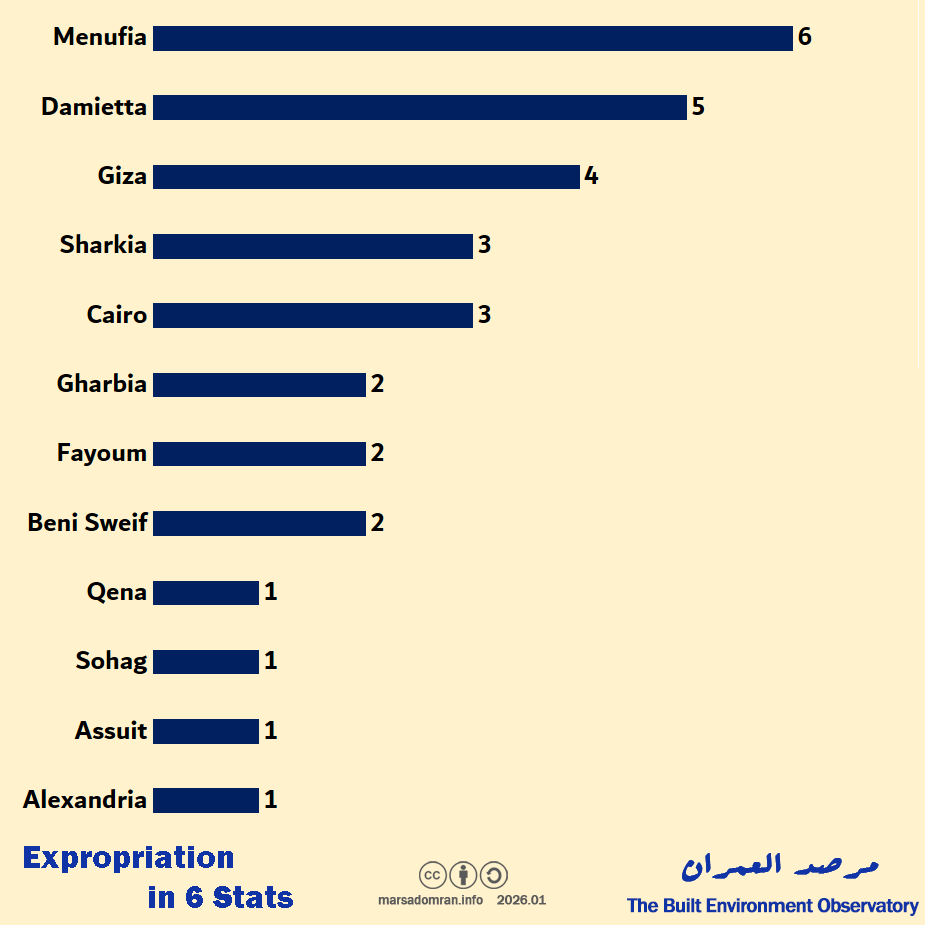
6. How many Old Rental properties were expropriated?
When analysing the expropriation decrees, we noticed an exceptional case involving the expropriation of 32 existing school buildings, rather than the construction of new schools, as is usually the case with expropriation (Figure 17, Appendix 1). These are school premises that were rented under the Old Rent law, with some leases dating back to the 1940s and 1930s. The expropriation decrees show that during the legislative vacuum that occurred between the Supreme Constitutional Court’s ruling that indefinite leases for units leased to legal entities (i.e. companies and institutions) was unconstitutional in 2018,3 and the House of Representatives’ delay until 2022 in issuing a law regulating the ruling,4 the landlords filed eviction and repossession suits which were ruled in their favour. This prompted the Ministry of Education to request their expropriation for public benefit, citing the ‘urgent need’ for these schools due to the high population density of the areas in which they are located.5
Figure 18: Distribution of expropriated schools by governorate
Methodology
According to Expropriation for Public Benefit Law 10/1990 (see the expropriation legislation archive), projects requiring expropriation are issued at least two separate decrees: first is a decree declaring that the project is of public benefit, and later, an expropriation decree that formally transfers ownership to the state completing the procedure. For the purposes of this study, we analysed all public benefit decrees (93 decrees) and expropriation decrees (43 decrees) published in the Official Gazette during 2024. These decrees showed that there were 109 separate projects. In addition to these, we found decrees to amend, correct or add data to the original decree, or decrees to renew the original decree (given that they expire within three years after their issuance). Temporary seizure decrees (qarar istila’), were not included unless they were followed by a public benefit decree or an expropriation decree, as they do not contain data such as area, preliminary compensation value, number of properties, or maps. On this basis, 116 decrees declaring public benefit and expropriation for these projects were found before 2024, and 35 additional decrees were issued during 2025, bringing the total number of decrees issued for the projects to 287. The average age of the projects was four years between the first decree issued and the last decree for projects completed by the end of 2025.
A. Data contained in the decrees
These decrees contained a range of data, from which we mainly monitored the following:
-
1. Project name
-
2. Implementing/expropriation requesting entity (ministries or government agencies)
-
3. Governorate
-
4. Number of owners or number of properties
-
5. Total area of properties (some decrees)
-
6. Project maps
-
7. Financial compensation
We relied primarily on the first public interest declaration decree issued for the project to collect data, unless it was replaced or amended by a subsequent decree. If more than one public interest declaration decree was issued for a single project, adding land or properties to it, we added them to the total area and residential units, and if preliminary compensation was allocated for the added land and properties, we added it to the compensation value.
The declaration begins by listing the laws and decrees on which it is based, then stipulates three articles. The first article declares that the expropriation of the property necessary for the project is considered a public benefit. The second article declares the direct seizure of the property necessary for the implementation of the project. The third article is the publication in the official gazette.
This is followed by an explanatory memorandum from the competent minister (the minister of the agency requesting the expropriation), which describes the project, the purpose of its implementation, and the initial compensation amount. This is followed by cadastral maps and lists showing the names of the apparent owners, which are approved by the Survey Directorate of the governorate..
B. Classification of project types
Given the lack of a unified classification of projects in the decrees, we have classified the types of projects based on the data in the decrees according to the following classification:
-
1. Roads and bridges (motorways, urban roads, bridges, tunnels)
-
2. Transport and communications (railways, underground railways, public transport)
-
3. Ports
-
4. Education (existing school premises)
-
5. Sanitation (treatment plants, pumping stations, or networks)
-
6. Irrigation (irrigation canals or agricultural drainage, treatment plants, and pumping stations)
-
7. Improvement of public facilities (development of public squares, construction of car parks, service stations)
-
8. Alternative housing for informal settlements (housing for residents of unsafe areas that are being demolished)
-
9. Urban redevelopment (urban projects that change the original urban form for re-planning and tourism purposes)
-
10. Antiquities (designation of an area or building subject to the Antiquities Protection Law)
-
11. Health (health units and hospitals)
C. Audited or verified data
In addition to the basic data, we verified additional data that was incomplete or not clearly visible in the decrees, which was compiled based on the data contained in the decrees, namely:
1. Agricultural land area
We relied primarily on the decrees issued for the project to calculate the agricultural land area. We considered the entire area to be agricultural if: It was stated to be such, or was owned by an agricultural development company. If the data in the decrees were not sufficient, we resorted to calculating the area from aerial photographs and maps (Google Earth).
-
If it became clear that the project route passed entirely through agricultural land, we considered the entire area required for expropriation by the decree to be agricultural land
-
In the event that the project route crossed through multi-use land, we calculated the agricultural area by determining the lengths of agricultural land it passed through at the average width of the project.
2. Number of residential units
The number of units was taken from decrees that mentioned them clearly. In the event they didn’t (as properties were not sub-divided into units), we used aerial photographs (Google Earth) to identify the number of floors of the demolished properties. From their appearance, we could distinguish the approximate number of residential units per floor based on the area of the building and the number of balconies and windows on the facade.
It is worth noting that only residential units for which an expropriation for public benefit decree was issued are counted. While expropriation decrees may be linked to replanning decrees issued under the Unified Building Law 119/2008 that result in the removal of dwellings, replanning decrees for which no subsequent expropriation decree was issued have not been included. For example, the areas of Almaza in Heliopolis and Ezbet Al-Ikhlas in Al-Nozha.6 No administrative evictions (qara izala, qarar ikhla’) were included, whether for encroachment on state land, building violations, or property deterioration.
3. Total areas of some projects
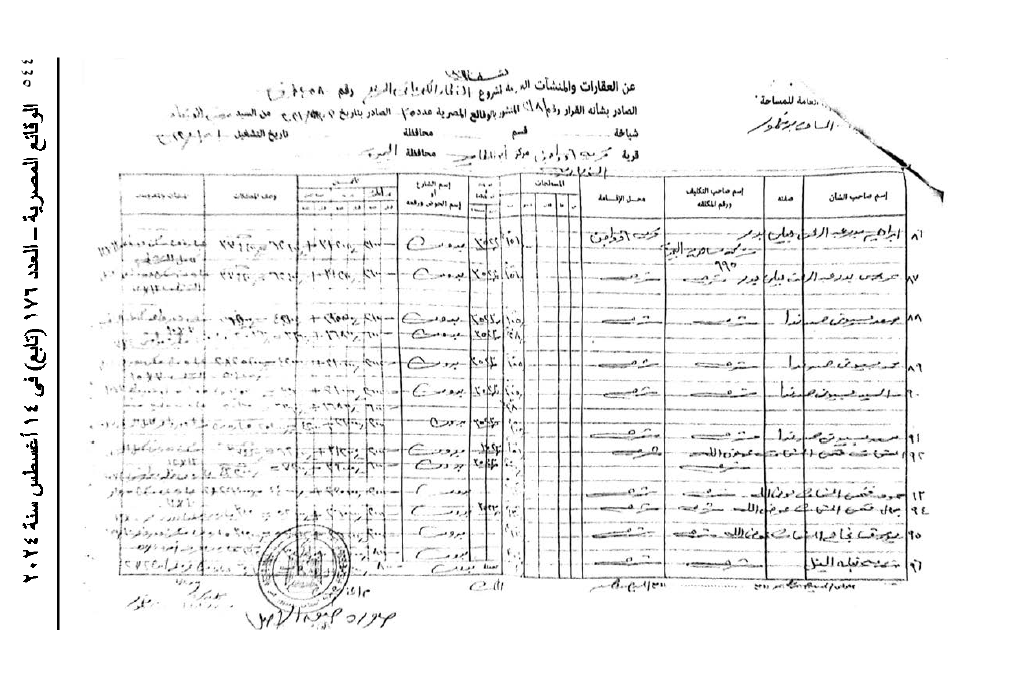
The total area required for expropriation is mentioned in the explanatory memorandum in some decrees only, which forced us in most projects to calculate it by adding up the areas of the properties in the attached lists. The number of properties varied from one decree to another, ranging from a single property to nearly 4,000 properties, as in the case of the ring road. This posed a challenge. Important details about the properties to be expropriated were sometimes missing and sometimes unclear. We found statements written in illegible handwriting or photographed in a blurred or fragmented manner.
Figure 19: Page from the statement attached to Minister of Transport Decree No. 456 of 2024 for the first phase of the electric rapid transit project
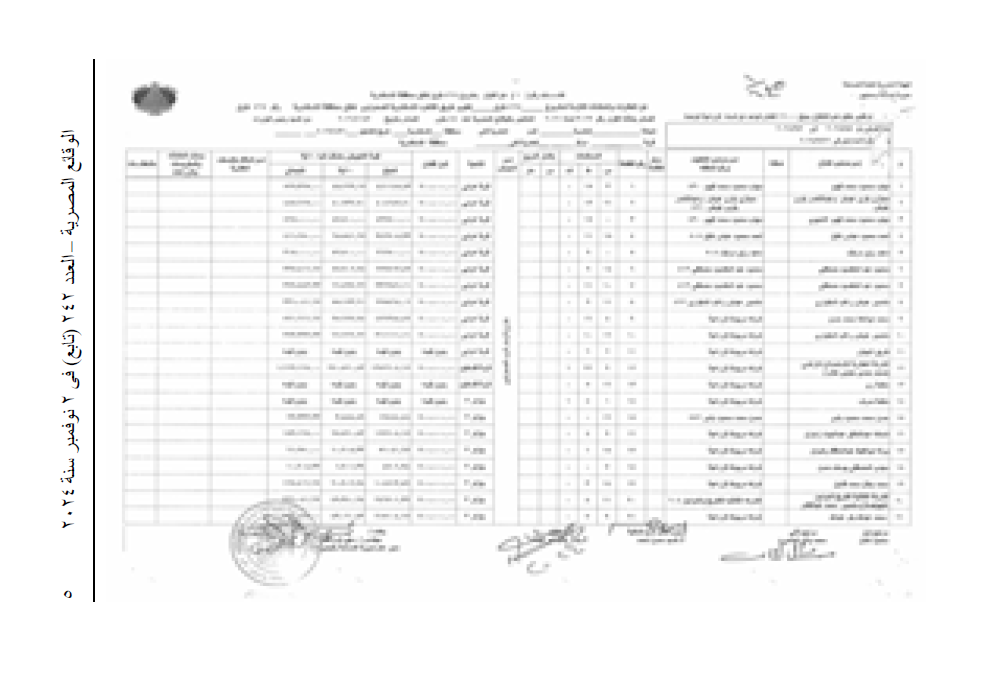
Figure 20: Page from the statement attached to Minister of Transport Decree No. 645 of 2024 for the Cairo-Alexandria Desert Road development project
Team
-
Project manager: Yahia Shawkat
When citing, please refer to the study as follows:
‘Expropriation in Egypt in Six Stats | Data Story.’ Built Environment Observatory. 26 January 2026.
Appendices
Appendix 1: Distribution of expropriation data by type of project
|
Project |
Number of Projects |
Area (Feddan) |
Compensation (LE) |
|
Transportation |
7 |
13,740 |
4,880,605,000 |
|
Roads & Bridges |
35 |
5,526 |
20,021,224,632 |
|
Irrigation |
2 |
4,325 |
1,428,254,913 |
|
Alternative housing for informal settlements |
3 |
158 |
4,608,108,523 |
|
Urban redevelopment |
2 |
104 |
1,823,000,000 |
|
Sanitation |
21 |
63 |
60,028,759 |
|
Ports |
2 |
33 |
1,768,000,000 |
|
Education |
31 |
7 |
15,601,945 |
|
Improving public facilities |
4 |
7 |
347,230,000 |
|
Health |
1 |
1 |
2,380,000 |
|
Antiquities |
1 |
0.02 |
400,000 |
|
Total |
109 |
23,965 |
34,954,833,772 |
Appendix 2: Distribution of expropriation data by agency
|
Agency |
Project |
Projects (No.) |
Area (Feddan) |
Compensation (LE) |
|
Ministry of Transport |
Roads & Bridges |
23 |
4593 |
13,574,650,394 |
|
Transportation |
7 |
13,740 |
4,880,605,000 |
|
|
Ports |
2 |
33 |
1,768,000,000 |
|
|
Total |
32 |
18,366 |
20,223,255,394 |
|
|
Ministry of Water Resources & Irrigation |
Irrigation |
2 |
4325 |
1,428,254,913 |
|
Ministry of Local Development |
Roads & Bridges |
6 |
611 |
1,623,128,740 |
|
Improving public facilities |
4 |
7 |
347,230,000 |
|
|
Sanitation |
3 |
1 |
14,545,674 |
|
|
Alternative housing for informal settlements |
3 |
158 |
4,608,108,523 |
|
|
Health |
1 |
1 |
2,380,000 |
|
|
Urban redevelopment |
1 |
102 |
1,761,000,000 |
|
|
Total |
18 |
880 |
8,356,392,937 |
|
|
Ministry of Housing, Utilities & Urban Communities |
Sanitation |
18 |
63 |
45,483,084 |
|
Roads & Bridges |
5 |
191 |
4,803,722,498 |
|
|
Total |
23 |
254 |
4,849,205,582 |
|
|
Suez Canal Authority |
Roads & Bridges |
1 |
130 |
19,723,000 |
|
Ministry of Education & Technical Education |
Education |
31 |
7 |
15,601,945 |
|
Urban Development Fund |
Urban redevelopment |
1 |
1 |
62,000,000 |
|
Ministry of Tourism & Antiquities |
Antiquities |
1 |
0 |
400,000 |
|
Total |
109 |
23,965 |
34,954,833,772 |
|
Appendix 3: Geographical distribution of expropriation projects by type and area (Feddan)
|
Type/ Governorate |
Transportation |
Roads & Bridges |
Irrigation |
Alternative Housing for Informal Areas |
Urban Redevelopment |
Sanitation |
Ports |
Improving public facilities |
Education |
Health |
Antiquities |
Area |
|
Alexandria |
918 |
878 |
1,611 |
15 |
– |
18 |
14 |
– |
0.2 |
– |
– |
3,455 |
|
Cairo |
3,068 |
47 |
– |
143 |
1 |
– |
– |
1 |
1 |
– |
0.02 |
3,261 |
|
Behira |
1,660 |
653 |
771 |
– |
– |
0.2 |
– |
– |
– |
– |
– |
3,083 |
|
Matrouh |
472 |
542 |
1,604 |
– |
– |
– |
– |
– |
– |
– |
– |
2,618 |
|
Giza |
1,523 |
604 |
– |
– |
102 |
0.3 |
– |
4 |
1 |
– |
– |
2,235 |
|
Qena |
2,028 |
– |
– |
– |
– |
– |
– |
0.02 |
– |
– |
2,029 |
|
|
Suez |
1,346 |
329 |
– |
– |
– |
– |
– |
– |
– |
– |
1,675 |
|
|
Aswan |
1,021 |
191 |
– |
– |
– |
– |
– |
– |
– |
– |
1,213 |
|
|
Asiut |
274 |
762 |
– |
– |
– |
– |
– |
– |
0.3 |
– |
– |
1,036 |
|
Sharqia |
716 |
93 |
– |
– |
– |
– |
– |
– |
1 |
– |
– |
810 |
|
Beni Sweif |
91 |
347 |
– |
– |
– |
21 |
– |
– |
0.4 |
– |
– |
459 |
|
Ismailia |
– |
424 |
– |
– |
– |
– |
– |
– |
– |
– |
424 |
|
|
Luxor |
124 |
289 |
– |
– |
– |
– |
– |
– |
– |
– |
413 |
|
|
Port Said |
– |
339 |
– |
– |
– |
– |
– |
– |
– |
339 |
||
|
Minya |
248 |
– |
– |
– |
– |
0.1 |
– |
– |
– |
– |
– |
248 |
|
Qalubia |
26 |
140 |
– |
– |
– |
0.4 |
– |
– |
– |
– |
– |
166 |
|
Kafr Al- Sheikh |
137 |
– |
– |
– |
9 |
– |
– |
– |
– |
– |
146 |
|
|
Fayoum |
106 |
19 |
– |
– |
– |
6 |
– |
– |
0.3 |
– |
– |
131 |
|
Sohag |
120 |
– |
– |
– |
– |
0.2 |
– |
– |
0.2 |
1 |
– |
121 |
|
Menufia |
– |
39 |
– |
– |
– |
8 |
– |
– |
1 |
– |
– |
48 |
|
Daqahlia |
– |
32 |
– |
– |
– |
0.1 |
– |
2 |
– |
– |
34 |
|
|
Damietta |
– |
1 |
– |
– |
– |
– |
19 |
– |
1 |
– |
– |
21 |
|
Gharbia |
– |
– |
– |
– |
0.2 |
– |
– |
1 |
– |
– |
1 |
|
|
Total |
13,740 |
5,526 |
4,325 |
158 |
104 |
63 |
33 |
7 |
7 |
1 |
0 |
23,964 |
Appendix 4: Top 10 largest expropriation projects by area (Feddan)
|
Project |
Area (Feddan) |
Compensation (LE) |
Type |
Agency |
Governorate(s) |
|
High Speed Rail network Line One (Sokhna – Matrouh) |
6,755 |
1,450,000,000 |
Transportation |
Ministry of Transport |
Suez, Cairo, Giza, Menofia, Behira, Alexandria, Matrouh |
|
High Speed Rail network Line Two (6th October – Abu Simbel) |
4,012 |
665,000,000 |
Transportation |
Ministry of Transport |
Giza, Fayoum, Beni Suef, Minia, Asiut, Sohag, Qena, Luxor, Aswan, New Valley |
|
New Delta Water Route |
3,986 |
1,308,000,000 |
Irrigation |
Ministry of Water Resources & Irrigation |
Behira, Alexandria, Matrouh |
|
LRT Light Rail Line |
2,499 |
1,150,000,000 |
Transportation |
Ministry of Transport |
Cairo, Sharqia |
|
Widening of the International Coastal Highway (Alexandria – Matrouh) |
959 |
800,000,000 |
Roads & Bridges |
Ministry of Transport |
Alexandria, Matrouh |
|
Widening of Cairo-Alexandria Desert Highway |
797 |
840,000,000 |
Roads & Bridges |
Ministry of Transport |
Giza, Menofia, Behira, Alexandria |
|
Suez Canal Tunnels Road Network (West) |
497 |
798,900,000 |
Roads & Bridges |
Ministry of Local Development |
Suez, Ismailia |
|
West & East Nile Monorail |
414 |
1,365,000,000 |
Transportation |
Ministry of Transport |
Cairo, Giza |
|
Maria Road Axis |
370 |
110,000,000 |
Roads & Bridges |
Ministry of Transport |
Alexandria |
|
Greater Cairo Ring Road widening |
348 |
6,747,000,000 |
Ministry of Transport |
Roads & Bridges |
Cairo, Giza, Qaliobia |
|
Total |
20,637 |
15,233,900,000 |
Appendix 5: Top 10 largest expropriation projects by area overlapping with agricultural land (Feddan)
|
Project |
Agriculture (Feddan) |
Total Area (Feddan) |
Category |
Agency |
Governorate |
|
High Speed Rail network Line One (Sokhna – Matrouh) |
2,730 |
6,755 |
Transportation |
Ministry of Transport |
Suez, Cairo, Giza, Menofia, Behira, Alexandria, Matrouh |
|
New Delta Water Route |
1,568 |
3,986 |
Irrigation |
Ministry of Water Resources & Irrigation |
Behira, Alexandria, Matrouh |
|
Al-Fashn Nile Crossing |
346 |
347 |
Roads & Bridges |
Ministry of Transport |
Beni Suef |
|
Bahr El Baqar to East Suez Canal Water Route |
339 |
339 |
Irrigation |
Ministry of Water Resources & Irrigation |
Port Said |
|
Manfalut Nile Crossing |
291 |
318 |
Roads & Bridges |
Ministry of Transport |
Asiut |
|
High Speed Rail network Line Two (6th October – Abu Simbel) |
262 |
4,012 |
Transportation |
Ministry of Transport |
Giza, Fayoum, Beni Suef, Minia, Asiut, Sohag, Qena, Luxor, Aswan, New Valley |
|
Dairut Nile Crossing |
215 |
297 |
Roads & Bridges |
Ministry of Transport |
Asiut |
|
North Luxor Nile crossing |
129 |
289 |
Roads & Bridges |
Ministry of Transport |
Luxor |
|
Abu Tig Nile Crossing |
126 |
159 |
Roads & Bridges |
Ministry of Transport |
Asiut |
|
Maria Road Axis |
35 |
370 |
Roads & Bridges |
Ministry of Transport |
Alexandria |
|
Total |
6,041 |
16,872 |
Appendix 6: Top 10 largest expropriation projects in urban areas by housing units
|
Project |
Residential Units (No.) |
Category |
Agency |
|
Greater Cairo Ring Road Widening |
8,916 |
Roads & Bridges |
Ministry of Transport |
|
Nazlet El-Semman Redevelopment |
2,114 |
Urban Redevelopment |
Ministry of Local Development |
|
Amr Ibn Al-Aas Axis |
1,614 |
Roads & Bridges |
Ministry of Housing, Utilities & Urban Communities |
|
Lieutenant General Kamal Amer Axis |
1,443 |
Roads & Bridges |
Ministry of Housing, Utilities & Urban Communities |
|
Anwar El Sadat Axis |
1,346 |
Roads & Bridges |
Ministry of Local Development |
|
El-Mex Port Redevelopment – Phase 1 |
678 |
Ports |
Ministry of Transport |
|
Cairo – Ismailia Agri. Highway Widening |
581 |
Roads & Bridges |
Ministry of Transport |
|
Gihan El Sadat Axis |
566 |
Roads & Bridges |
Ministry of Housing, Utilities & Urban Communities |
|
High Speed Rail network Line One (Sokhna – Matrouh) |
427 |
Transportation |
Ministry of Transport |
|
Salhiya – Ferdan Highway Widening |
131 |
Roads & Bridges |
Ministry of Transport |
|
Total |
17,816 |
Notes & Sources
1 For example see: “Social Housing Project “Ahalena 1″ in El-Salam 1 District, Cairo.” The Presidency, December 2018.
2 See for example Minister of Local Development Decree 237/2025.
3 Supreme Constitutional Court ruling 11/23c, May 13 2018.
4 Law 10/2022 decontrolled Old Rent for legal persons over a five year period.
5 See for example Minister of Education decrees 61, 174 and 471/2024.
6Cairo Governor Decrees 10285 and 2149/2024.